


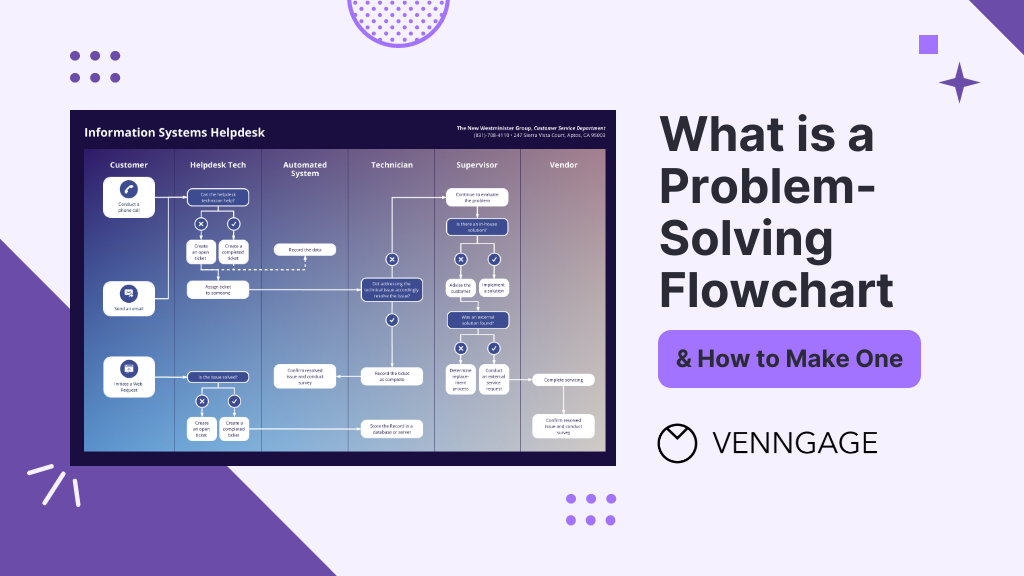
Problem-Solving Flowcharts, contrary to what many believe aren’t just aesthetic wonders — they’re almost like magical blueprints for troubleshooting those pesky problems that many of us face.
Flowcharts take business challenges and turn them into a navigable pathway. In this post, I will guide you on key aspects of problem-solving flowcharts such as what it is, the advantages of problem-solving flowcharts, how to create one and more.
Besides, you’ll also discover how to create problem-solving flowcharts with the help of Venngage’s Flowchart Maker.
And for those of you thinking, “I’m no designer, how can I create one?” worry not! I’ve got you covered. Just hop on Venggage’s Flowchart Templates and you’ll be charting your way to problem-solving glory in no time.
Click to jump ahead:
- What are problem-solving flowcharts?
- When to use problem-solving flowcharts?
- What are the advantages of flowcharts in problem-solving?
- What are the 7 steps of problem-solving flowcharts?
- 5 different types of problem-solving flowcharts
- Best practices for designing effective problem-solving flowcharts
- How to make a flowchart using Venngage?
- Problem-solving flowcharts FAQs
- Final Thoughts
What are problem-solving flowcharts?
Problem-Solving Flowcharts is a graphical representation used to break down problem or process into smaller, manageable parts, identify the root causes and outline a step-by-step solution.
It helps in visually organizing information and showing the relationships between various parts of the problem.
This type of flowcharts consists of different symbols and arrows, each representing different components or steps in the problem-solving process.
By following the flow of the chart, individuals or teams can methodically approach problem, analyze different aspects of it and come to a well-informed solution.
When to use problem-solving flowcharts?
Problem-Solving Flowcharts is a versatile tool that can be used in various scenarios. Here’s when to consider utilizing one:
- Complex Problems: When faced with a multifaceted issue that involves multiple steps or variables, flowcharts can help break down the complexity into digestible parts.
- Team Collaboration: If you’re working with a team and need a common understanding of problem and its potential solutions then a flowchart provides a visual that everyone can refer to.
- Analyzing Processes: In a situation where you need to understand a particular process, whether it’s within a project or a part of regular operations then mapping it out in a flowchart can offer clarity.
- Decision Making: When various paths or decisions might be taken, a flowchart can outline the potential outcomes of each aiding in making an informed choice.
- Training and Onboarding: Flowcharts can be used in training materials to help new employees understand complex processes or procedures which makes the learning curve smoother.
- Identifying Root Causes: If you’re looking to identify the underlying causes of problem then a flowchart can facilitate a systematic approach to reaching the root of the issue.
Related: How to Use Fishbone Diagrams to Solve Complex Problems
What are the advantages of flowcharts in problem-solving?
Problem-solving flowcharts can offer several benefits to the users who are looking to solve a particular problem. Few advantages of flowcharts in problem solving are:
Visual Clarity
When you’re dealing with multifaceted problems or processes, words alone can make the situation seem even more tangled. Flowcharts distill these complexities into easily understandable visual elements.
By mapping out each phase or component of problem, flowcharts offer a bird’s eye view enabling individuals to grasp the bigger picture and the finer details simultaneously.
Sequential Representation
Flowcharts excel in laying out the sequence of events or actions. By indicating a clear starting point and illustrating each subsequent step, they guide users through a process or solution path methodically.
This linear representation ensures that no step is overlooked and each is executed in the right order.
Collaboration
Problem-solving often requires team effort and flowcharts are instrumental in fostering collaborative environments.
When a team is discussing potential solutions or trying to understand problem’s intricacies, a flowchart serves as a collective reference point.
It aids in synchronizing everyone’s understanding, minimizing miscommunications and promoting constructive discussions.
Read more about: Flowcharts Symbols and Meaning
What are the 7 steps of problem-solving flowcharts?
1. Define the Problem
Before anything else, it’s essential to articulate the problem or task you want to solve clearly and accurately. By understanding exactly what needs to be addressed you can ensure that subsequent steps align with the core issue.
2. Identify the Inputs and Outputs
Determine what inputs (such as data, information or resources) will be required to solve the problem and what the desired outputs or outcomes are. Identifying these factors will guide you in structuring the steps needed to reach the end goal and ensure that all necessary resources are at hand.
3. Identify the Main Steps
Break down the problem-solving process into its main steps or subtasks. This involves pinpointing the essential actions or stages necessary to reach the solution. Create a roadmap that helps in understanding how to approach the problem methodically.
4. Use Decision Symbols
In problem-solving, decisions often lead to different paths or outcomes. Using standard symbols to represent these decision points in the flowcharts allows for a clear understanding of these critical junctures. It helps visually present various scenarios and their consequences.
5. Add Descriptions and Details
A well-designed flowcharts is concise but clear in its labeling. Using arrows and short, descriptive phrases to explain what happens at each step or decision point ensures that the flowcharts communicates the process without unnecessary complexity.
6. Revise and Refine
Creating a flowcharts is not always a one-and-done process. It may require revisions to improve its clarity, accuracy or comprehensiveness. Necessary refinement ensures that the flowcharts precisely reflects the problem-solving process and is free from errors or ambiguities.
7. Use Flowchart Tool
While it’s possible to draw a flowcharts manually, using a flowcharts tool like Venngage’s Flowchart Maker and Venngage’s Flowchart Templates can make the process more efficient and flexible. These tools come with pre-designed templates and intuitive interfaces that make it easy to create, modify and share flowcharts.
5 different types of problem-solving flowcharts
Let’s have a look at 5 most common types of flowcharts that individuals and organizations often use.
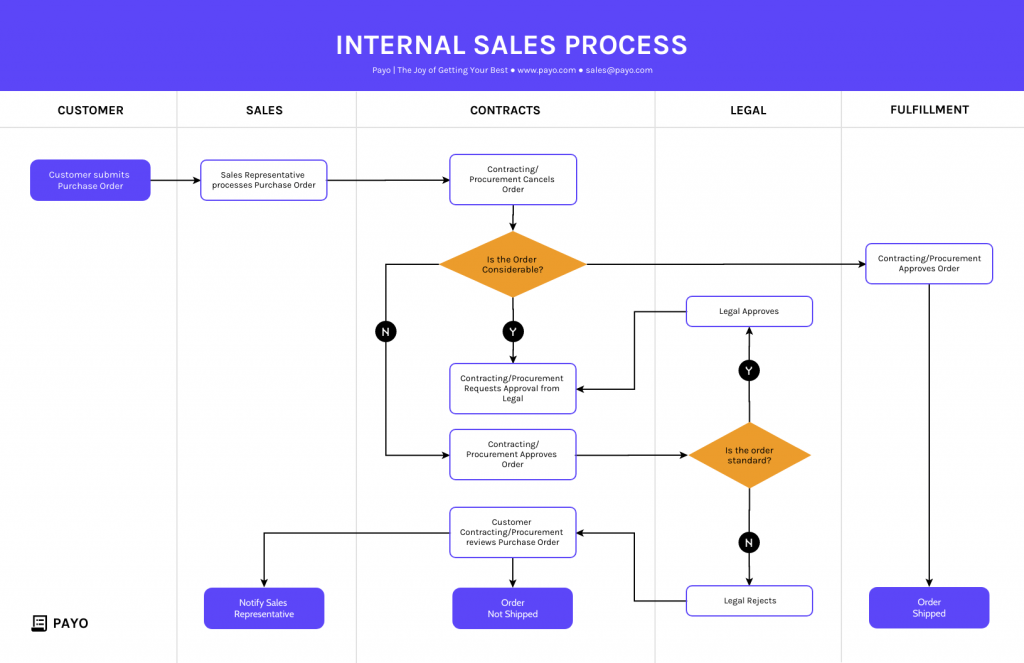
1. Process Flowcharts
A process flowcharts is a visual representation of the sequence of steps and decisions involved in executing a particular process or procedure.
It serves as a blueprint that showcases how different stages or functions are interconnected in a systematic flow and it highlights the direction of the process from its beginning to its end.
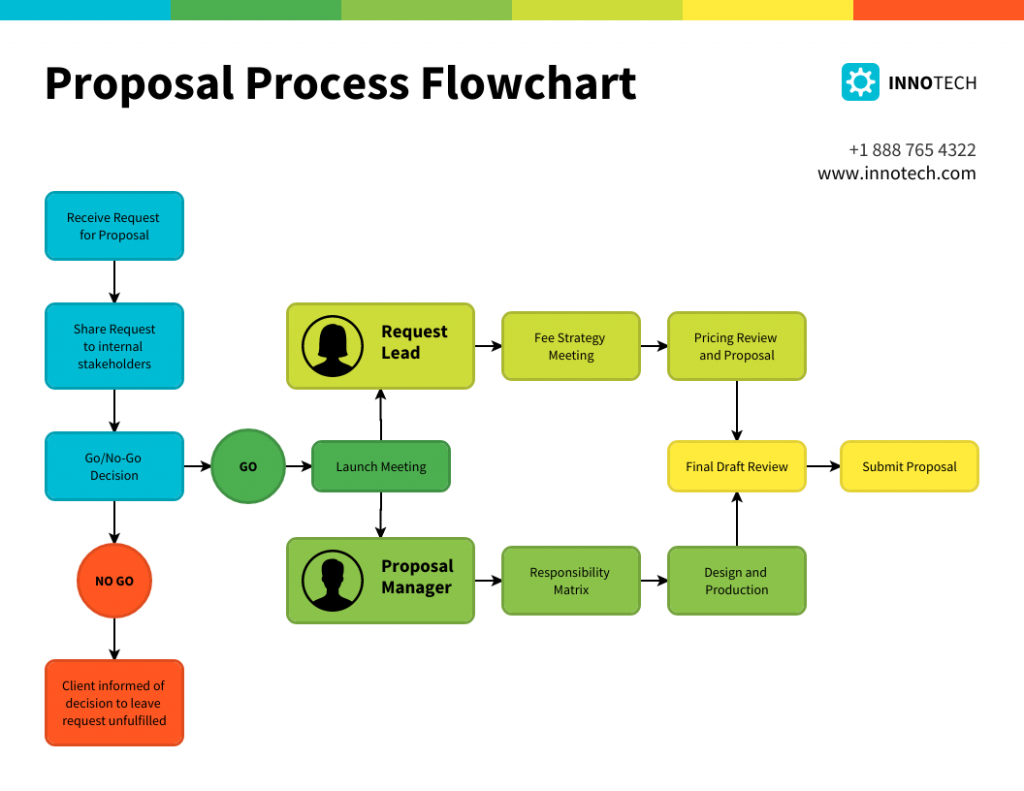
Process flowcharts are instrumental in training and onboarding, sales process, process optimization, documentation, recruitment and in any scenario where clear communication of a process is crucial.
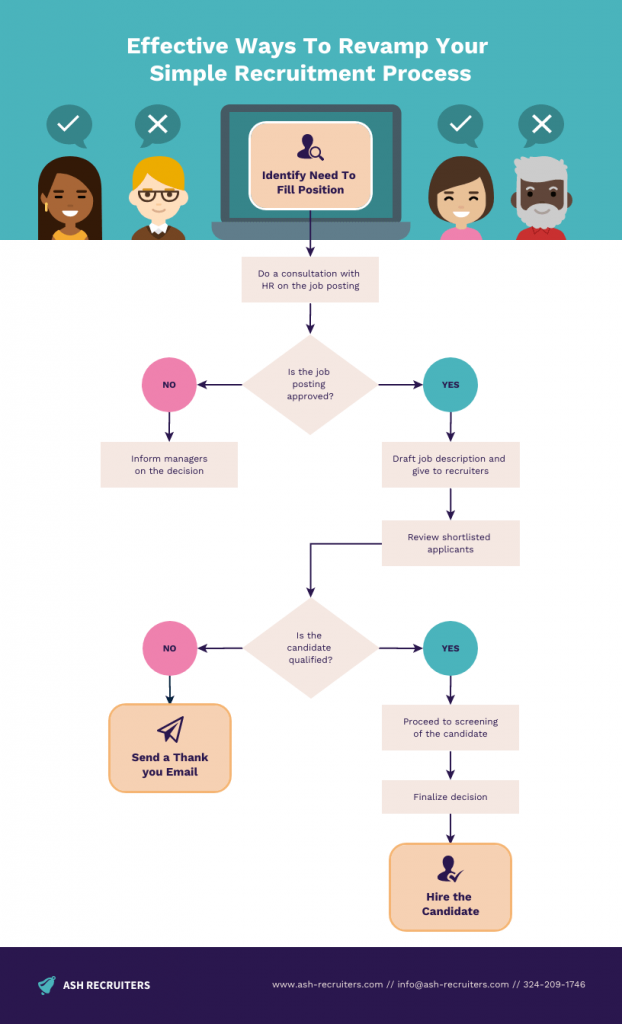
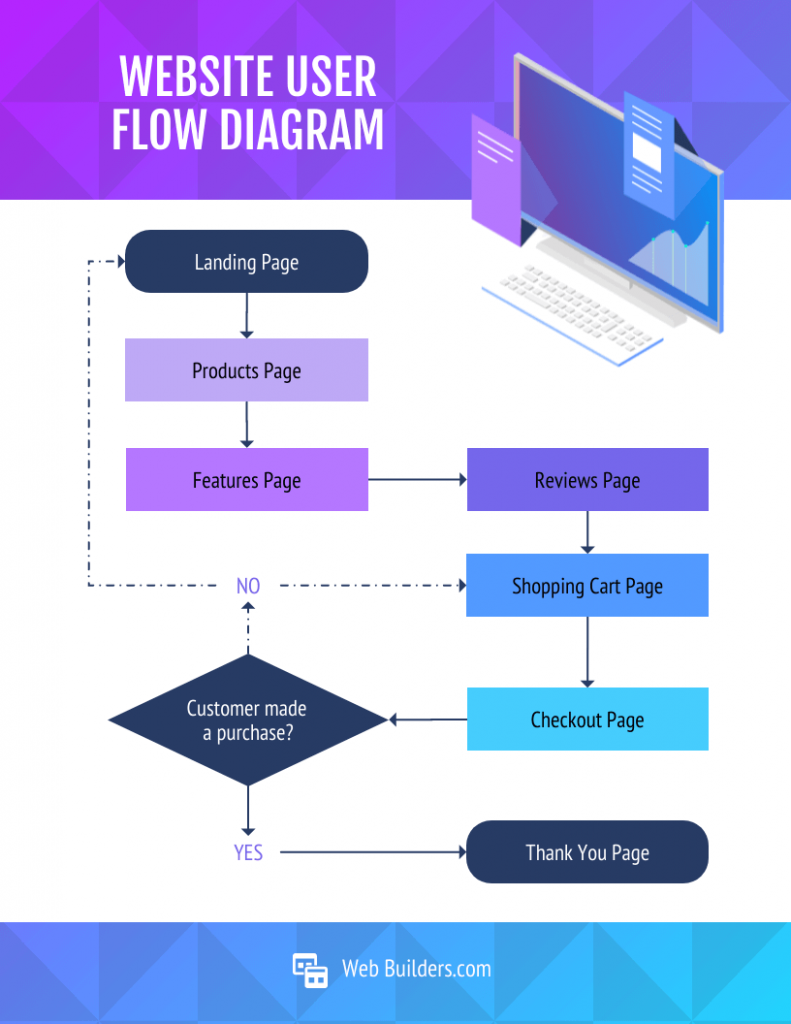
2. Flowcharts Infographic
A flowcharts infographic is a great way to showcase the process or a series of steps using a combination of graphics, icons, symbols and concise text. It aims to communicate complex information in a clear and easy-to-understand manner, making it a popular tool for conveying information, data and instructions in a visually engaging way.
For example, you can use this flowchart to illustrate a health insurance process that visually explains the steps involved from finding a provider to paying for your healthcare provider.

3. Circular Flowcharts
A circular flowcharts is used to illustrate the flow of information, goods, services or money within a closed system or process. It gets its name from its circular shape, which emphasizes the continuous and cyclical nature of the flow.

Circular flowcharts are widely used in various fields such as economics, business, engineering and process management to help visualize and understand complex systems.
In a circular flowcharts, elements are represented using various shapes and connected with arrows to indicate the direction of flow. The circular arrangement indicates that the process is ongoing and repeats itself over time.
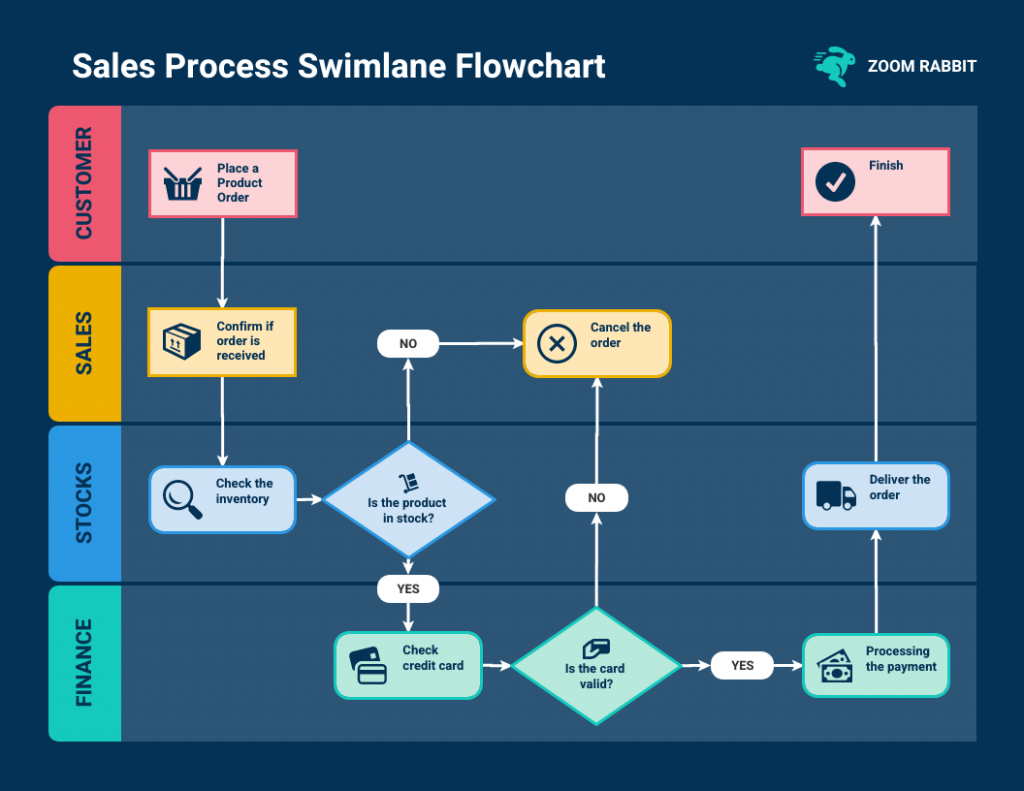
4. Swimlane flowcharts
Swimlane flowcharts, also known as cross-functional flowcharts are a specific type of flowchart that organizes the process flow into lanes or “swimlanes.”
Each lane represents a different participant or functional area involved in the process and the flowchart shows how activities or information move between these participants.
Swimlane flowcharts are particularly useful for illustrating complex processes that involve multiple stakeholders or departments.
In a swimlane flowcharts, the process is divided horizontally into lanes and each lane is labeled with the name of the department, person or role responsible for that part of the process. Vertically, the flowchart displays the sequence of steps or actions taken in the process.
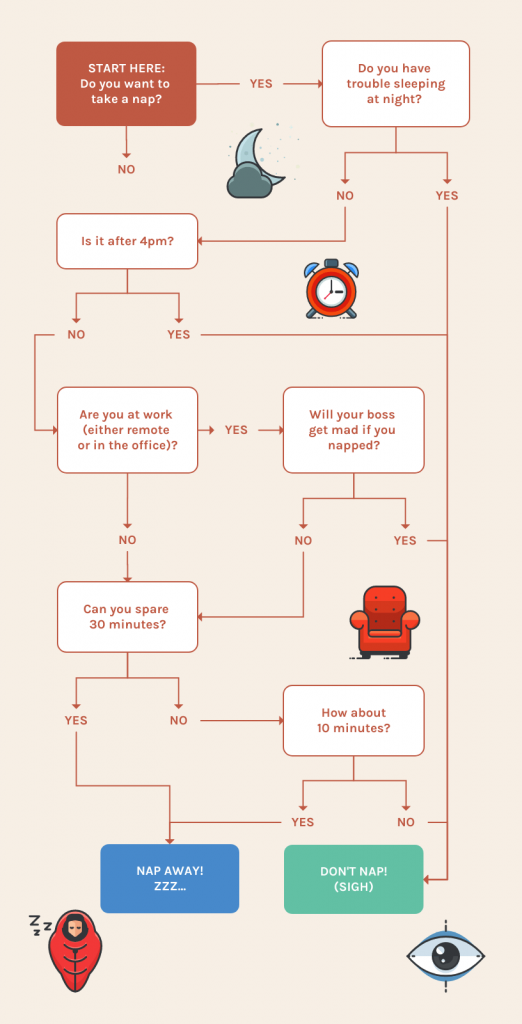
5. Decision Flowcharts
Decision flowcharts, also known as decision trees or flow diagrams are graphical representations that illustrate the process of making decisions or solving problems.
They are widely used in various fields such as computer science, business mapping, engineering and problem-solving scenarios.
Decision flowcharts help break down complex decision-making processes into simple, sequential steps, making it easier to understand and follow.
A decision tree is a specialized flowchart used to visually represent the process of decision-making.
Businesses and other individuals can employ a decision tree analysis as a tool to aid in evaluating different options and the possible consequences associated with each choice.
Decision trees Infographics can be used to create a more nuanced type of flowchart that is more informative and visually appealing by combining a decision flowchart and the flowchart infographic.
Decision flowcharts are valuable tools for visualizing decision-making processes, analyzing complex problems and communicating them effectively to others.
Best practices for designing effective problem-solving flowcharts
Designing effective problem-solving flowcharts involves careful consideration of various factors to ensure clarity, accuracy and usability. Here are some best practices to create efficient and useful problem-solving flowcharts:
- Understand the problem first & clearly define it
- Keep it simple
- Use standard & recognizable symbols
- Ensure that the flowchart follows a logical and sequential order
- Clearly label each decision point, action and outcome
- Verify the flowchart’s accuracy by testing it
- Clearly state the decision criteria that lead to different branches
- Provide context when the flowchart is part of a larger process or system
- Review and revise the flowchart
How to make a flowchart using Venngage?
Creating problem-solving flowchart on Venngage is incredibly simple. All you have to do is:
- Start by Signing Up and Creating an Account with Venngage
- Choose a flowchart template that best suits your needs from our library.
- Start editing your flowchart by choosing the desired shapes, labels and colors.
- You can also enhance your flowchart by incorporating icons, illustrations or backgrounds all of which are readily available in our library.
- Once done, you will have 2 options to choose from, either sharing it online for free or downloading your flowchart to your desktop by subscribing to the Premium or Business Plan.
Problem-solving flowcharts FAQs
Is flowchart the representation of problem solutions?
Flowcharts are not the representation of problem solutions per se; rather, they are a visual representation of processes, decision-making steps and actions taken to arrive at a solution to problem.
What are the 3 basic structures of flowcharts?
3 Basic Structures of Flowcharts are:
- Sequence: Simplify Complexity
- Selection (Decision): Embrace Choices
- Repetition (Loop): Emphasize Iteration
What are the elements of a good flowchart?
A good flowchart should exhibit clarity and simplicity, using consistent symbols and labels to depict a logical sequence of steps. It should be readable, with appropriate white space to avoid clutter while eliminating ambiguity through well-defined decision criteria and paths.
Can flowcharts be used for both simple and complex problem-solving?
Yes, flowcharts can be used for both simple and complex problem-solving scenarios. Flowcharts are versatile visual tools that can effectively represent various processes, decision-making steps and problem-solving approaches regardless of their complexity.
In both cases, flowcharts offer a systematic and visual means of organizing information, identifying potential problems and facilitating collaboration among team members.
Can problem-solving flowcharts be used in any industry or domain?
Problem-solving flowcharts can be used in virtually any industry or domain. The versatility and effectiveness of flowcharts make them applicable to a wide range of fields such as Business and Management, Software Development and IT, Healthcare, Education, Finance, Marketing & Sales and a lot more other industries.
Final thoughts
Problem-solving flowcharts are a valuable and versatile tool that empowers individuals and teams to tackle complex problems with clarity and efficiency.
By visually representing the step-by-step process of identifying, analyzing and resolving issues, flowcharts serve as navigational guides simplifying intricate challenges into digestible parts.
With the aid of modern tools like Venngage’s Flowchart Maker and Venngage’s Flowchart Templates, designing impactful flowcharts becomes accessible to all while revolutionizing the way problems are approached and solved.


