
Health Insurance Process Infographic Template
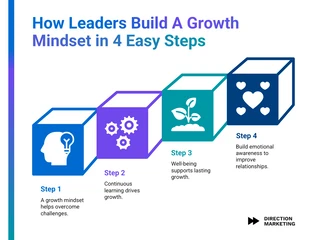
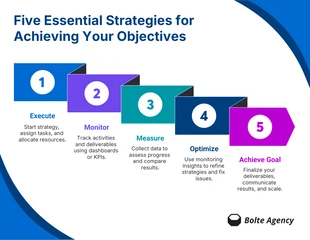
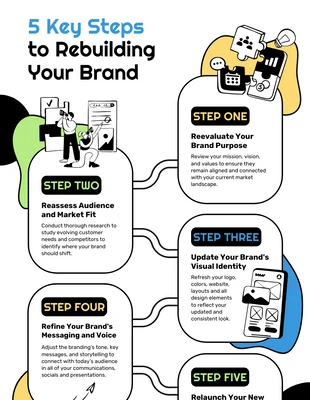
Visualize complex processes and data flows by using a flowchart infographic template to clearly illustrate how systems work.

 100% customizable templates
 Millions of photos, icons, charts and graphics
 AI-powered editing features
 Effortlessly share, download, embed and publish
 Easily generate QR codes for your designs
- Design stylemodern, vintage
- Colorslight
- SizeCustom (794 x 1200 px)
- File typePNG, PDF, PowerPoint
- Planbusiness
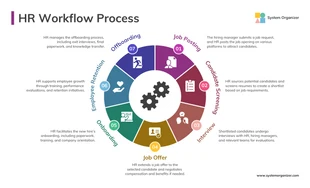
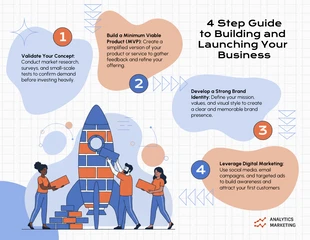
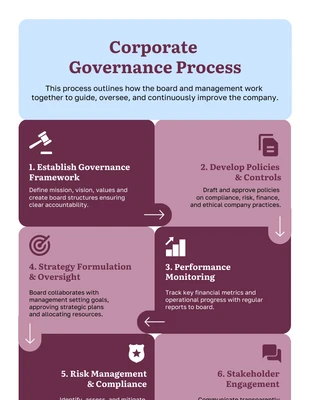
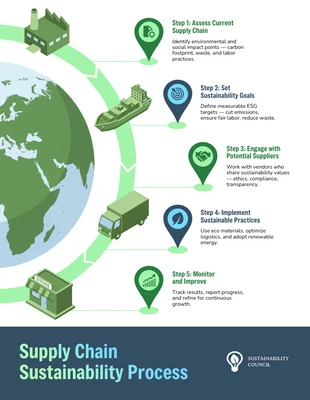
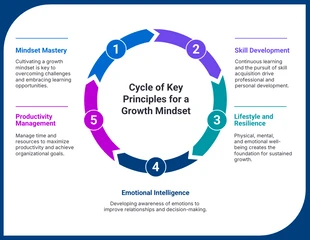
A flowchart infographic is a great way to visualize complex processes and data flows. By using simple shapes and arrows, you can clearly see how information or tasks move from one step to the next. It can also help you understand the relationships between different concepts. This type of infographic is especially useful for explaining complicated systems or processes, such as in financial reporting or manufacturing. It clarifies complex data or processes by breaking down information into manageable steps so that the audience can follow along and see the big picture. If you are looking for a free and easy-to-edit flowchart infographic template, Venngage offers a wide selection. You can come up with an eye-catching flowchart infographic even if you don’t have any background in design. When constructing a flowchart infographic, there are a few things to keep in mind. First, start by outlining the steps involved in the process or data you’re trying to communicate. Then, decide on the best way to represent each step – this could be with an icon, image, or simple text. Once you have your outline,
Related Infographic Templates

process infographics
process infographics
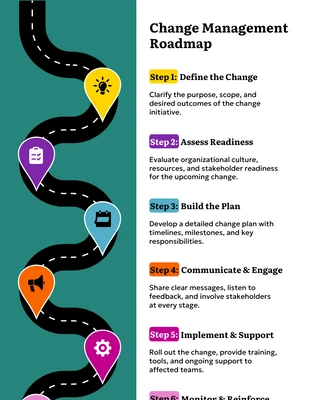
process infographics
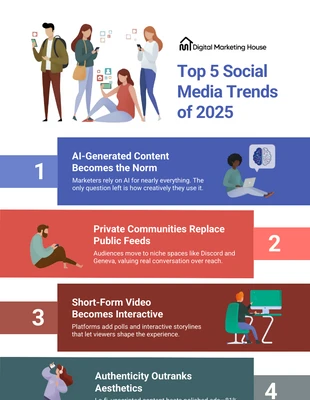
list infographics
informational infographics
process infographics
process infographics
process infographics
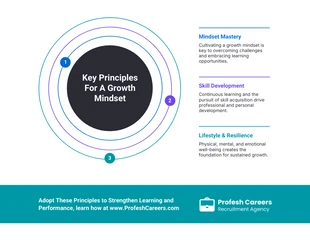
circle infographics
process infographics
list infographics
process infographics