


Perhaps there is nothing more ubiquitous, quintessential and delightful than the Venn diagram.
You may have noticed how they have a tendency to appear in social media feeds, online forums and whiteboard discussions.
And it’s no secret how much we love them at Venngage — they only inspired our company name after all!
So it’s only natural I show you just how awesome Venn diagrams are, and how you can easily create one to help you with any communication challenge with Venngage’s Venn Diagram Maker.
Don’t want to design a Venn diagram from scratch? Check out our library of Venn diagram templates instead that lets you customize to your heart’s desire.
Note: Some of our Venn diagram templates are free to use and some require a small monthly fee. Sign-up is always free, as is access to Venngage’s online drag-and-drop editor.
Click to jump ahead:
- What is a Venn diagram?
- Purpose of Venn diagrams
- Venn diagram examples
- Types of Venn diagrams
- What can Venn diagrams be used for?
- How to create a Venn diagram
What is a Venn diagram?
A Venn diagram is a graphical representation that shows similarities and differences between items, concepts or data.
They utilize shapes, often circles, to illustrate relationships and compare data.
Venn diagrams are certainly one of the most well-known types of diagrams.
Here’s an example of a Venn diagram. This design, featuring a series of simple circles or ellipses that overlap is ubiquitous.

The overlapping region of a Venn diagram indicates similarities while others showcase differences.
Although the Venn diagram was created to describe mathematically logical relationships, it’s now used to show all types of relationships.
What is the purpose of Venn diagrams?
The purpose of Venn diagrams is to visually represent relationships between different groups of items or concepts.
Here are some use cases where you’ll want a Venn diagram.
- Organize diverse information: Venn diagrams help organize data in a way that makes it easy to understand relationships between data.
- Compare choices: Venn diagrams are perfect tools when you want to compare two or more choices. They highlight shared elements and distinctive features, enabling anyone to make informed decisions.
- Solve complex problems: Venn diagrams aid in logical reasoning by depicting logical relationships between different elements or statements. For a more advanced guide, check out our post on Venn diagram symbols to see how they help with complex problem-solving.
15 Venn diagram examples
There’s no denying Venn diagrams are popular.
Businesses use them for everything from internal whiteboard sessions to customer-facing ads to inspiration for new products.
Here are some example situations where Venn diagrams really shine.
Compare different solutions
One of the most frequent uses for a Venn diagram is comparing different products, services, or solutions.
Here’s an example comparing two different products by listing things customers are interested in that might cause them to select one over the other:

Source: Tech Digest
Here’s another Venn diagram comparing two different services and what they both offer:

Source: diff.wiki
This Venn diagram describes two offerings and the relationships between them:

Source: InformationWeek
In this example, a Venn diagram details three complementary options.
Again, each can stand alone, or they can be combined:
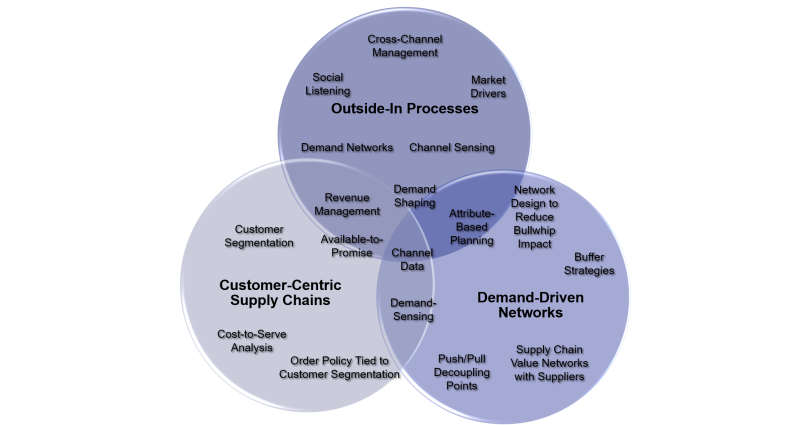
Source: Supply Chain Shaman
Highlight combinations and overlaps
Venn diagrams are also great if you want to draw attention to combinations or overlaps.
This simple Venn diagram shows how classrooms today use a combination of different instructions:

Source: Imagine Learning
This Venn diagram emphasizes how critical events impact people and other assets:

Source: CIPHR
This innovative, non-hierarchical spin on an organizational chart is meant to describe how roles can bridge different teams and departments:

Source: Metal Toad
Describe markets
Some of the above examples demonstrate how useful Venn diagrams are for helping people better understand complex topics and ideas.
But they can also help break down markets.
This Venn diagram outlines market segments or niches:

And here’s another that shows the relationship between various competitors based on offerings:

Source: Wall Street Journal
Explain concepts
Some ideas can be so abstract that you’ll need a diagram to help colleagues or clients get the big idea.
For example, you can use a Venn diagram to explain corporate culture.

Source: Dan Pontefract
And…sources of competitive advantage…

Source: Transmission
Or… even how to unlock innovation.

Source: UX Studio
Advertise brands and products
Many of the examples so far are meant to help inform conversations that happen inside companies.
But due to the popularity of Venn diagrams, they are also being used as customer-facing visuals and even products.
For example, Venn diagrams helped inspire the evolution of Mastercard’s logo:

Source: Mashable. Credit: Pentagram / Mastercard
They were also used in a McDonald’s advertising campaign several years ago:

Source: TRENDHUNTER
But this example takes the cake.
Nike released a new sneaker inspired by and named after the Venn Diagram known as the Nike Air Max 90 “Venn Diagram”.

Source: Sneaker News
3 types of Venn diagrams
Several types of Venn diagrams are used to represent different types of relationships between sets.
For most needs, a two-set, three-set, and four-set Venn diagram is enough to analyze simple and/or complex scenarios.
Two-set
This is the simplest type of Venn diagram and one we all know.
It highlights the relationship between two sets using two circles, with the overlapping region showing the elements common to both sets.
Three-set
A three-set Venn diagram uses three shapes to represent the relationships between three sets.
The overlapping regions in this diagram indicate elements that are common to specific combinations of sets.

Four-set
A four-set Venn diagram uses four shapes to display the intersections and differences among the sets.
This allows for a more comprehensive visualization of the relationships and commonalities. The four-set Venn diagram is a valuable tool in various fields, such as mathematics, statistics, data analysis, and business or social sciences.

Remember, these are not the only types of Venn diagrams out there.
Here are some other types of Venn diagrams you can use:
- Five set
- Euler diagram
- Shaded Venn diagram
- Network Venn diagram
What can Venn diagrams be used for?
As we’ve seen, Venn diagrams are excellent for multiple reasons.
But let’s see some of their practical applications.
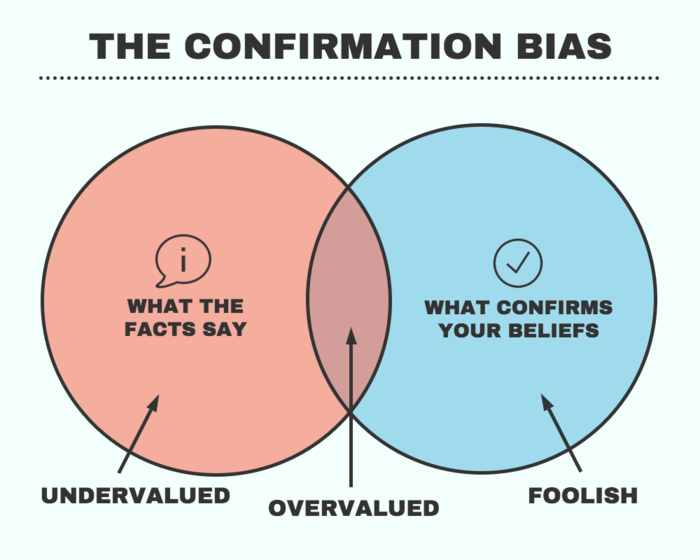
This diagram, for example, draws attention to an important intersection:

Want to compare two products, highlight the similarities and differences between two services, or show how a solution combines two ideas, then customize this Venn diagram template.
This example compares different options by detailing the strengths of each:
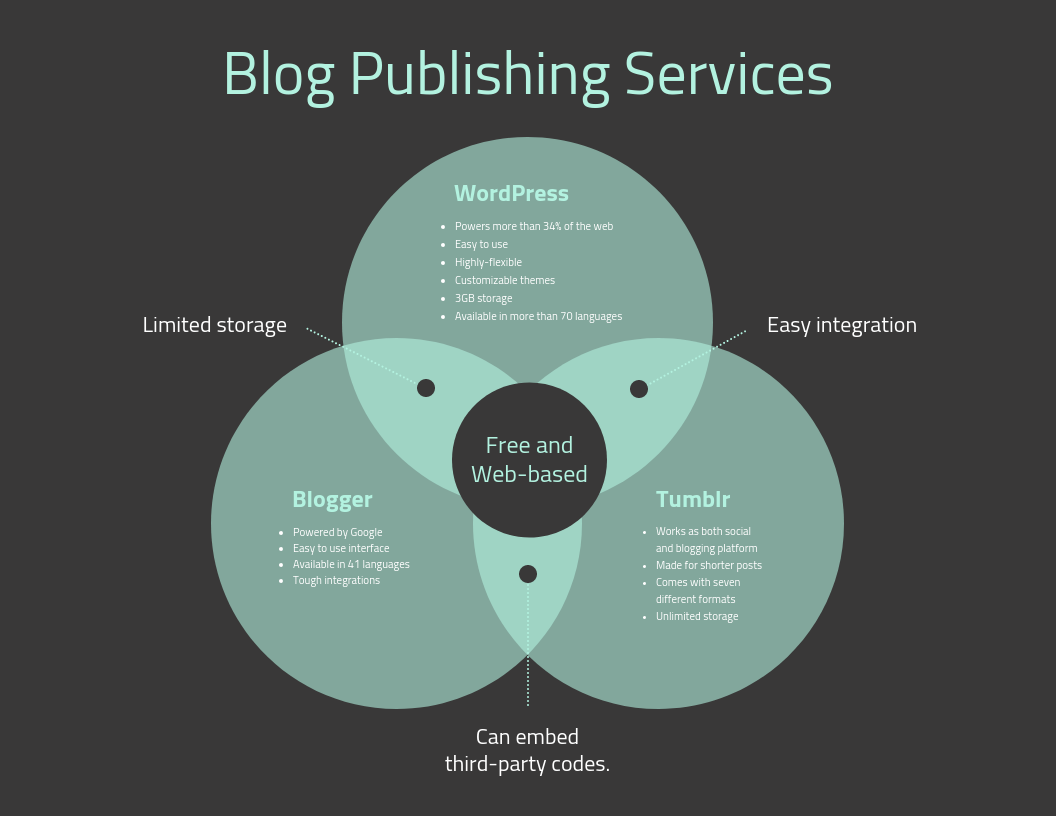
So if you want to describe service combinations or overlapping ideas, customize this Venn diagram template.
As you can see, Venn diagrams are incredibly flexible and can be used to see patterns of many kinds.
This visual uses a Venn diagram to describe a complex topic in a clarifying and engaging way:

You can customize this Venn diagram template to create a visual that explains your company’s customers, competitors, or culture, for example.
How to create a Venn diagram
Now that you’ve gotten lots of inspiration, it’s time to make your own Venn diagram!
Here are some simple steps to help you get from pen to Venn.
1. Try different concepts to see what works best
I highly recommend starting with pen and paper so you can start to map out the relationships you might want to show — it’s easy to draw rough-looking ovals after all.
This will allow you to better play around with ideas before you start working with software to create more polished designs.
You may even get inspired to think outside of the box.
Or you might decide there’s a fair amount to explain, and that a Venn diagram is certainly more attractive than a boring text document.

You might even mix it up by using squares or diamonds if that works well for the topic.

2. Choose a template
Although there are many tools out there that can help create a Venn diagram, I recommend using Venngage’s Venn Diagram Maker. Why?
Well, it’s an intuitive drag-and-drop editor that eliminates the need to have design experience. Just drag and drop elements to create your Venn diagram.
Or if you really want to get a head start, simply pick a Venn diagram template that fits what you outlined, and use Venngage to edit elements like icons, and logos.

Venngage offers over 40,000 icons and illustrations, 2,000 of which are diverse icons.
If you want to change an icon in a template, simply double-click the icon and choose the one you want to change it to:
3. Add straightforward labels
When it comes time to add text, think “keep it simple.”
Use language appropriate for your audience and try to integrate the text and the visual, rather than having one crowd out the other.
If you want to use a fair amount of text, be sure to use a format that still helps people be able to best understand the comparisons you are trying to make.


4. Be mindful of the size of the shapes
Labels aren’t the only thing that will be communicating your ideas to people.
The size of your shapes can also tell them what’s most important, most significant, or of the greatest magnitude.
For example, in this Venn diagram, the website portion stands out as foundational:

Use the size of shapes to help your audience know what matters most.
5. Select colors to help people read
You can also use color to help draw attention to certain elements or themes.
If you are creating a particularly complex Venn diagram, use color in ways that help your audience easily see differences and draw comparisons.


Want to learn other ways to create a Venn diagram? Check out these posts!
Summary: Venn diagrams are useful, versatile, easy to create, and even fun
You may never be as big of a fan of them as we are, but once you start using them, you will see how helpful they can be, for you, your colleagues, clients and customers.
No design experience? No problem. Venngage’s Venn Diagram Maker makes it easy for you to create engaging, beautiful Venn diagrams in minutes.


