


Venn diagrams are used to visually organize and compare information.
In a Venn diagram, similarities and differences between concepts are singled out in order to portray how they are connected.
Commonly used in problem-solving, comparative analysis, and understanding basic concepts, learning how to create a Venn diagram can help you simplify and bring clarity to complex ideas.
In this post, I’ll show you how to make a Venn diagram in Google Docs.
I’ll also examine how you can create better Venn diagrams with Venngage’s Venn Diagram Maker. If you don’t want to start from a blank canvas, check out our Venn diagram templates instead to create beautiful diagrams without any design skills.
A little heads-up. Some of our Venn diagram templates are free to use and some require a small monthly fee. Sign-up is always free, as is access to Venngage’s online drag-and-drop editor.
Click to jump ahead:
- 4 steps to create a Venn diagram in Google Docs
- Disadvantages of using Google Docs to create a Venn diagram
- How to make a Venn diagram with Venngage
- FAQs about Venn diagrams
4 steps to create a Venn diagram in Google Docs
Building a Venn diagram in Google Docs is fairly easy and can be summarized into four steps:
- Insert a drawing using Google Drawings
- Create your Venn diagram shapes
- Label the sections of your Venn diagram
- Format the diagram
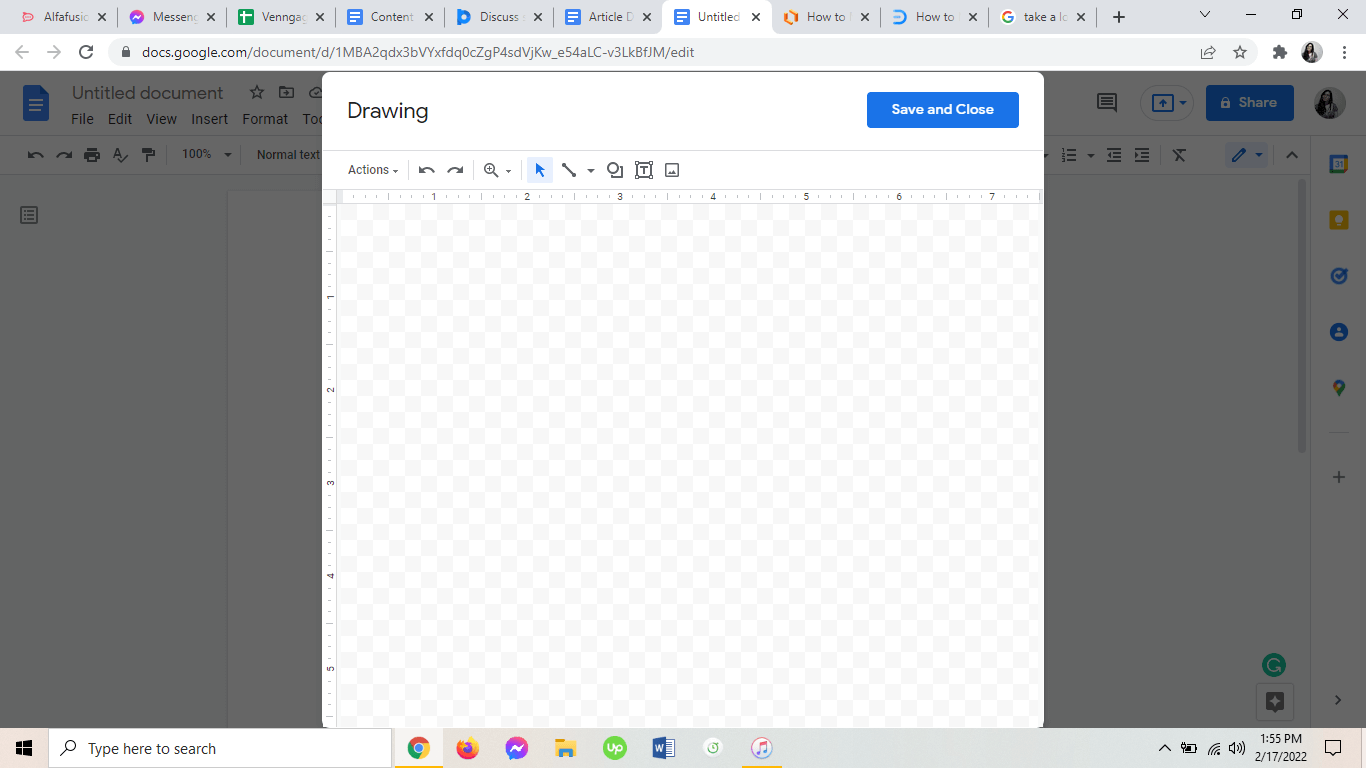
Step 1: Insert a drawing using Google Drawings
From the Insert tab in Google Docs, choose ‘Drawing’.
A pop-up window will open containing a blank canvas and the tools you need to draw your Venn diagram or other types of diagrams.
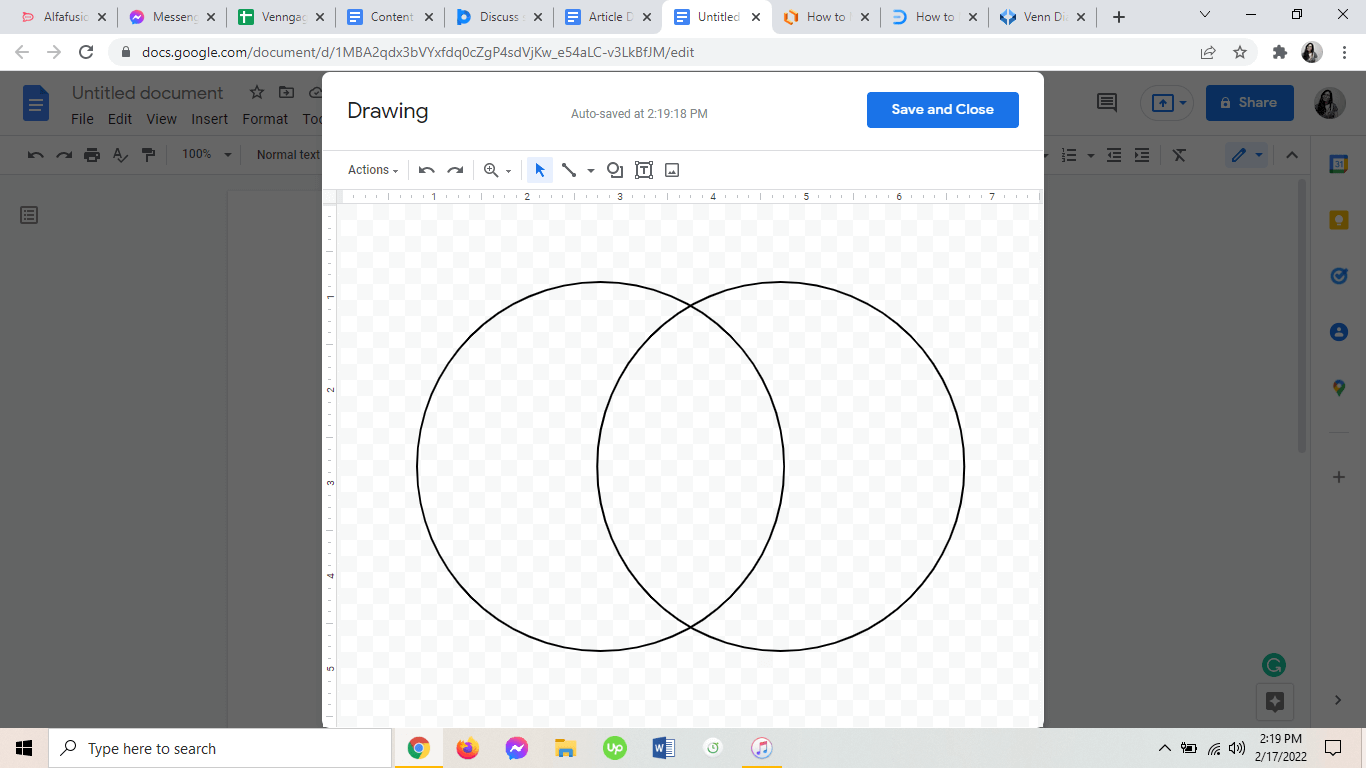
Step 2: Create your Venn diagram shapes
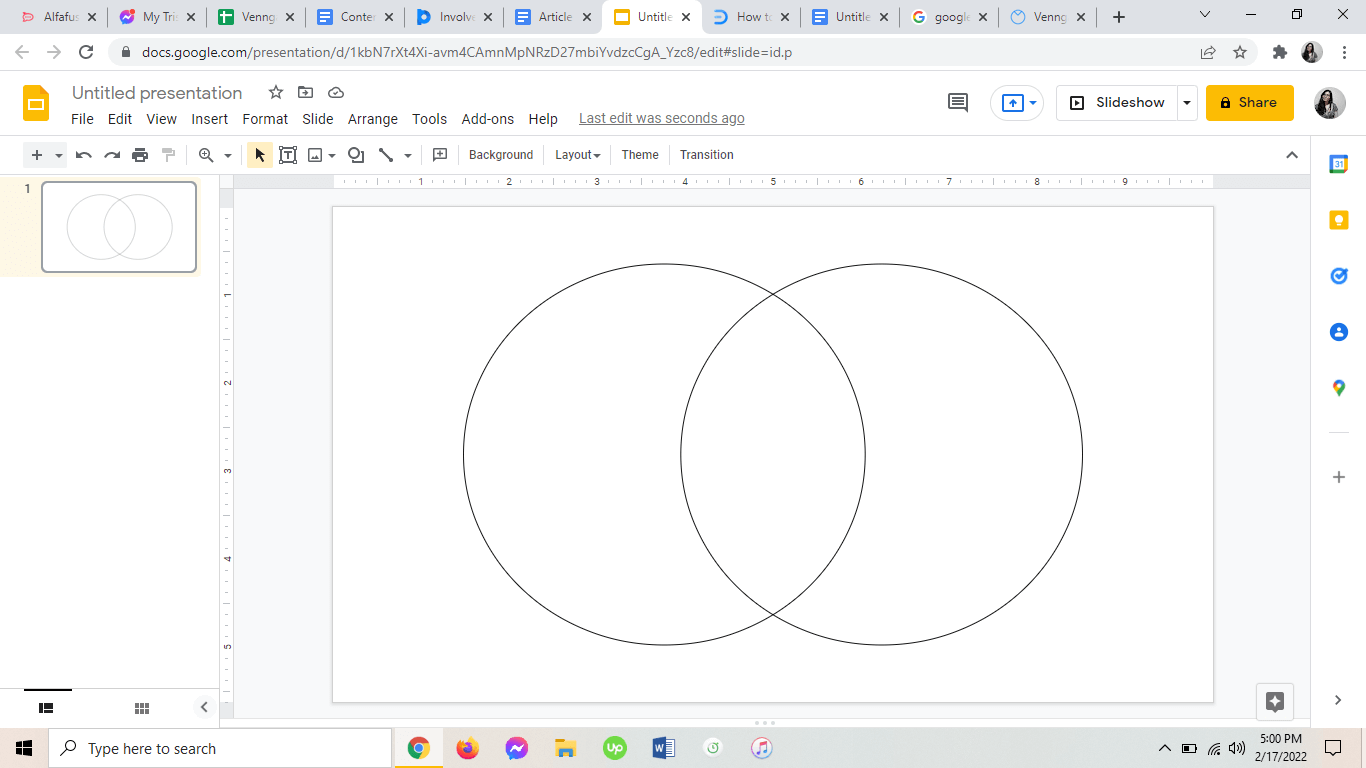
Now, select the ‘Shape’ tool, choose ‘Shapes’, and pick an oval or circle to draw two overlapping shapes.
Make sure the shapes have enough space inside them to put all the necessary information. The shapes should not be filled and should have a distinct outline.
There should now be three sections in your Venn diagram, including where the shapes intersect.
Note: For more information on Venn diagram terminology, read this post on Venn diagram symbols.
Add more shapes as needed if you’re comparing more than two things.
Step 3: Label the sections of your Venn diagram
Next, at the top of each circle, insert the desired names of concepts or topics.
They should be outside the circles for clarity and distinction. Use the ‘Text Box’ tool to add them.
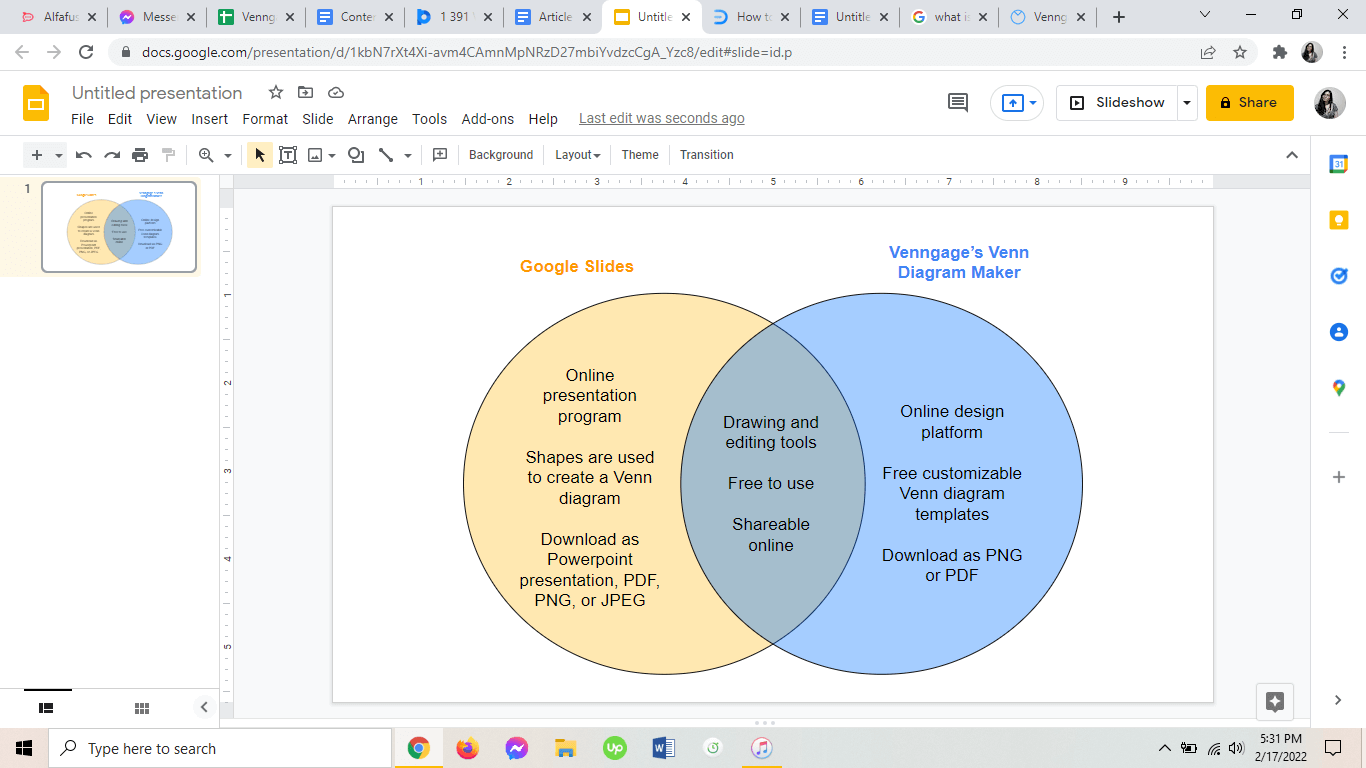
In the middle where two circles overlap, write the characteristics the concepts have in common. Then, on the opposite sections, input all the features that are unique to each concept.
Your Venn diagram should now look like this:
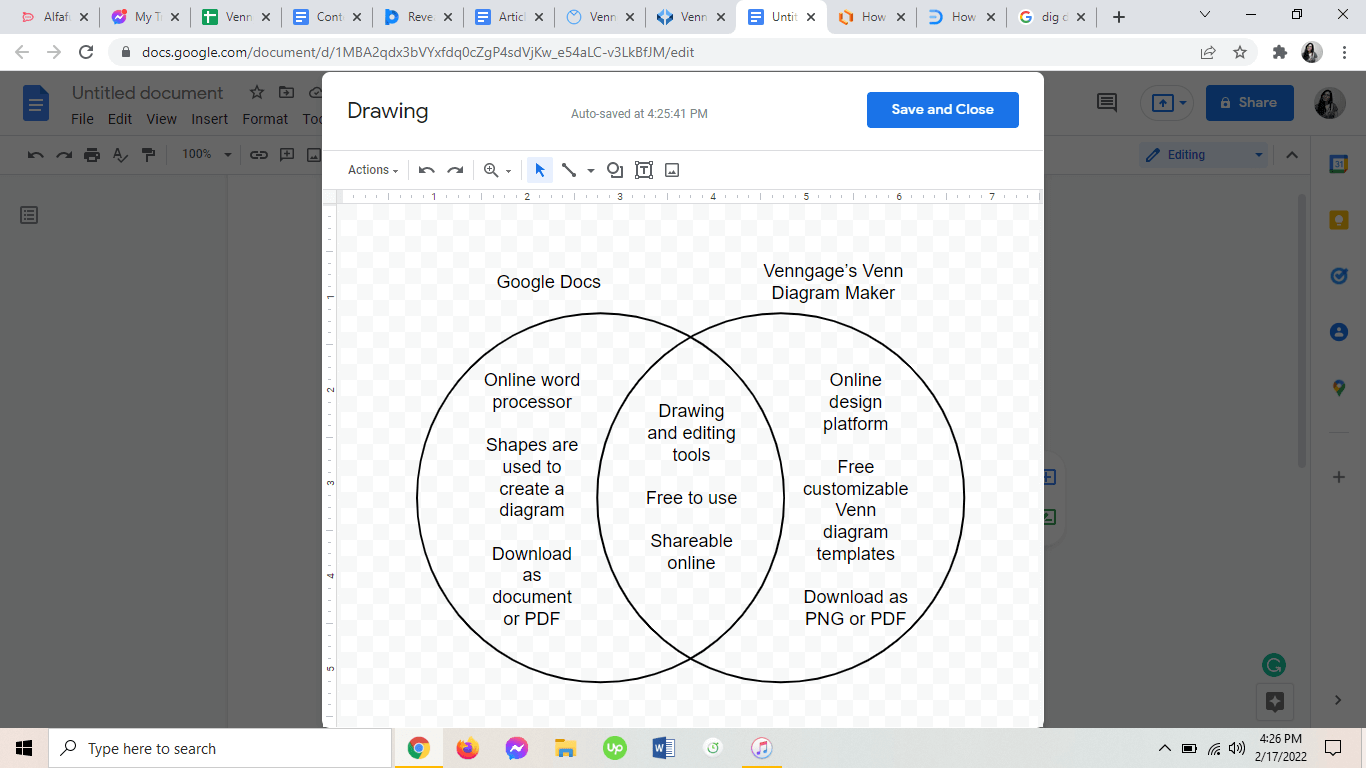
Dig deeper and think of advantages and disadvantages, benefits and limitations, and other factors to help you come up with a logical conclusion about the concepts.
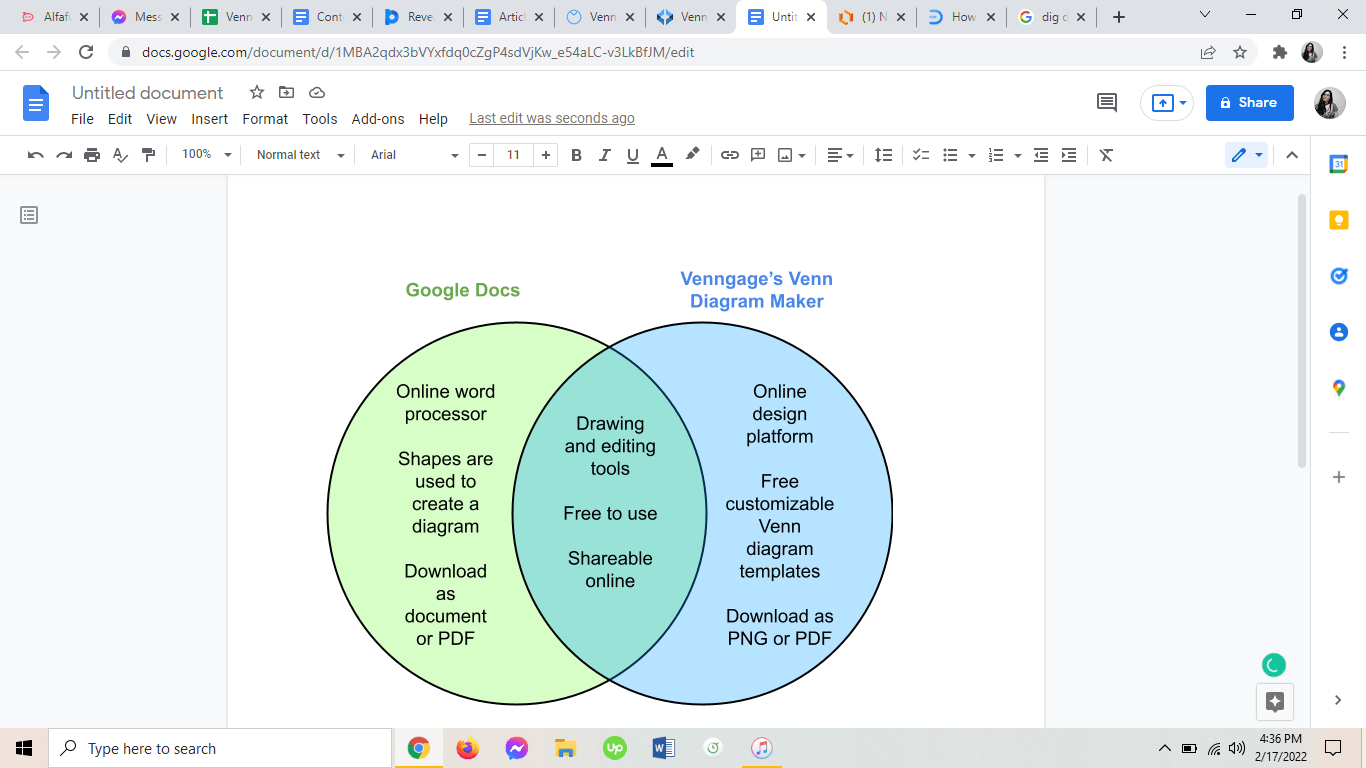
Step 4: Format the diagram
Finally, add design elements like colors and fonts to finish your diagram.
This will help you distinguish each section and concept better. Use the ‘Fill Color’ tool and play around with the transparency to create a distinct color for each section.
Once you’re done, click ‘Save’ and ‘Close’. Your Venn diagram will now be on your Google Doc:
How to make a Venn diagram in Google Slides
As part of the Google Workspace or formerly Google Apps, creating a Venn diagram in Google Slides involves the same steps.
In a new Google Presentation file, delete the text boxes so you’re left with just a blank slide.
Then from the ‘Insert’ tab, choose ‘Shapes’ and select an oval or circle shape.
Now, insert text boxes and fill in each section.
Edit the shape and font colors to complete your Venn diagram.
Note: Want to learn other ways to create Venn diagrams? Check out these posts:
Disadvantages of using Google Docs to create a Venn diagram
Although Google Docs is free and easy to use, it’s not a design tool. This means there are only limited things you can do to enhance the design of your Venn diagram.
Moreover, you have to manually build your Venn diagram using basic shapes because Google Docs doesn’t offer Venn diagram templates to speed up the creation process.
Last but not least, with Google Docs, you can only save your work as a PDF, text, or Word document, which is not ideal if you need to present your Venn diagram to teammates or audiences.
Since it takes more time and effort to make a Venn diagram in Google Docs, it is not a recommended tool for creating Venn diagrams.
How to make a Venn diagram with Venngage
Unlike Google Docs, Venngage’s Venn Diagram Maker is an online graphic design tool specifically made for creating Venn diagrams.
To make a Venn diagram in Venngage, follow these five steps:
- Sign up to create an account
- Select a Venn diagram template from Venngage’s templates library
- Replace the labels in each section with information about the topics or concepts you want to organize and compare
- Customize the colors, fonts, icons, and other elements to make the design unique
- Upgrade to a Business account to download your Venn diagram and get access to My Brand Kit or share your newly created Venn diagram for free
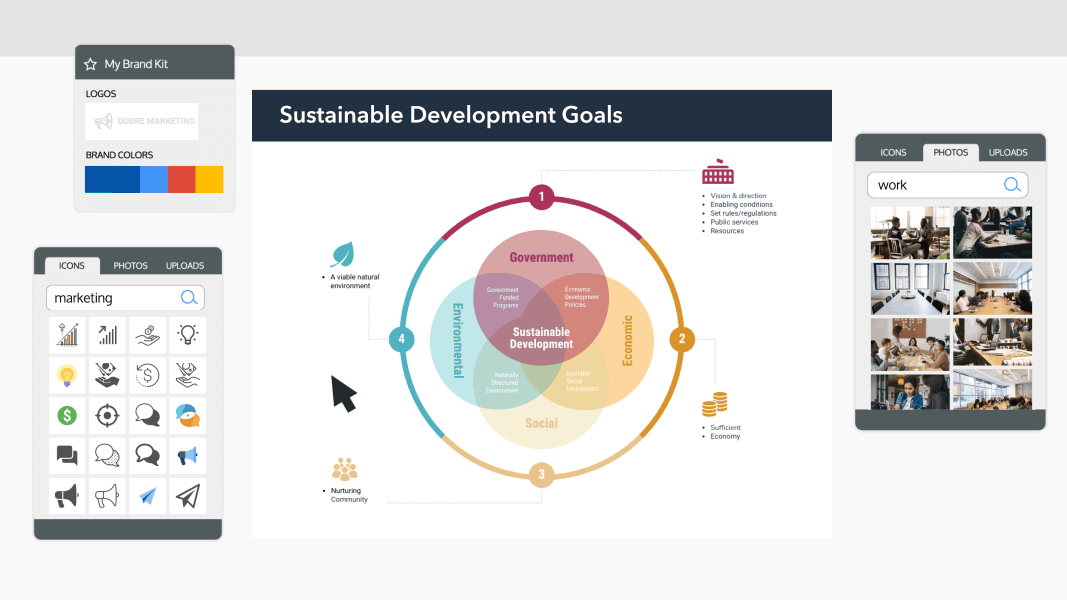
Here’s one example of a Venn diagram template you can customize with Venngage:

It already includes icons and a color scheme, so you can also use the template to simply analyze different marketing concepts.
Another advantage of Venngage’s Venn Diagram Maker is the user-friendly drag-and-drop editor that lets you easily add and edit elements.
Here’s another example of a Venn diagram template Venngage lets you customize with the smart editor:

You can change the colors, shapes, labels, and even choose new fonts, icons, and backgrounds.
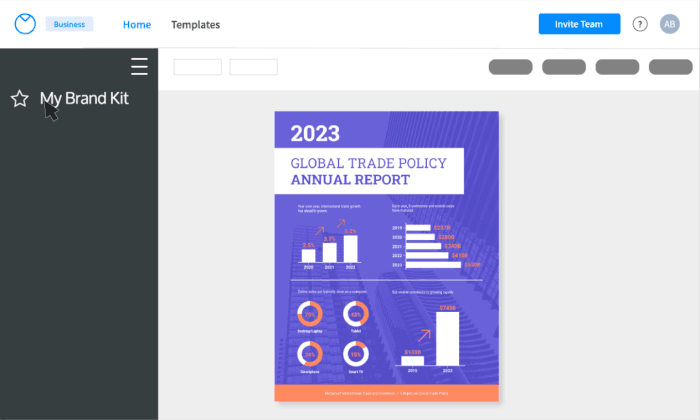
Venngage also has a business feature called My Brand Kit that lets you add your company’s logo, color palette, and fonts to your design with a single click.
For example, you can make this Venn diagram template reflect your brand by uploading your logo, associated fonts, and colors:

Again, our Venn diagram templates are not only free to use and professionally designed but they are also tailored for various use cases and industries to fit your exact needs and requirements.
A Business account also includes a real-time collaboration feature, so you can invite members of your team to work simultaneously on a project.
Venngage allows you to share your Venn diagram online as well as download it as a PNG or PDF file so that it is ready to rock your next presentation or report.
When you add this all up, it’s not hard to see why Venngage’s Venn Diagram Maker is a much better tool than Google Docs.
FAQs about Venn diagrams
Can you draw diagrams on Google Docs?
Besides Google Drawings, Google Docs currently only has templated charts that you can edit with Google Sheets.
There are no diagrams or diagram templates on Google Docs. Creating a diagram on Google Docs will require you to start from scratch and draw a diagram bit by bit using basic shapes and lines, which requires a lot of time and effort.
How do you make overlapping circles in Google Docs?
There are two ways to make overlapping circles in Google Docs:
The first way is to use the Oval shape and create two circles then drag them toward each other until their lines intersect and a section is formed in the middle. Initially, the circles should not be filled so you will see if the sections are equal.
The second way is to create only a single circle and then copy and paste it onto the canvas. This ensures that you have two perfectly identical circles which you can then merge to create overlapping circles.
Creating a Venn diagram is better and easier with Venngage
Venngage’s Venn Diagram Maker is easy to use, more efficient, and full of useful features, making it the ideal tool to create an impressive Venn diagram.
Use Venngage to make your next Venn diagram.


