


Infographics are an incredibly powerful way to communicate to both internal and external stakeholders.
That said, you may not have the time or know-how to make an infographic from scratch.
There are several infographic makers on the market and Piktochart and Venngage are two of them that offer a simple online editor and easy-to-edit templates. But, which infographic maker is better for your particular needs?
In this guide, we’ll offer you a comparison of Venngage and Piktochart’s features, templates, and resources to help you figure out which platform is best for your needs, whether you’re a student who wants a free, lightweight solution or a professional who wants a collaborative, high-quality solution for teams.
Table of Contents
- Who is Piktochart built for?
- Who is Venngage built for?
- Getting started
- Picking a template
- Editing an infographic
- Cost and value
- Infographic templates: Piktochart vs. Venngage
- Adding your branding
- Support and resources
- Ease of use
Who is Piktochart built for?
Piktochart is a design tool intended for people with very basic graphic design needs who don’t need professional-level results.
There are only about 100 infographic templates and most templates seem geared for social media, not the workplace. There are plenty of simple list templates, but not more robust infographic templates for professionals such as roadmaps, timelines and plans.
Team functionality is also limited, with no real-time collaboration or robust Brand Kit offered, which means Piktochart’s use is limited for professionals.
Who is Venngage built for?
Venngage is a simple but powerful design solution. Its templates and easy-to-use online editor help people communicate complex and technical information in an engaging way.
Venngage is known for its infographic templates, but it also has a huge collection of presentation, flowchart, roadmap, timeline, report, poster and checklist templates (and much more).
For example:
- Project managers use Venngage to create project roadmap infographics
- Marketers use Venngage to create promotional materials for technical industries
- Business consultants use Venngage to create thought leadership infographics
Looking to create a data-driven visual? Venngage has a wide variety of templates, with a focus on the needs of professionals such as strategizing, planning, reporting and promoting.
Venngage also offers templates in a variety of design styles, with fully customizable icons, illustrations and stock photos. We’ll cover that in more detail later on.
Getting started: Piktochart vs. Venngage
Piktochart and Venngage both boast of being simple design platforms. Here’s a walkthrough of using both.
Getting started with Piktochart
When you sign up for a free account with Piktochart, you can choose to sign up using a Gmail or Facebook account, or set it up manually with your email address.

On the next screen, you will be asked what you do for work and the size of your organization. There are many, many role choices that could be trimmed down to make it easier to navigate.

Next, you will be prompted to choose which tips or strategies you would like to have emailed to you. You are not asked what type of visual you may want to create. You’re not shown different types of infographics to select the ones you like either.

Once you are signed up, you will be directed to the Dashboard. There is unfortunately no information or prompts on how to get started.
This is where you will choose your template. You can search through the available templates by category or use the search bar to search by keyword.
There is also no indicator of what’s free and what’s paid, nor different infographic categories, like step-by-step or informational. Also, many of the template preview images are blurry. The suggested search terms are nice to have, though.

If you click on Graphics libraries and then Shapes & Icons, you can access Piktochart’s icon and graphics collections. From here you can drag and drop the graphic of your choice onto your project.
You can customize the colors and fonts in your graphic with the Editor and also add charts, maps, and other visual elements.

Once you have finished your infographic you can download it as an image, share it, or publish it.

Getting started with Venngage
Venngage’s onboarding process is longer than Piktochart’s but you get a much more tailored experience with customized template suggestions for your needs.
When you create an account, Venngage asks you what you need Venngage for. This helps Venngage pick templates for you based on your goals.
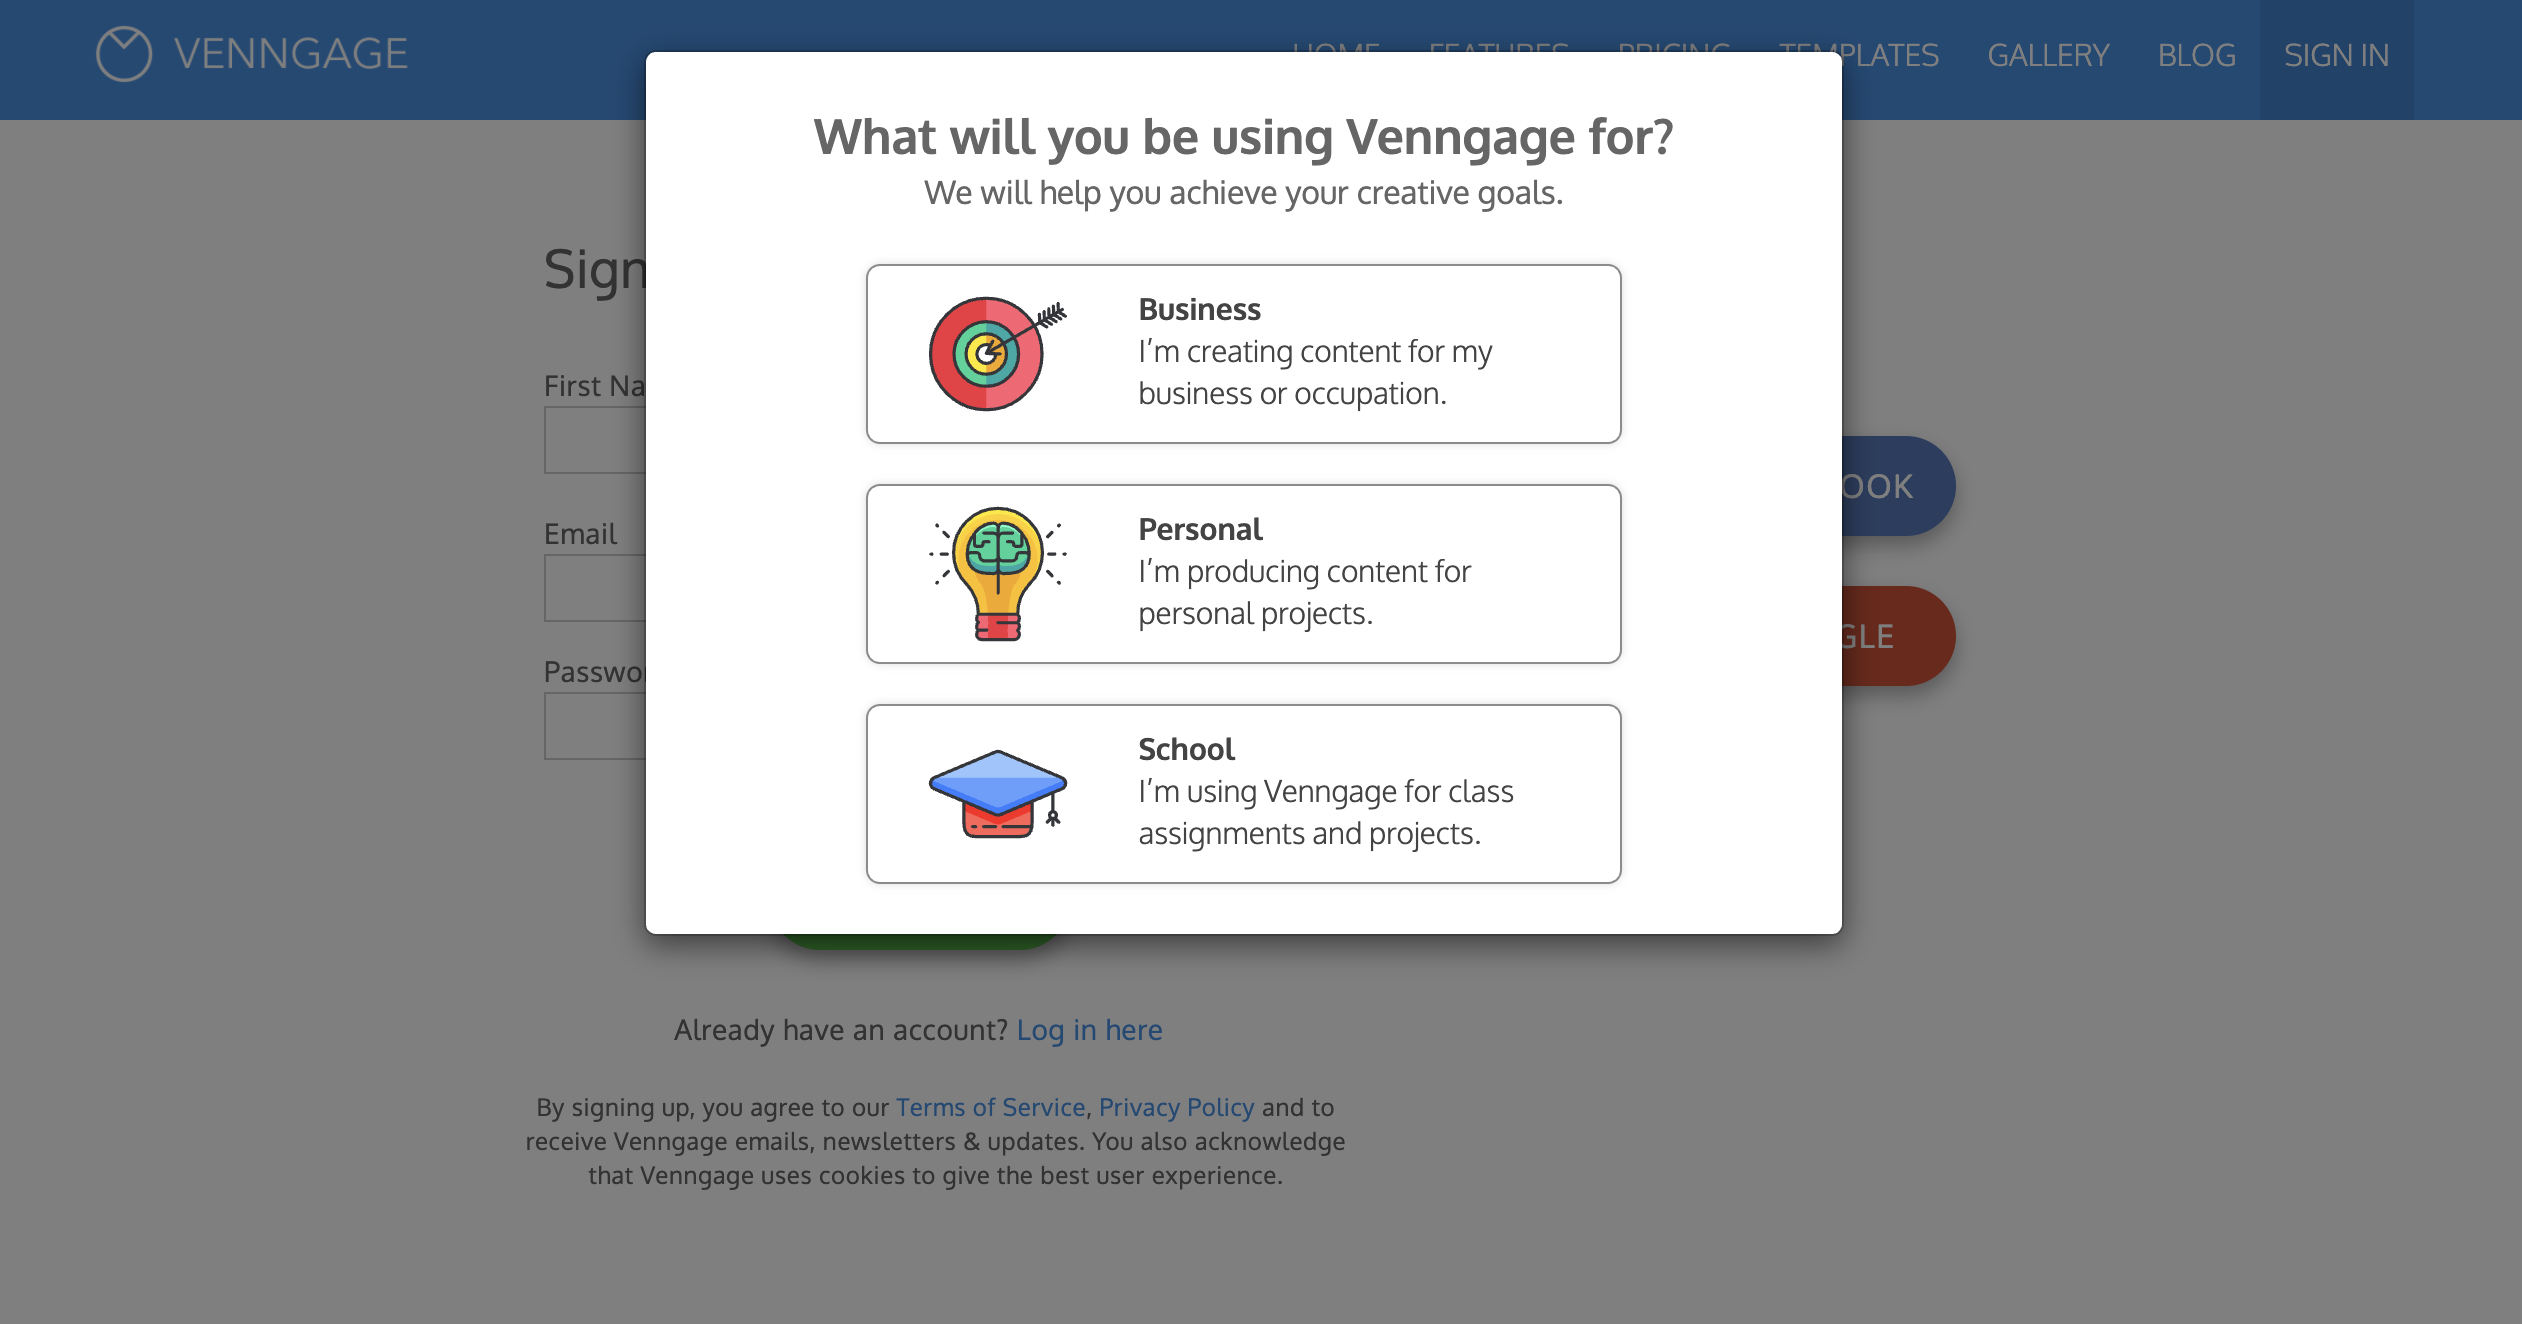
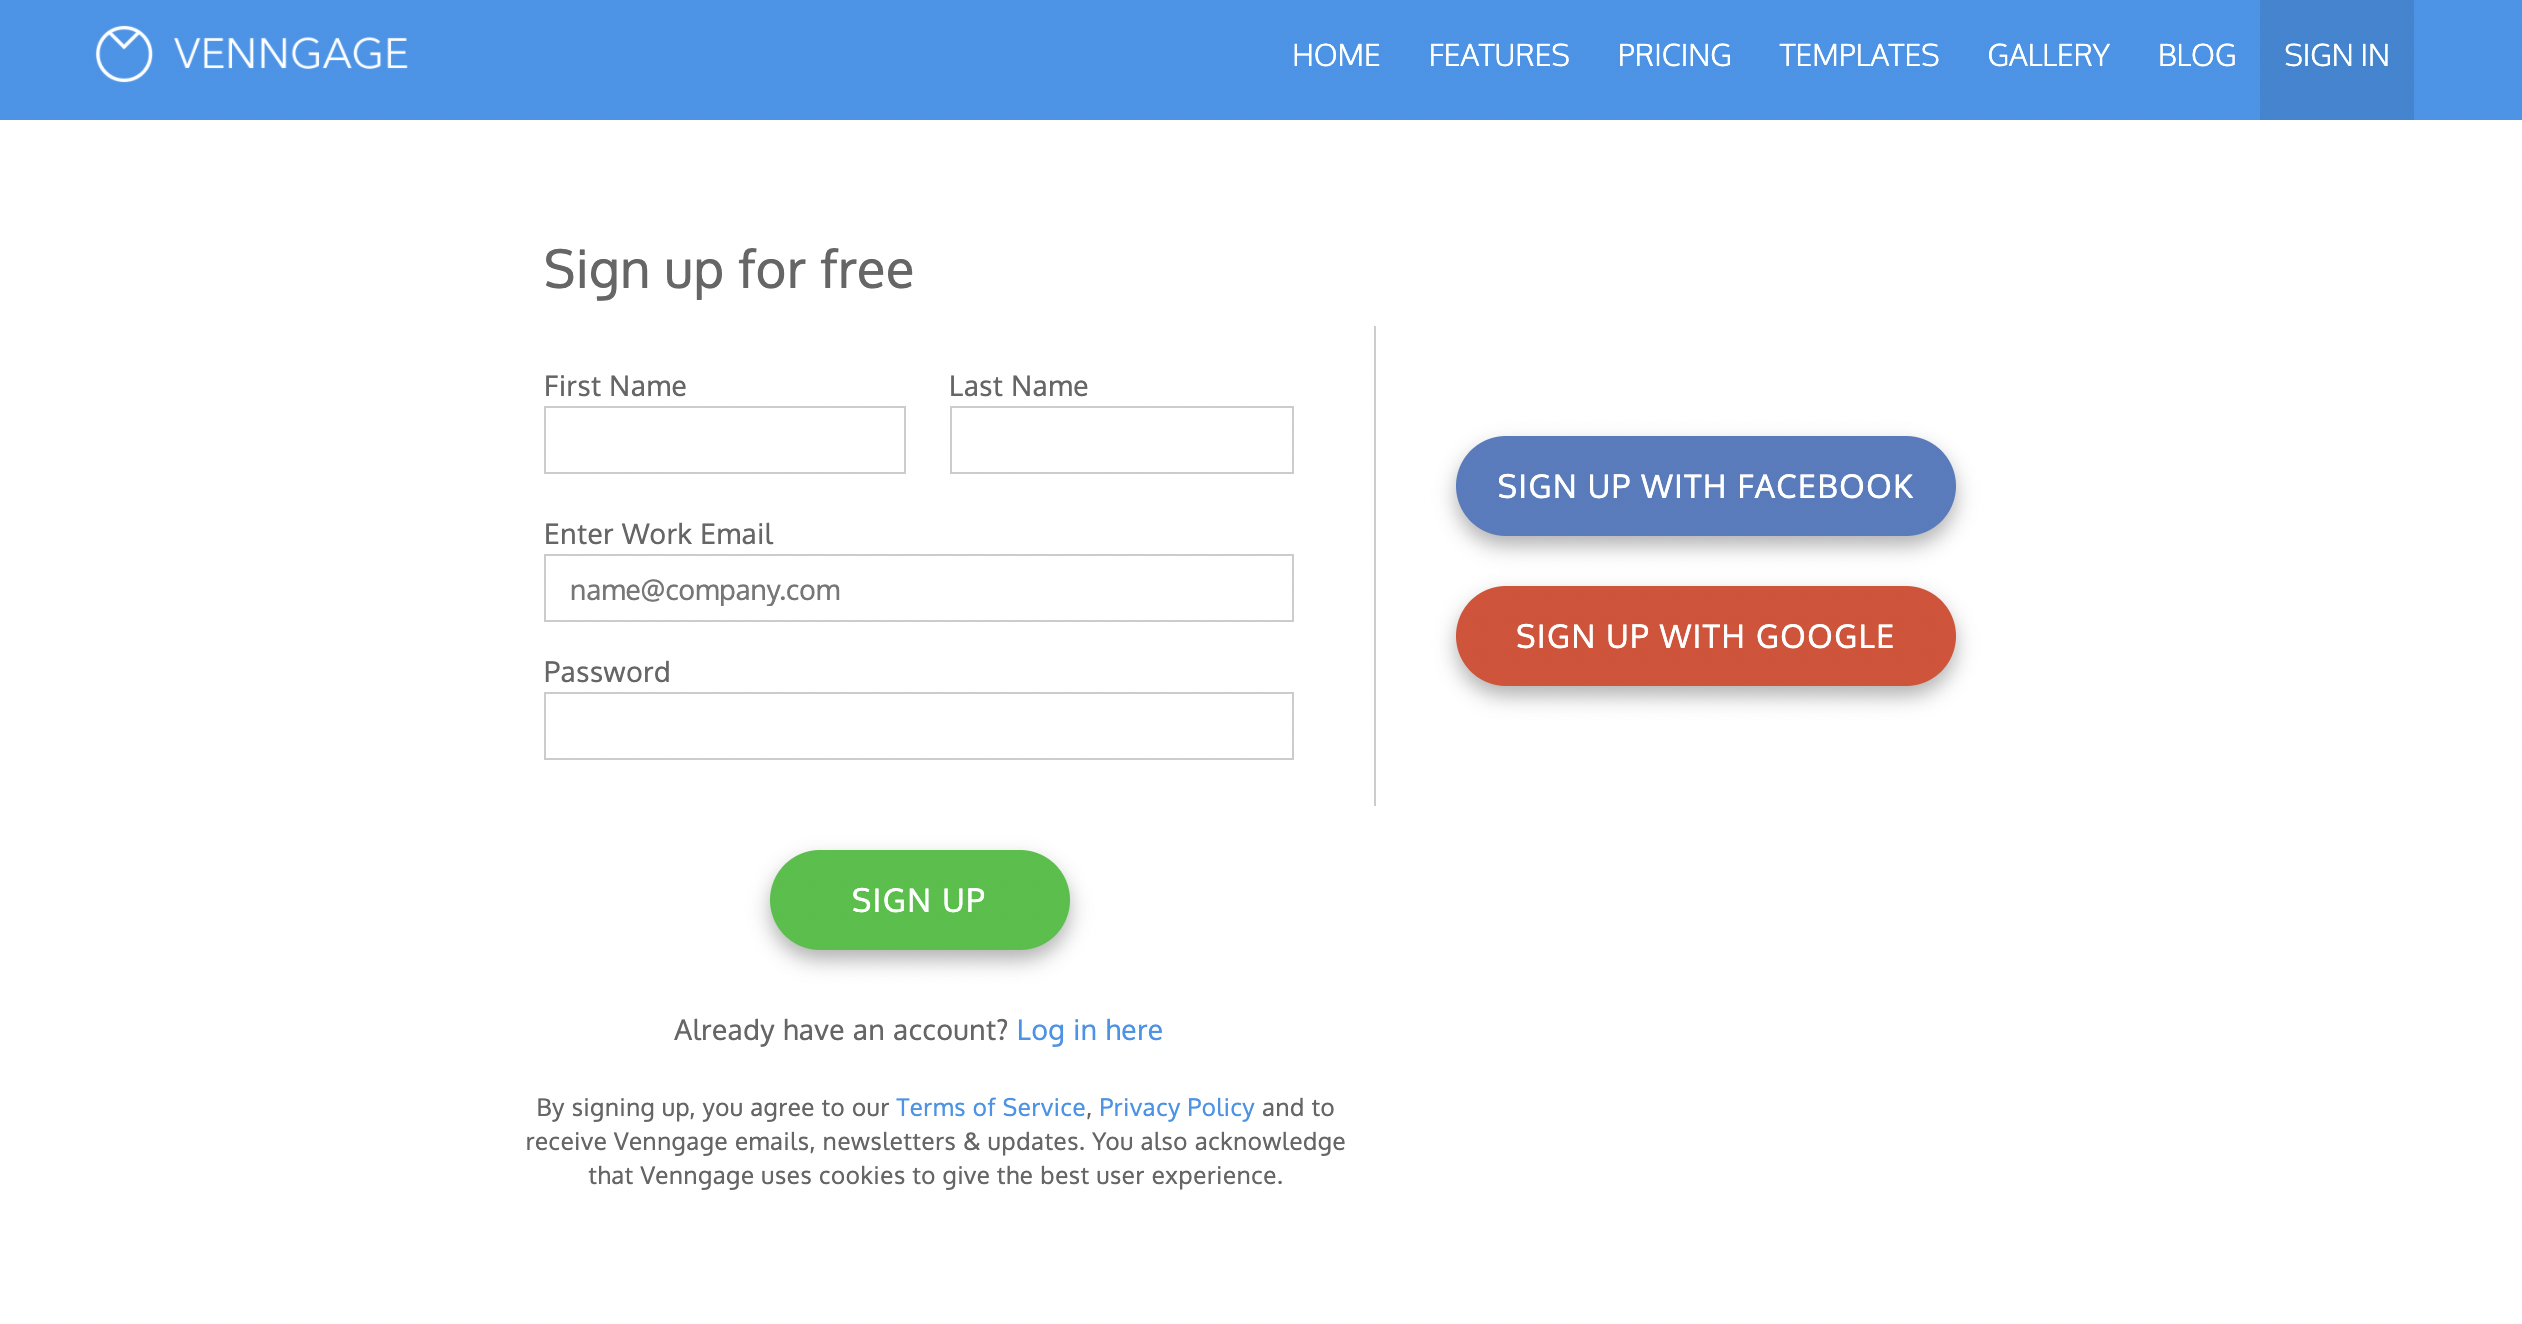
Sign up using your email, Gmail, or Facebook account.
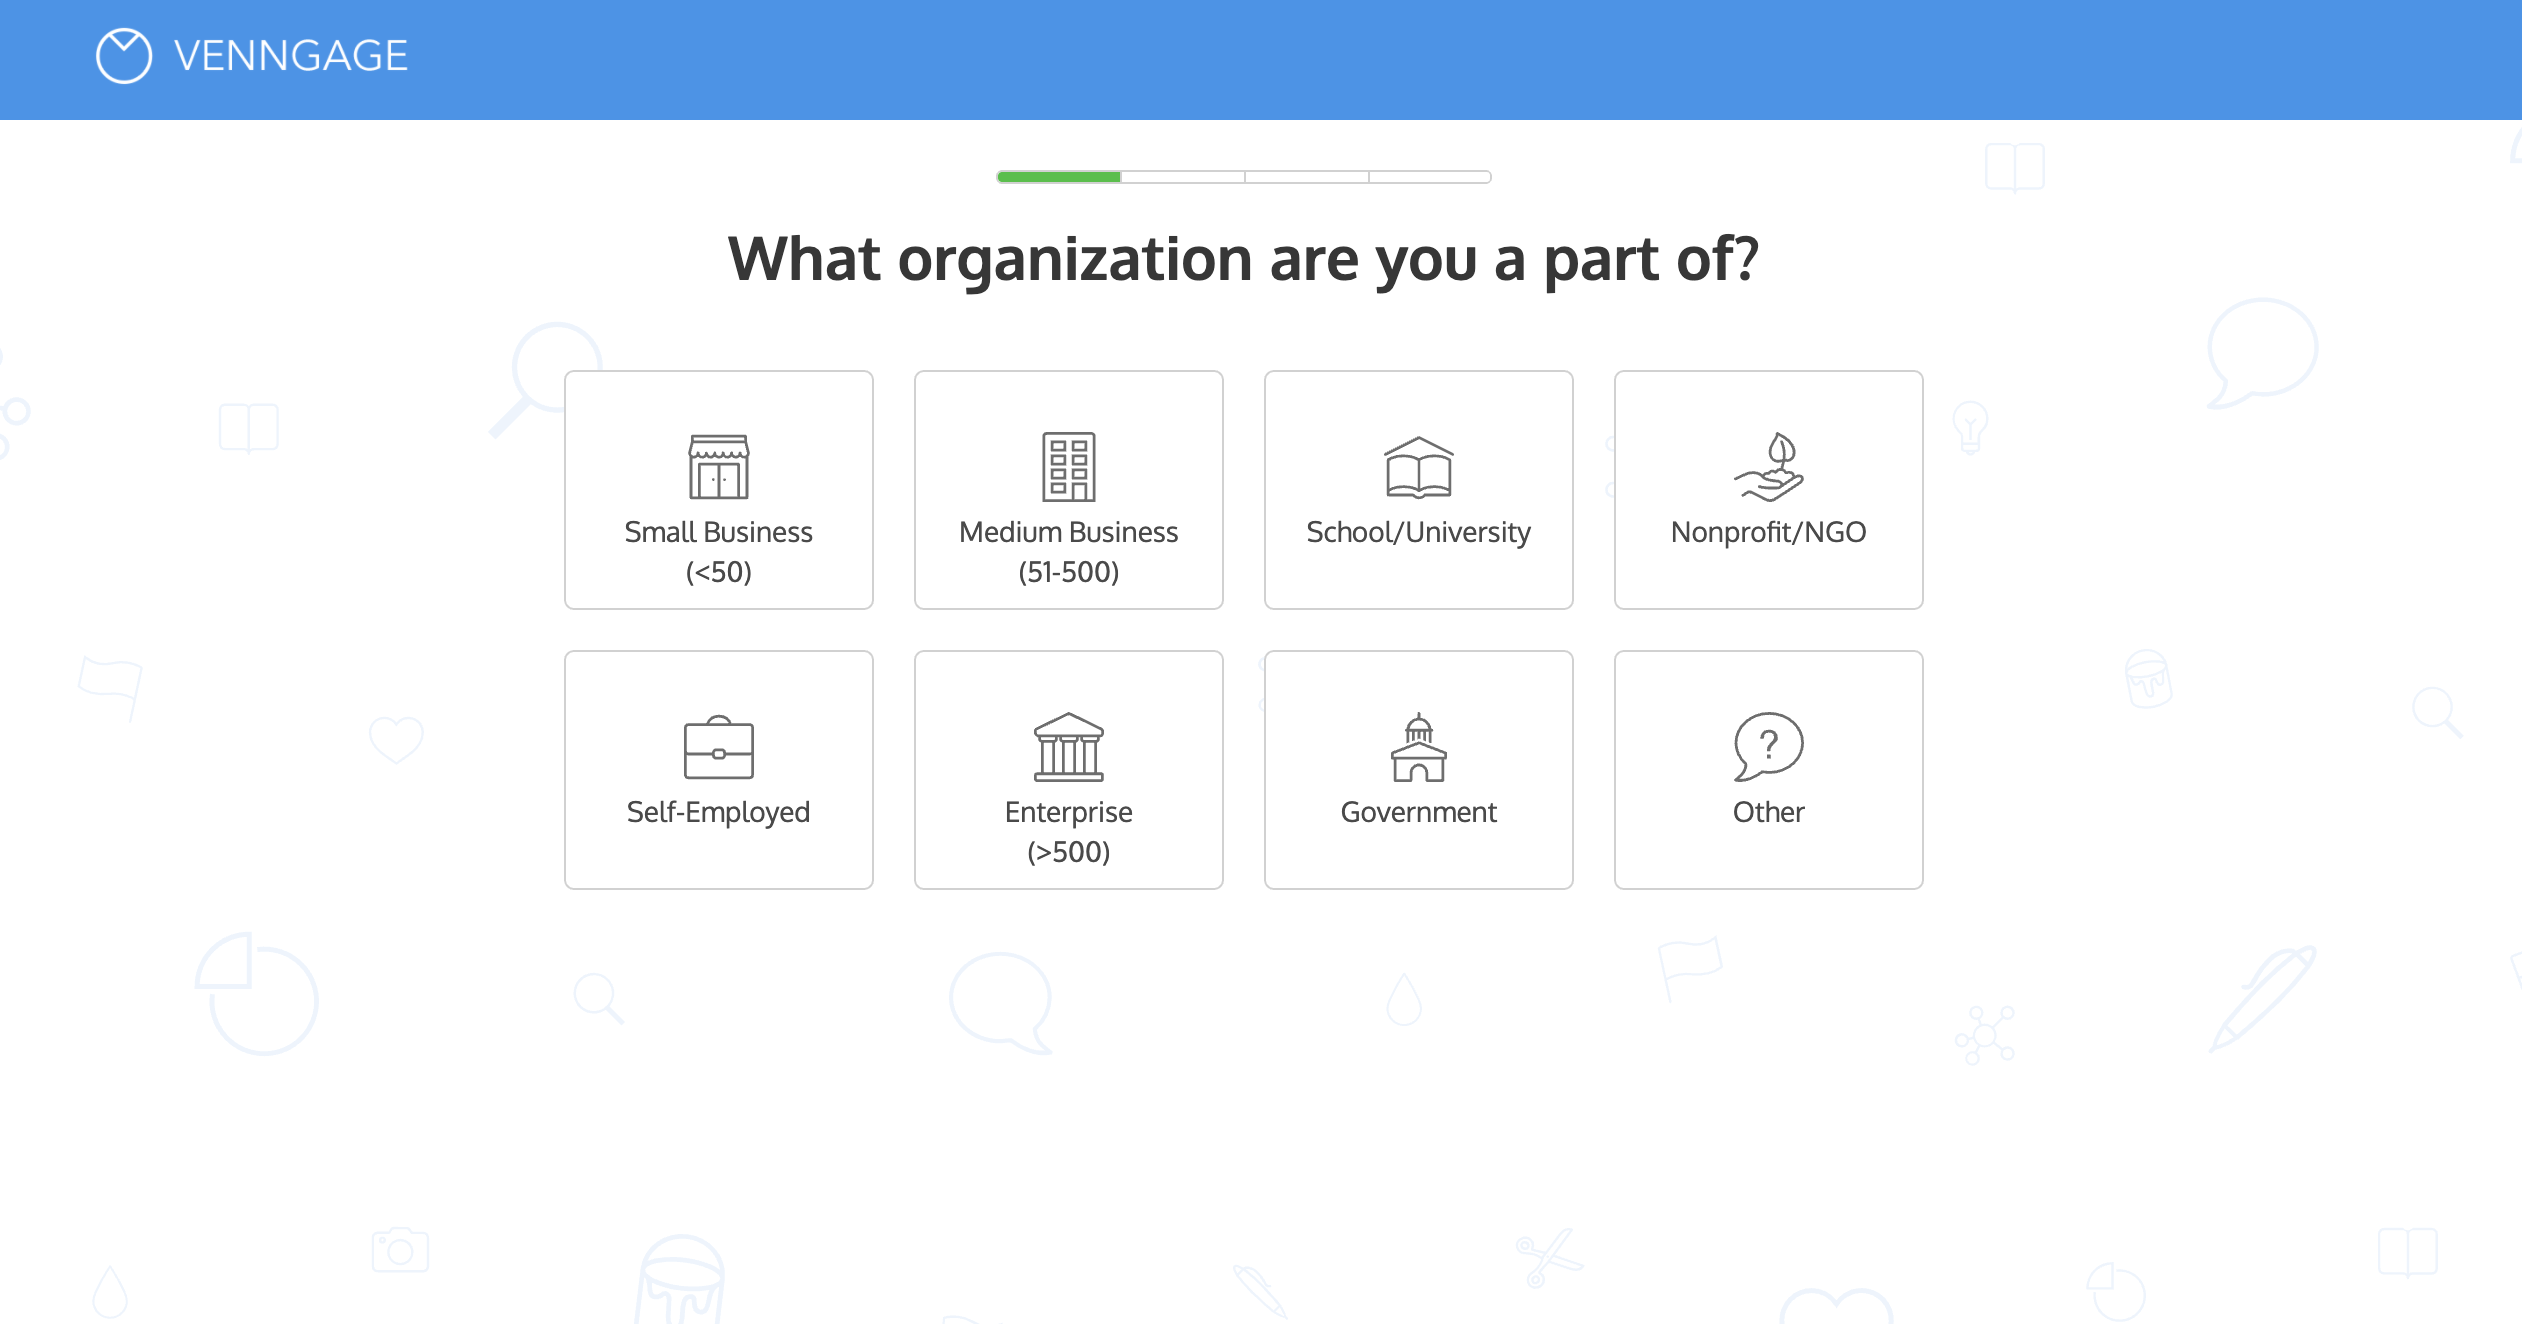
You’re then prompted to pick your organization, which helps Venngage curate templates related to your unique situation—whether you’re self-employed, work for a large company or NGO, work for or attend a school or university etc.
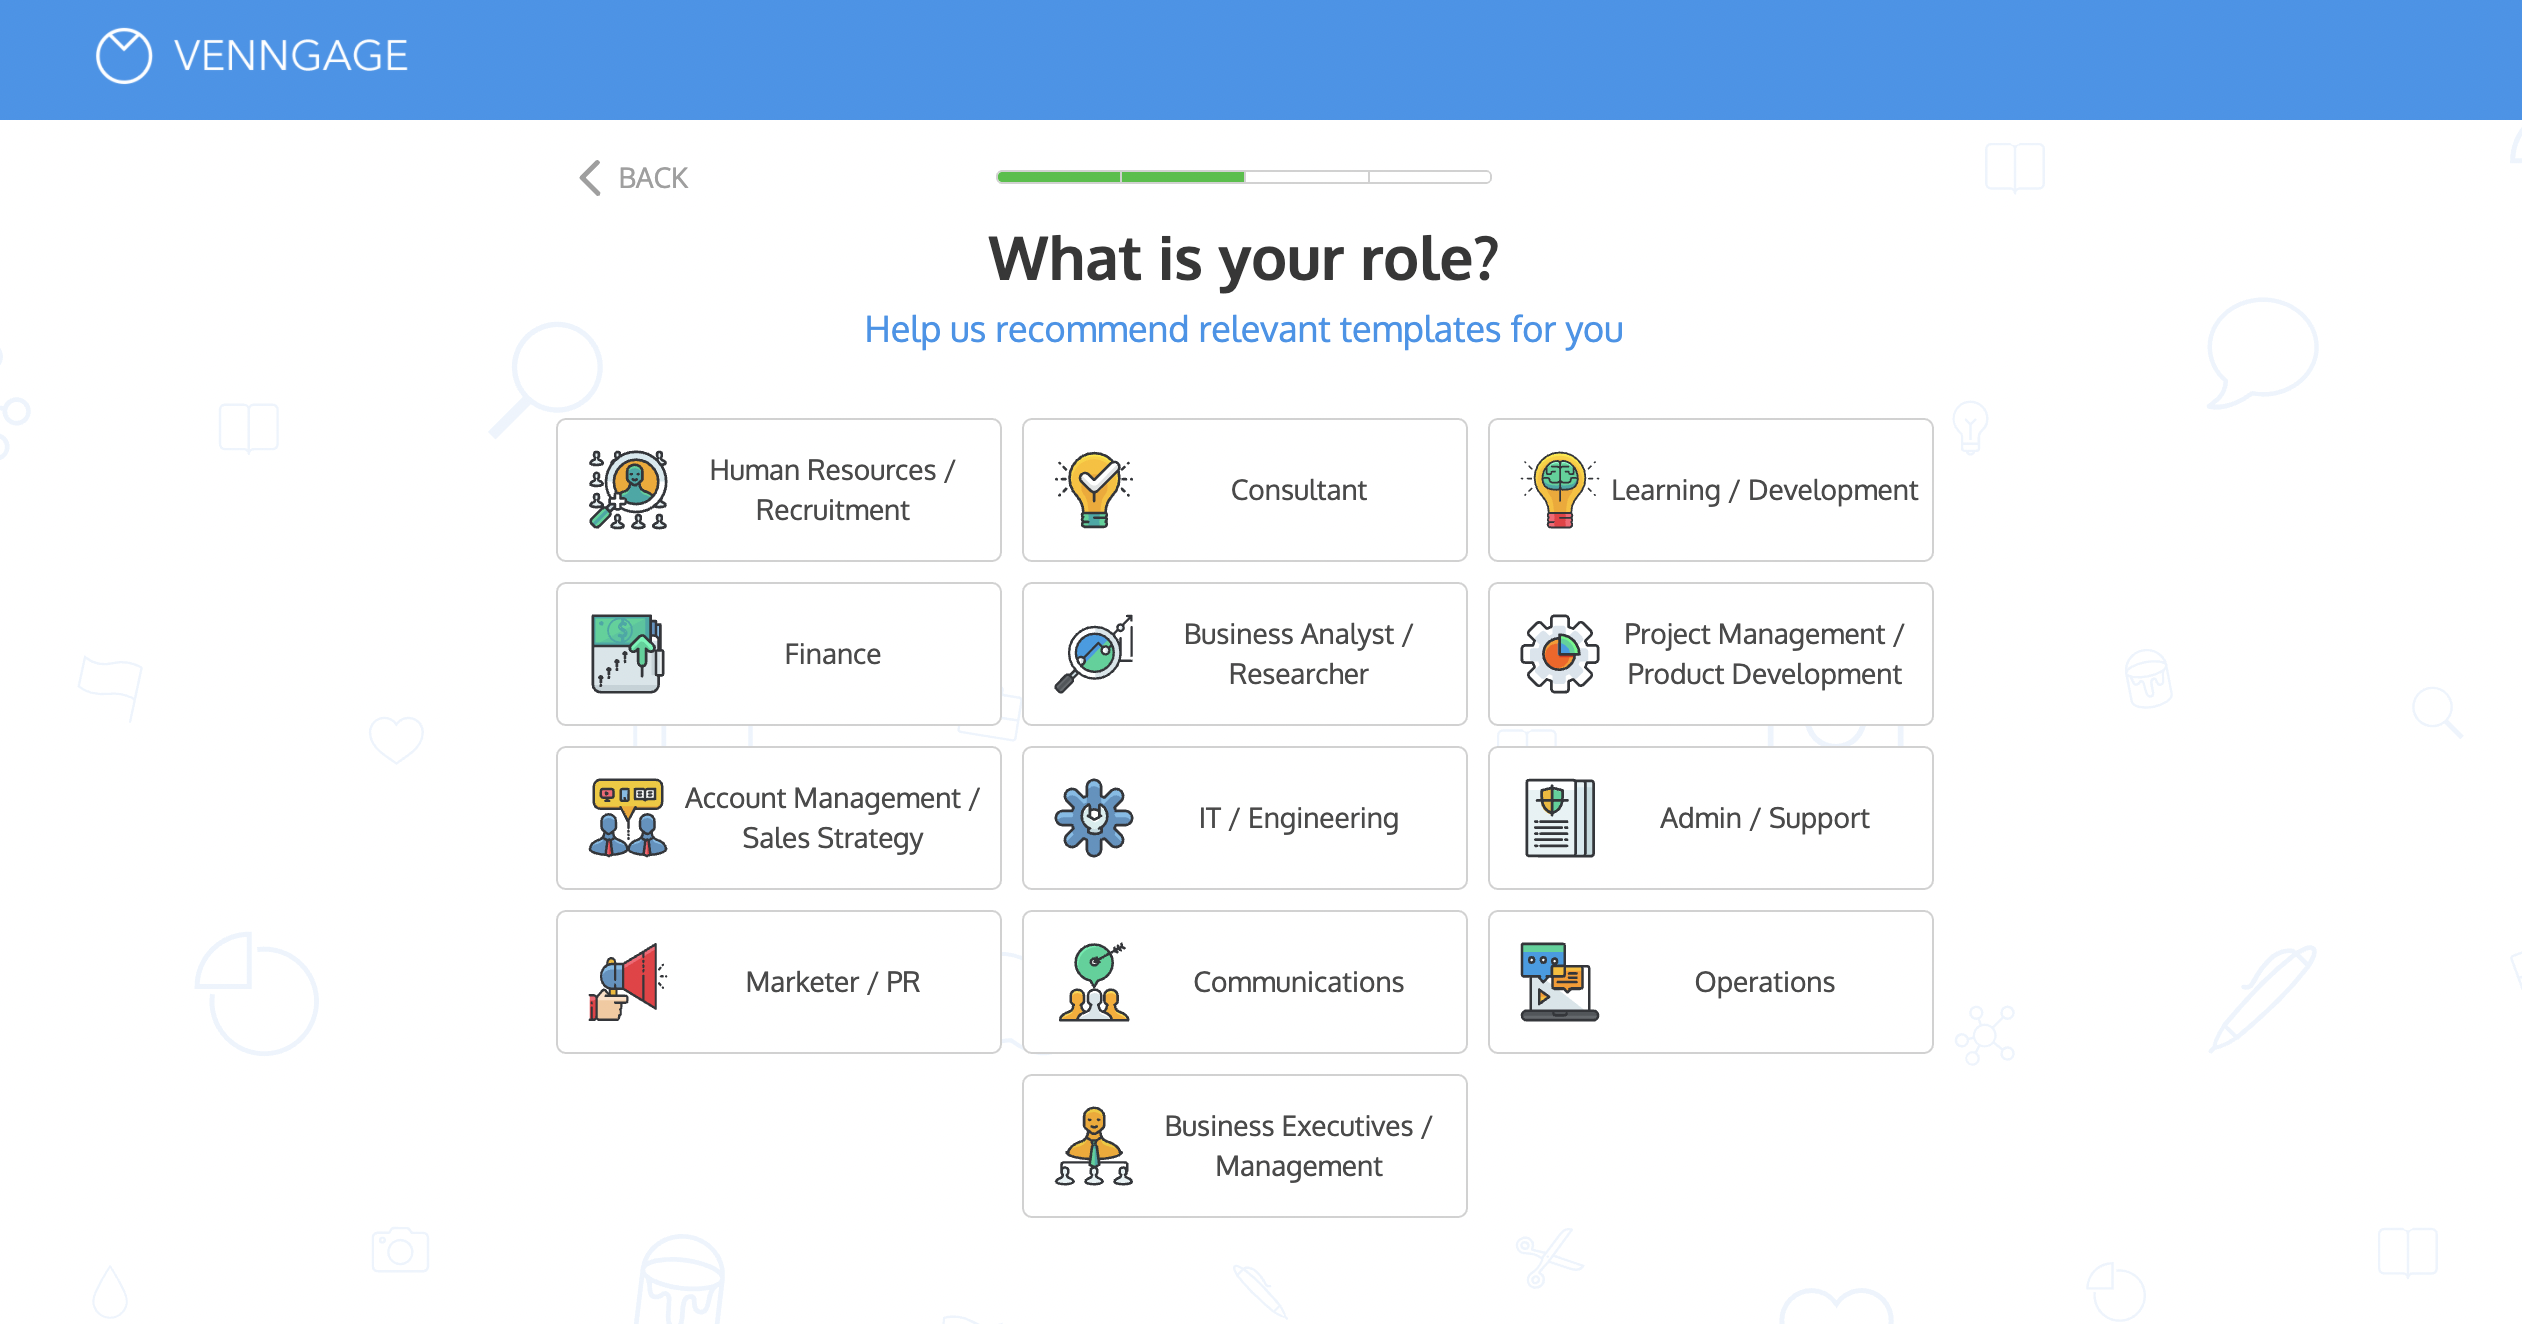
Venngage further customizes your experience by asking for your role, whether that’s in marketing, HR, management etc.
Then, pick three types of templates that you would like to create. This helps Venngage learn if you like simple infographics, reports with graphs/charts, engaging social media graphics, event posters etc.
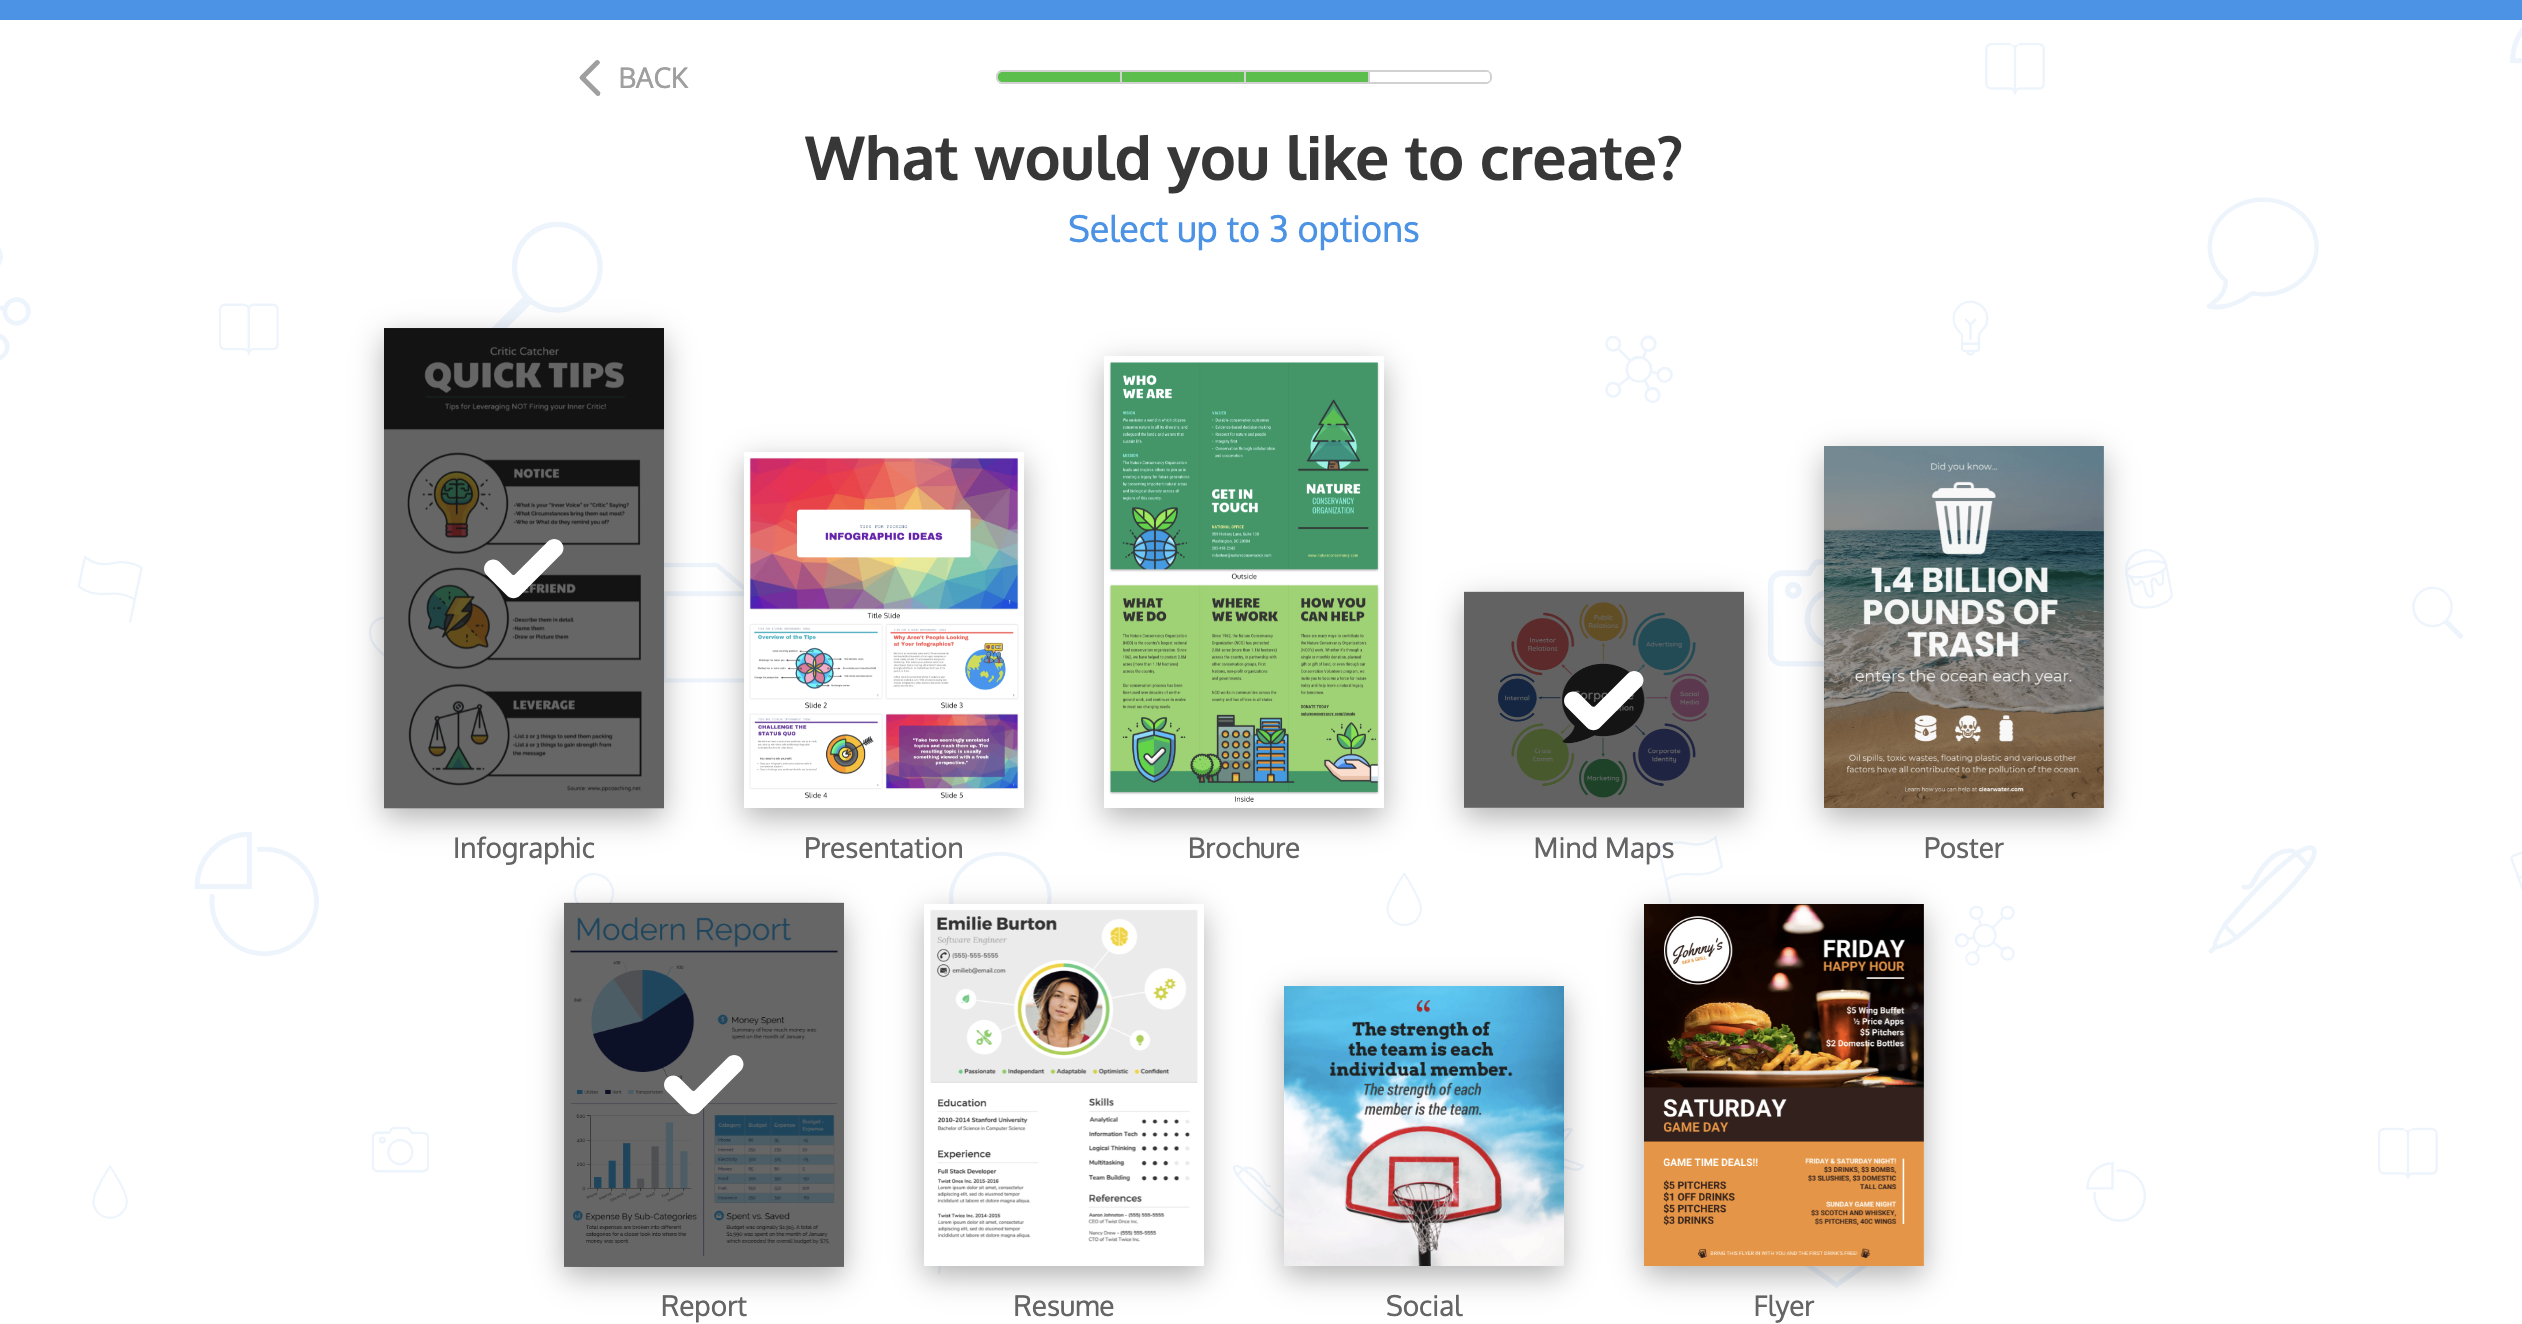
After that, you are prompted to pick three design styles that you like: modern, simple, creative, conservative etc. Just pick the three that fit your creative goals.
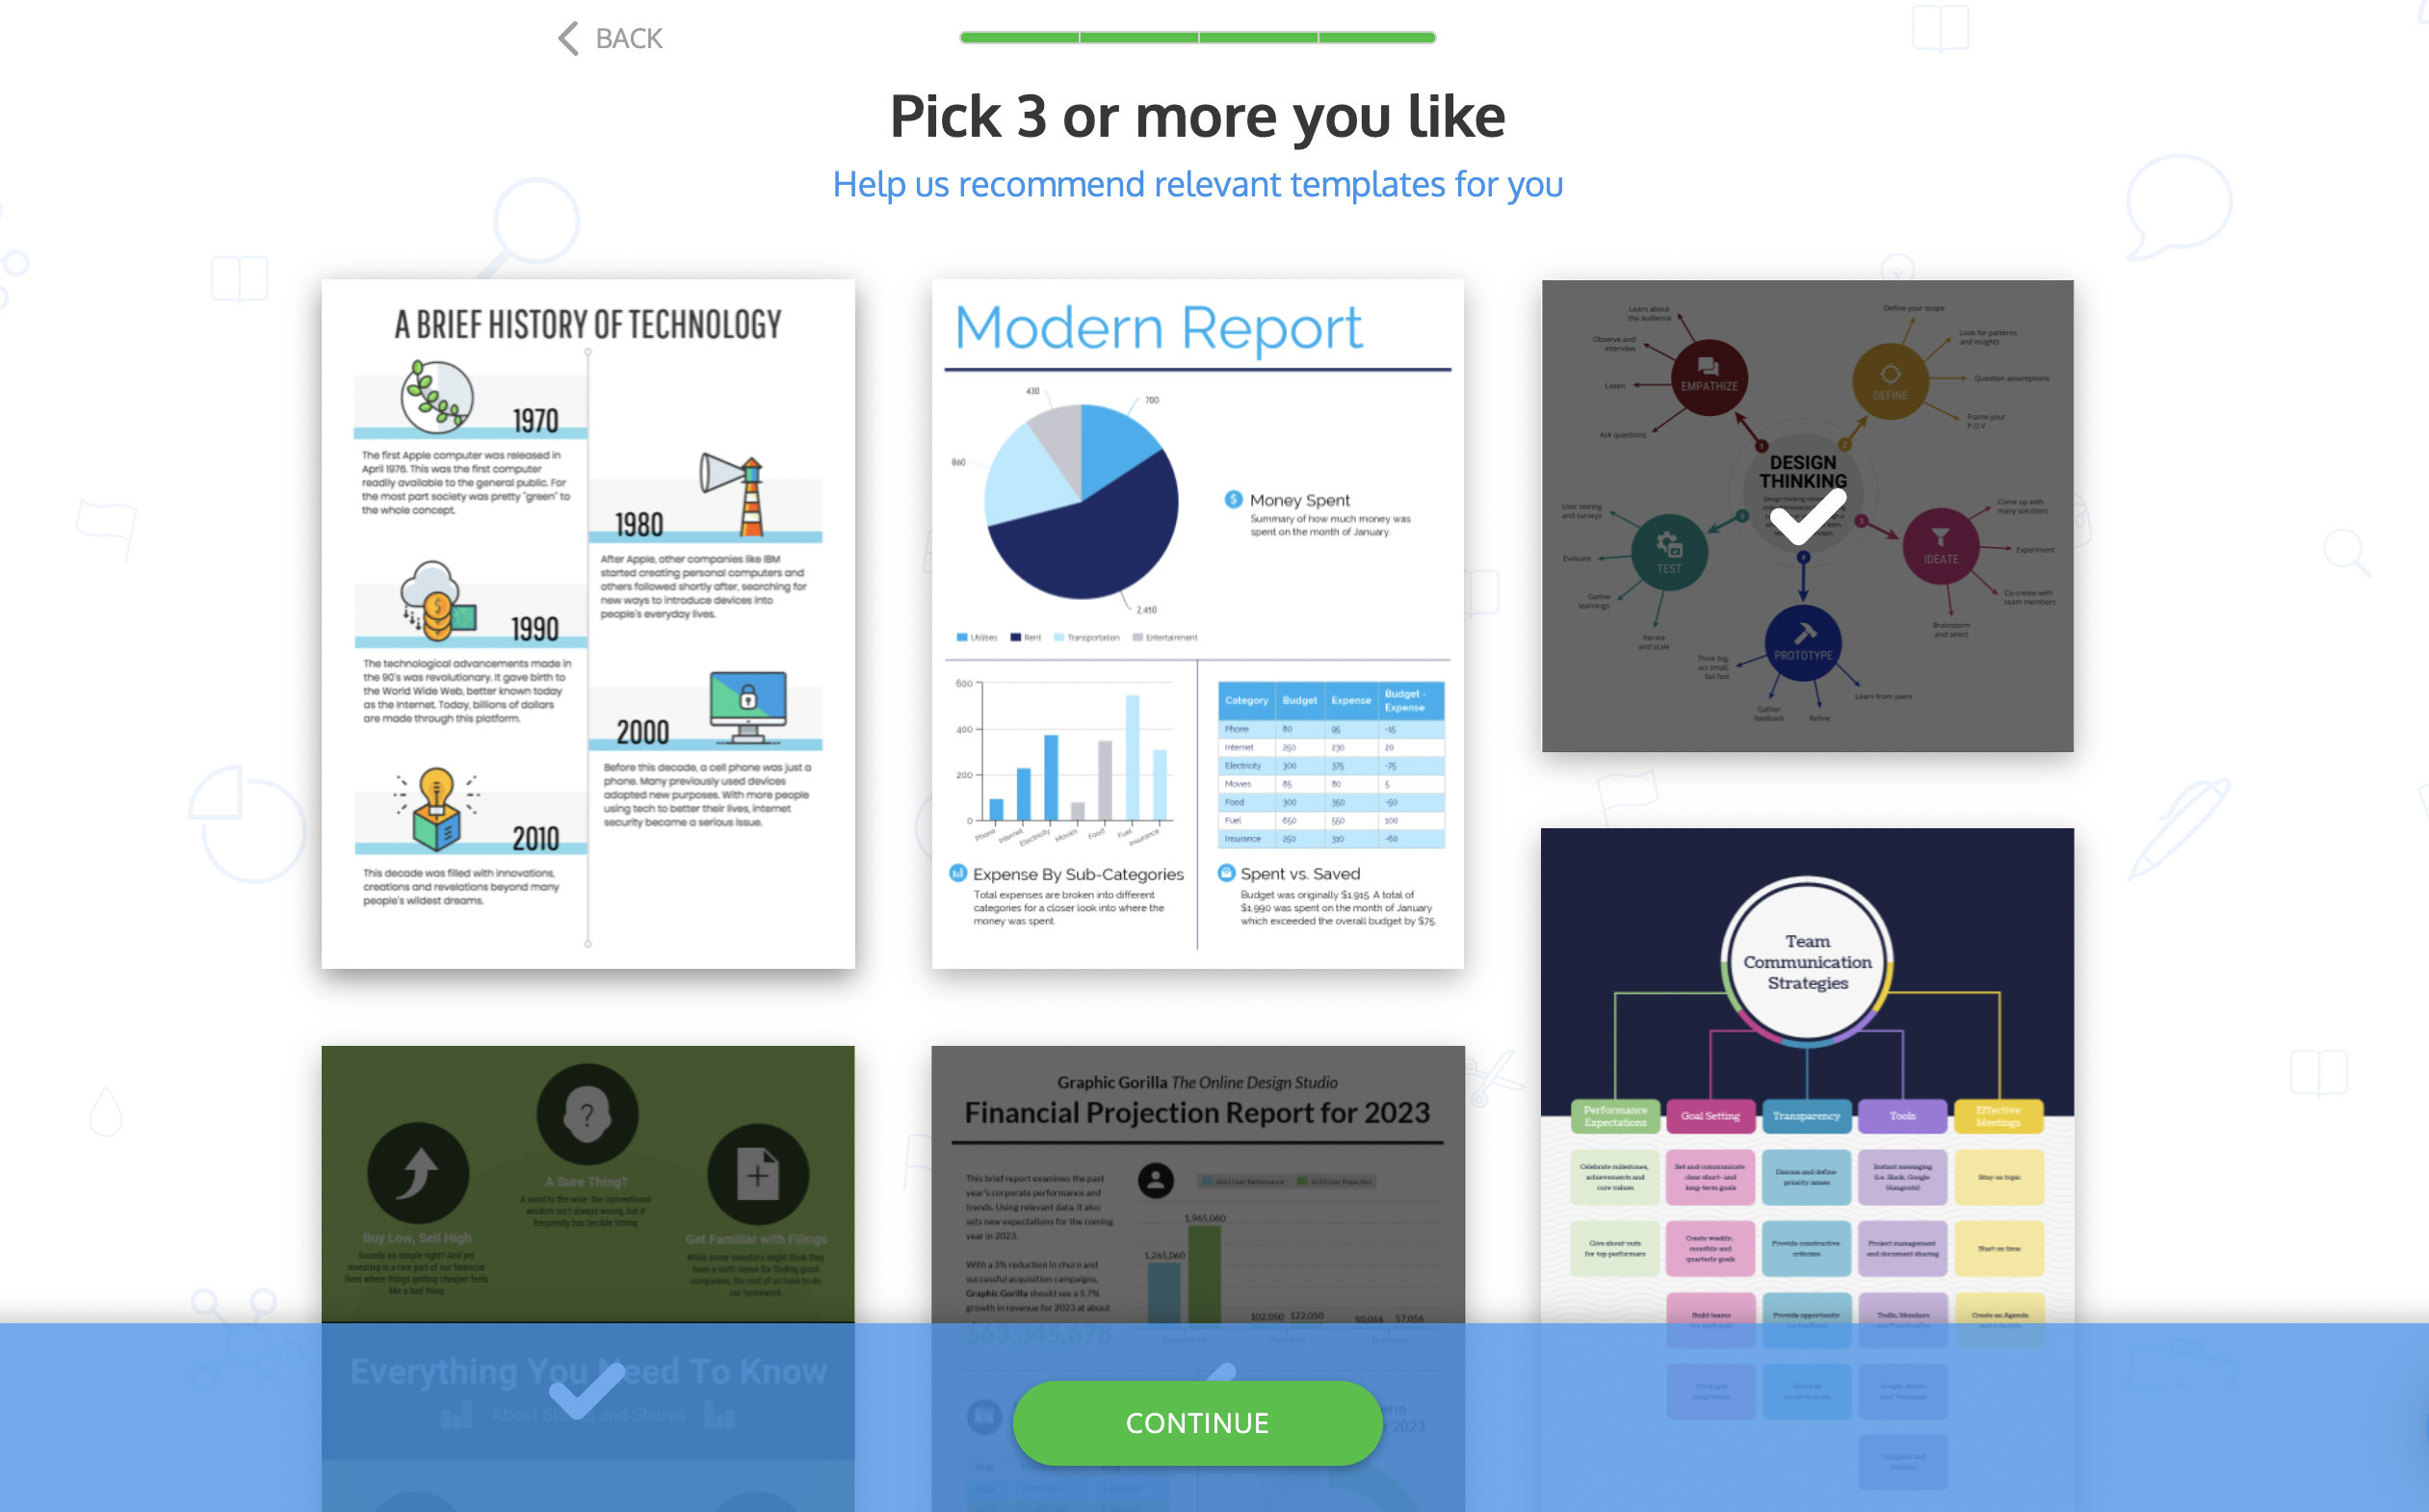
From there, Venngage takes you to their templates library where there is a selection of curated templates based on your answers. You can either explore the templates by yourself or follow the pop-up prompts for an easy walkthrough of the editor.

If you select the prompt and click “Create”, you enter the editor where you get a walkthrough of its features and layout.

Then, either get to work customizing the template or visit the Help page, which delivers video tutorials that will help you become more confident in the editor.

Picking an infographic template: Piktochart vs Venngage
Picking an infographic template with Piktochart
Piktochart offers about 500 template options to get you started, but only about 100 of them are infographics.
From the template page, you can enter keywords to search for an infographic to begin editing. If you don’t want to do a keyword search, you can also explore their templates via the menu in the left-sidebar, which categorizes the templates by type.
That said, infographics themselves are not broken down by type such as process, statistical, list etc.

Piktochart’s infographic templates are quite flat, meaning they don’t use elements such as icons or illustrations with much depth. In fact, there is a lack of variety of icons and illustrations in general. The data visualizations within the templates are also pretty basic and stick to simple bar, line or pie charts.
Another thing: many of the layouts are similar, though they do follow design best practices.
In a nutshell, Piktochart’s infographic templates are perfectly serviceable, but they are a bit boring and definitely not very eye-catching. They are not meant for the average professional, who needs beautiful, crisp designs with business use cases in mind.
You’ll also notice that the copy in the infographics is generally just nonsensical filler text, so you can’t use the copy as a guideline.
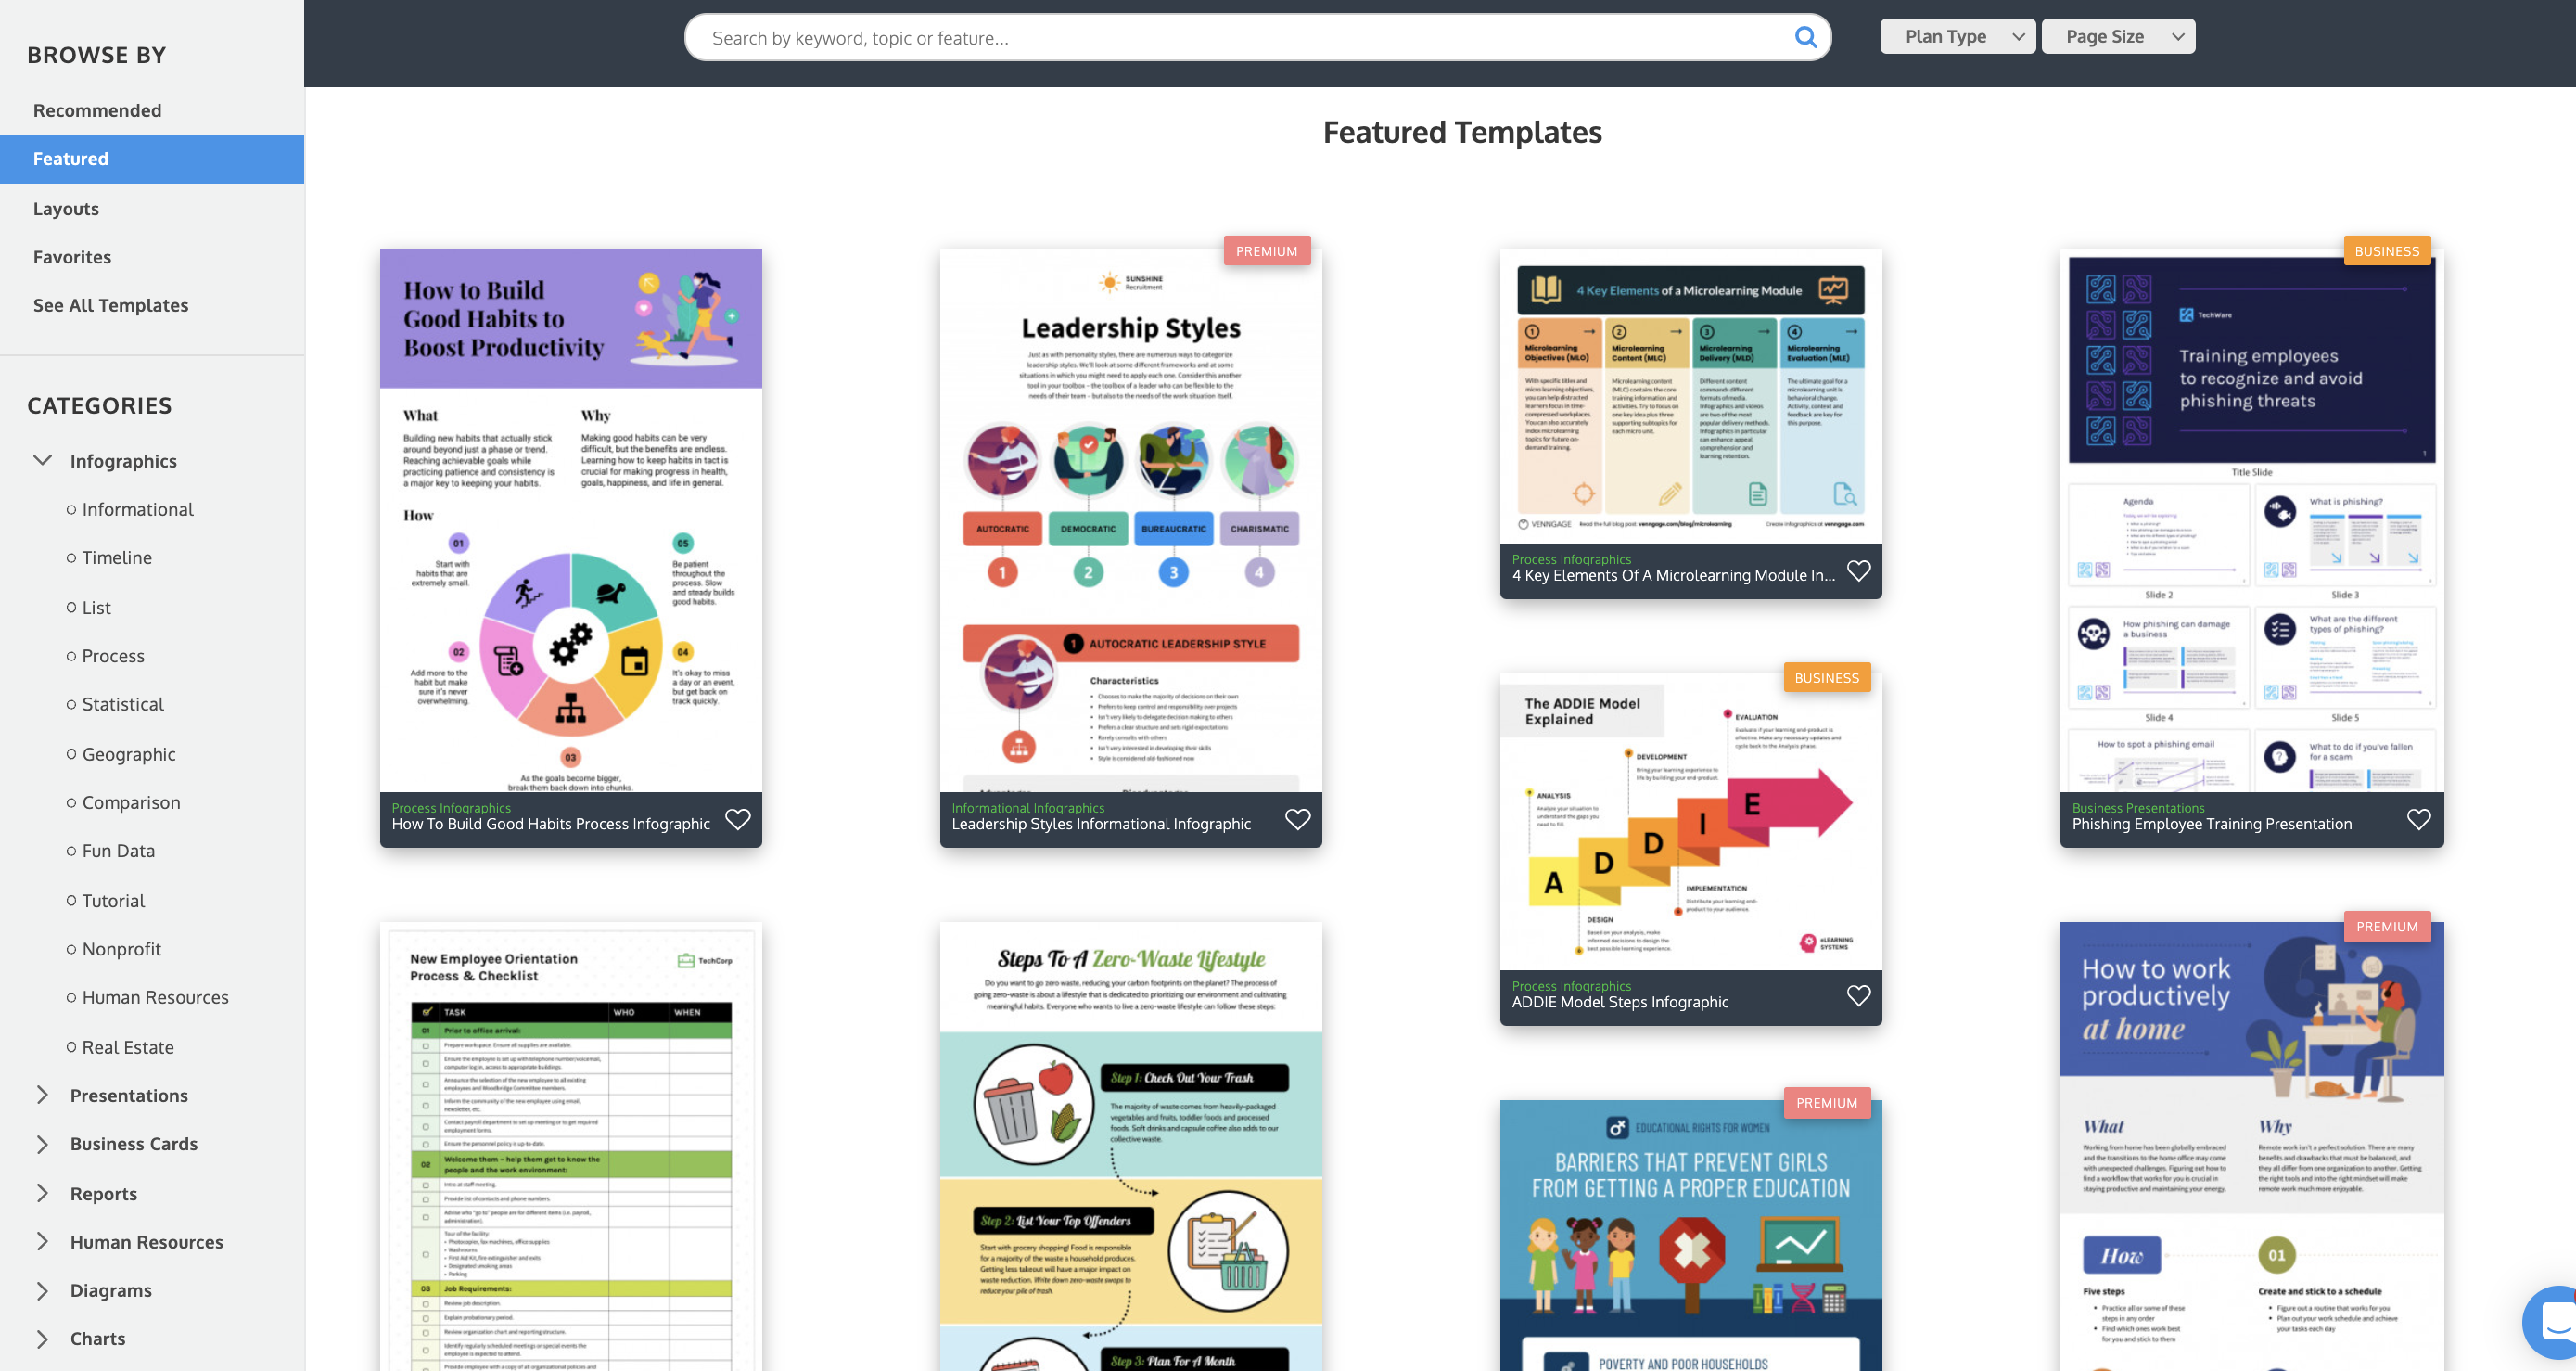
Picking an infographic template with Venngage
Venngage has over 6,100 templates and 2,600+ of them are infographics. Another plus: 1,400 of Venngage’s templates are completely free to use and don’t require a paid plan.
You can choose one of the templates specifically recommended for you or pick a type of template from the left-hand menu.
From there, you can find the specific type of infographic you want to create, whether that’s a simple list infographic for a blog post, a more detailed statistical infographic to use as a report, a timeline infographic to add to your presentation etc.
Use the top navigation bar to search by keywords, plan type (Free, Premium, Business), or page dimensions like landscape, square, letter or portrait.
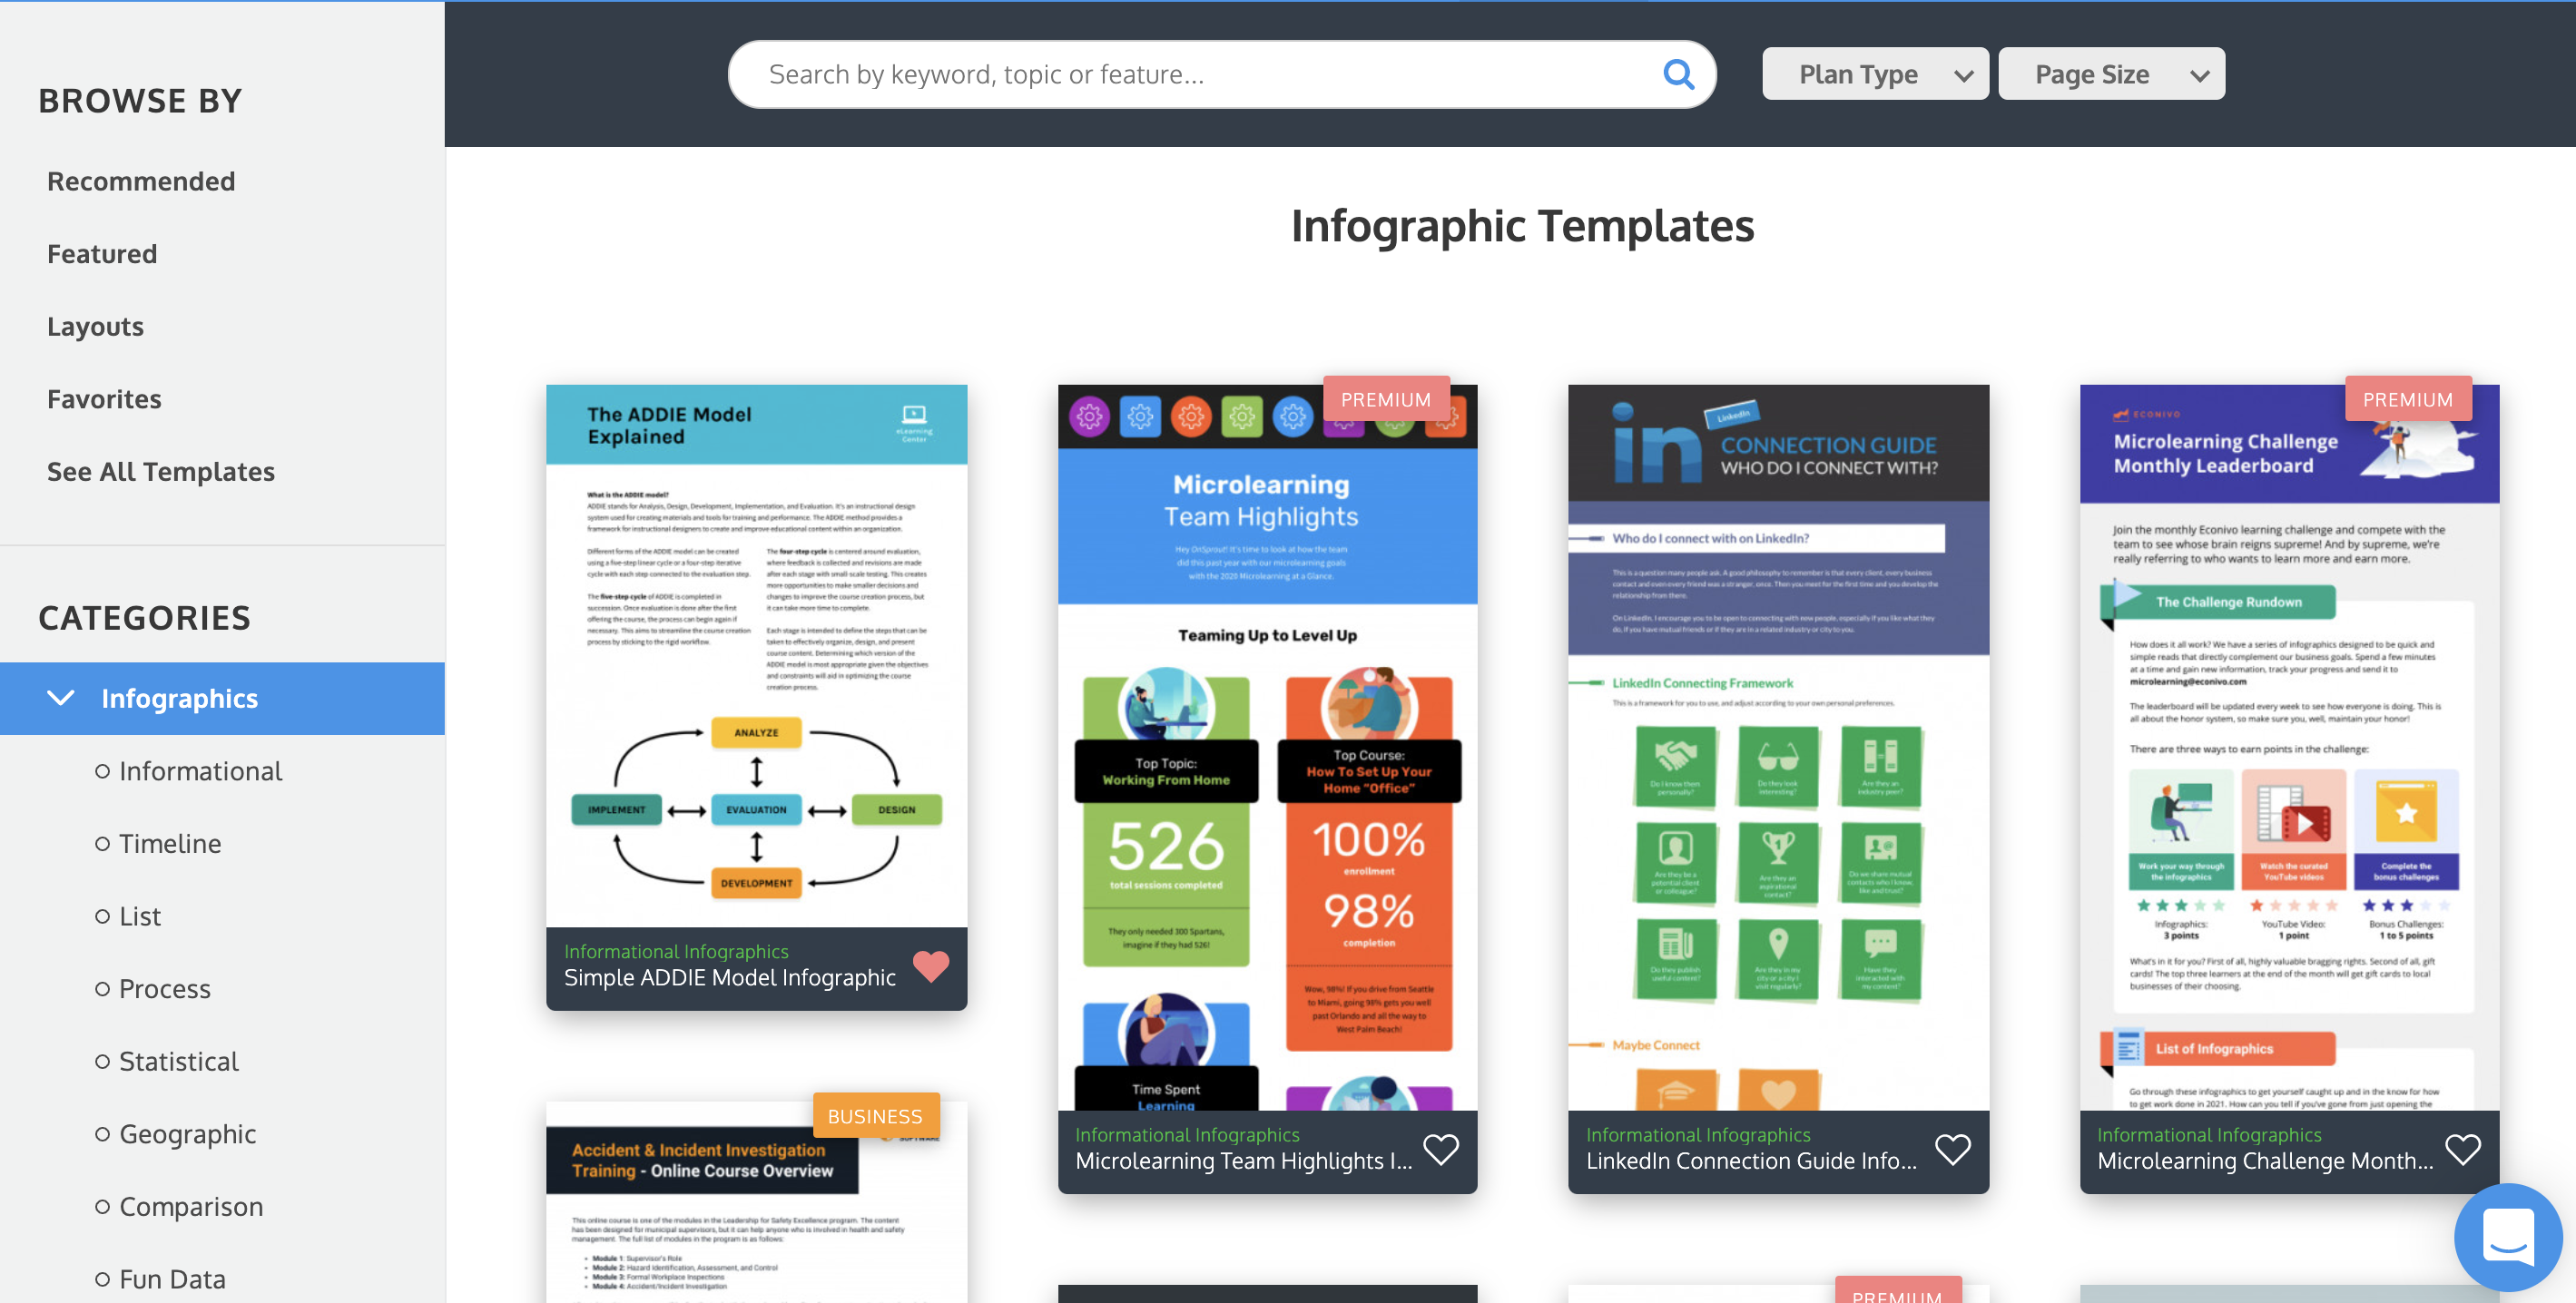
Click on the hearts to Favorite templates you like. Access them later in your Favorites folder in the left-hand menu.
Any templates that can only be used with a paid plan are marked as “Premium” or “Business.” That way, you know immediately if you can use them based on your plan level.
There are many template styles—from simple and functional, to professional, to engaging and creative. It’s easy to find a template that will fit your company’s brand or your personal style.
Venngage’s team of in-house designers is constantly producing new templates every week–you can even filter templates by New vs. Old so you can see our freshest templates.
Don’t see exactly what you need? Use a blank canvas and start from scratch.
Editing an infographic: Piktochart vs Venngage
Editing an infographic in Piktochart
Piktochart has a drag-and-drop interface that lets you rearrange their infographic template’s existing elements or add additional elements such as graphics or charts.
Using the left-hand navigation panel, you can add frames, change your color scheme and insert other design components. You can add images to the background for extra texture, which is a nice touch, though many look blurry once you apply them.
Another nice feature is when you scroll over font options, it changes the existing text in your infographic, letting you preview the results.

The only fonts available, unfortunately, are free Google fonts that are available widely. If you upgrade to a paid plan on Piktochart, you can add custom fonts.
Adding and editing charts
Again, on the left-hand navigation panel, you will find a tab for adding charts under tools. Once you have selected the type of chart you would like to use, you can import your data or enter it manually. You will be able to select the chart style that works for your data and customize it with the colors of your choice.

The charts/graphs tool is an easy-to-use pop-up that lets you easily edit information. Finding the color, formatting and settings can be a bit tough as it’s hidden behind a gear icon.
There are many graph options: bar, line, scatter, pie, donut, etc. That said, there are not a lot of design options for colors, fonts, labels, etc. and no other diagrams like word clouds.
The map editor is very similar, easy to use and allows for a lot of custom edits and formatting. You can’t add labels for geographic areas, though, and there are only world, continent and national maps, no state or county maps.
Adding and editing icons
You can add icons by opening the graphic tab on the left-hand navigation panel. From there, you can drag and drop your chosen icon or shape right into your project.
Piktochart’s icons are very simple and wouldn’t work well in a professional environment. Piktochart only has flat icons and about 75 illustrations. There is a clear lack of people illustrations, too.
The icons are hidden in a drop-down box which makes scrolling through them challenging. That said, being able to sort between color and mono is a nice feature. Plus, when you hover on an icon it is blown up so you get a better view of what it looks like.
There’s no icon or image replace tool that I could see, so you’re stuck deleting old icons and repositioning new ones. If you choose a bunch of icons, Piktochart piles them all on top of each other on your canvas.

As for shapes, Piktochart often uses shapes to build scenes instead of single icons, like buildings being made up of 10 shapes instead of one building icon. Obviously, this is confusing to edit or delete.
Shapes are not found with icons in the Piktochart editor and you only get horizontal lines, no vertical ones, which is odd.
Adding and editing photos
With Piktochart, you can upload up to 40 MB of images with a free account, and 1 GB with a paid account. Once you have uploaded your images, it is easy to drag them into your graphic.
The stock photo library comes from Unsplash and some of the previews are too small or optimized to see what you are adding to the template. There’s a preview pop-up when you hover on the image, but the images are commonly pretty blurry.

You can also mask an image by inserting it into any shape using the shapes and icons graphics tools.

Another drawback: the only way to crop images is to use a photo frame. There’s no image replace feature either—you need to manually delete, add a new image and resize it.
Finally, at times Piktochart’s photo library takes you to the Unsplash page instead of adding the photo. So, some images are impossible to add to templates because of this bug.
Aligning elements on the page
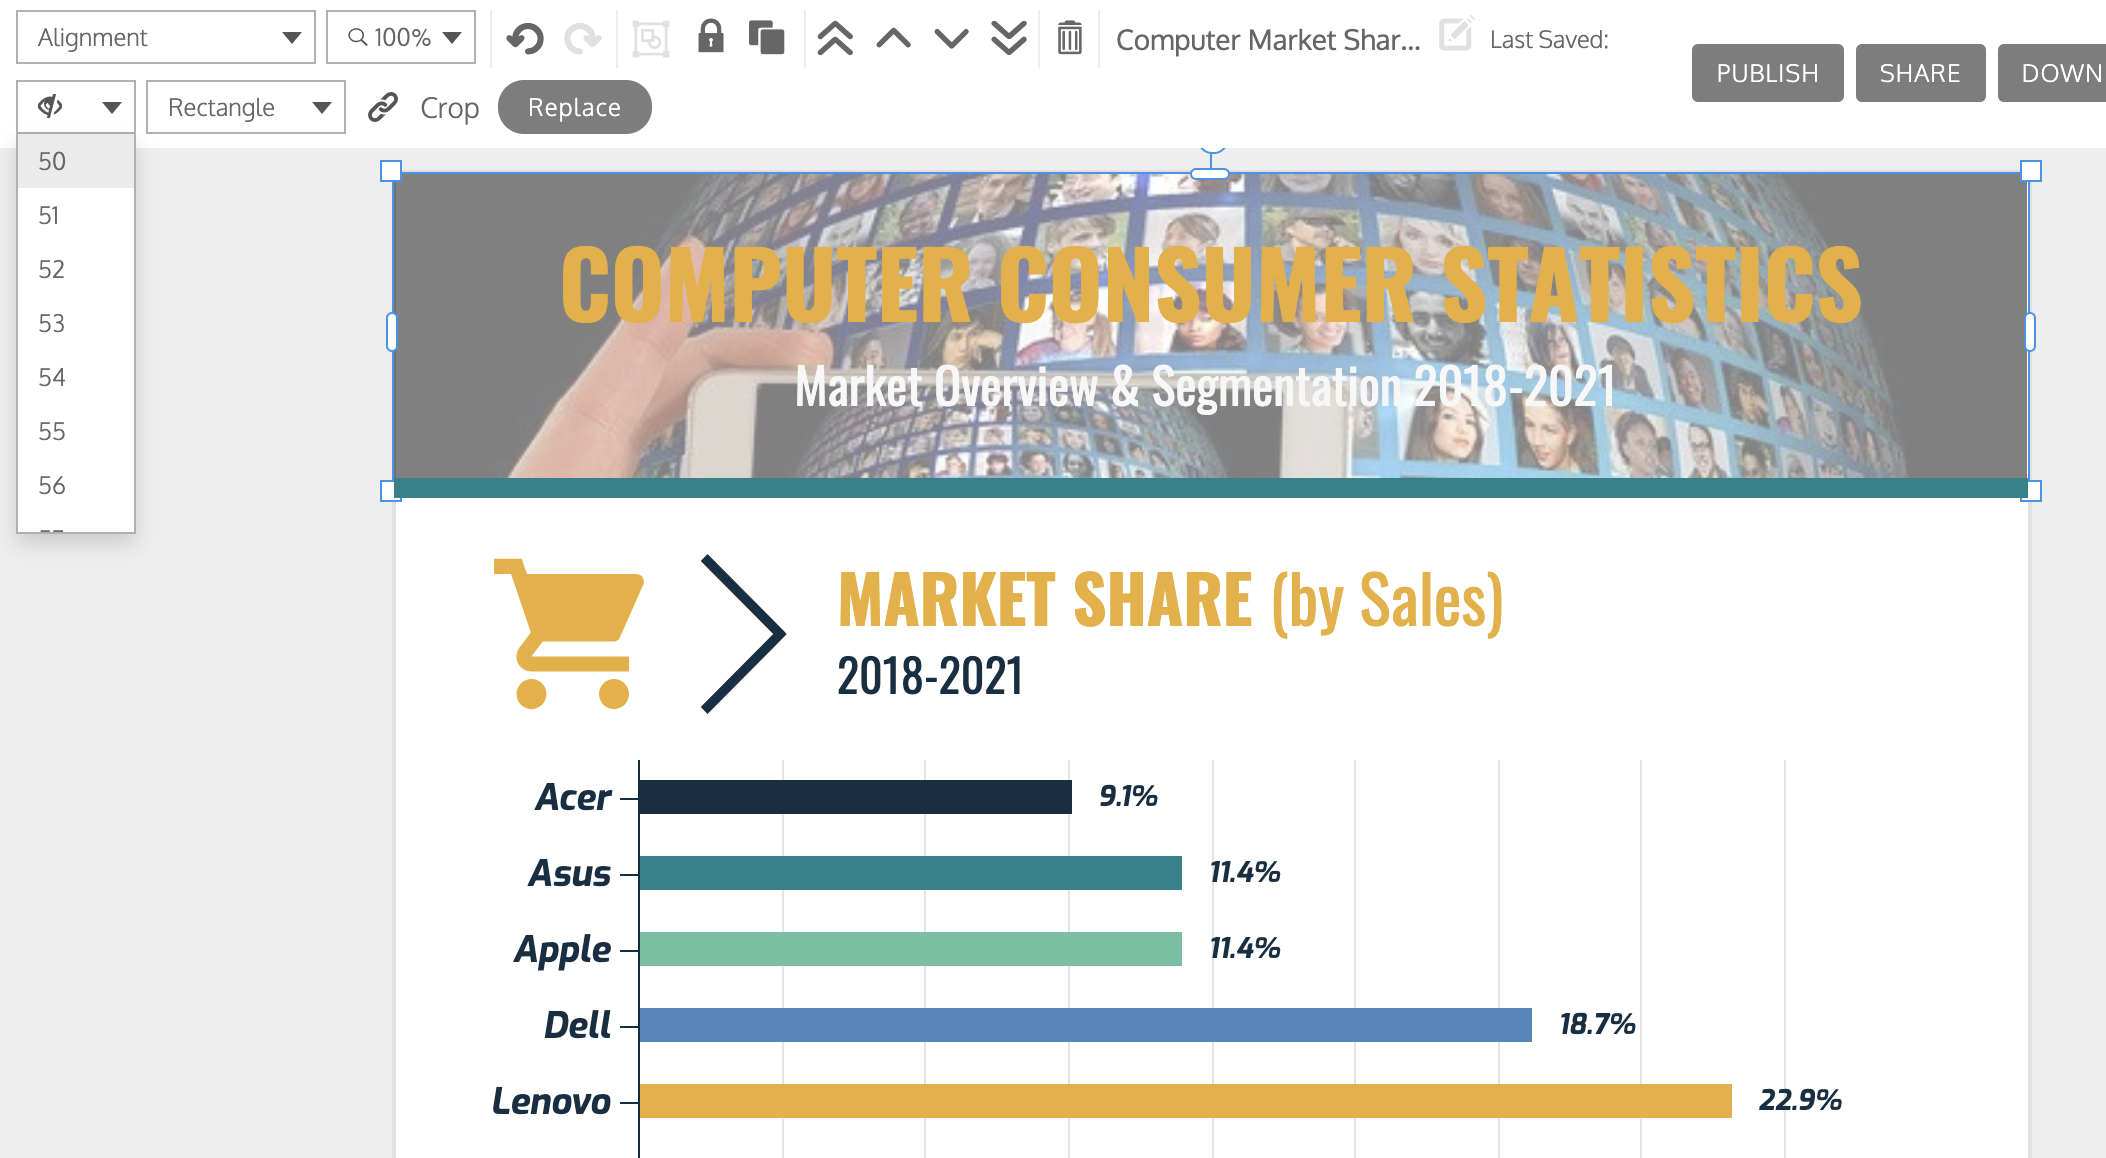
Piktochart uses a drag-and-drop interface to make it relatively simple to change the appearance of your infographic. Gridlines appear as you move objects, helping you to align them with other elements on the canvas.

For more precise adjustments, you can also highlight the selected item and move it using your arrow keys.

Editing an infographic in Venngage
Venngage also uses a simple drag-and-drop interface with grid lines that help you align elements on your canvas. But once you start using Venngage, its powerful data visualization and information design capability are obvious.
Similar to Piktochart, Venngage has a sidebar where you can select specific design elements like stock photos, charts and icons and a top menu to help you customize design elements.

Another big plus: Venngage’s extensive icon and photo libraries are completely free to use.
Venngage has 23,000+ creative icons and over 3 million free, professional stock images that you can browse in the Venngage editor and add to your infographic. All templates already include the icons and photos in them—you don’t need to pay an additional $1 or so per element.
Adding and editing charts
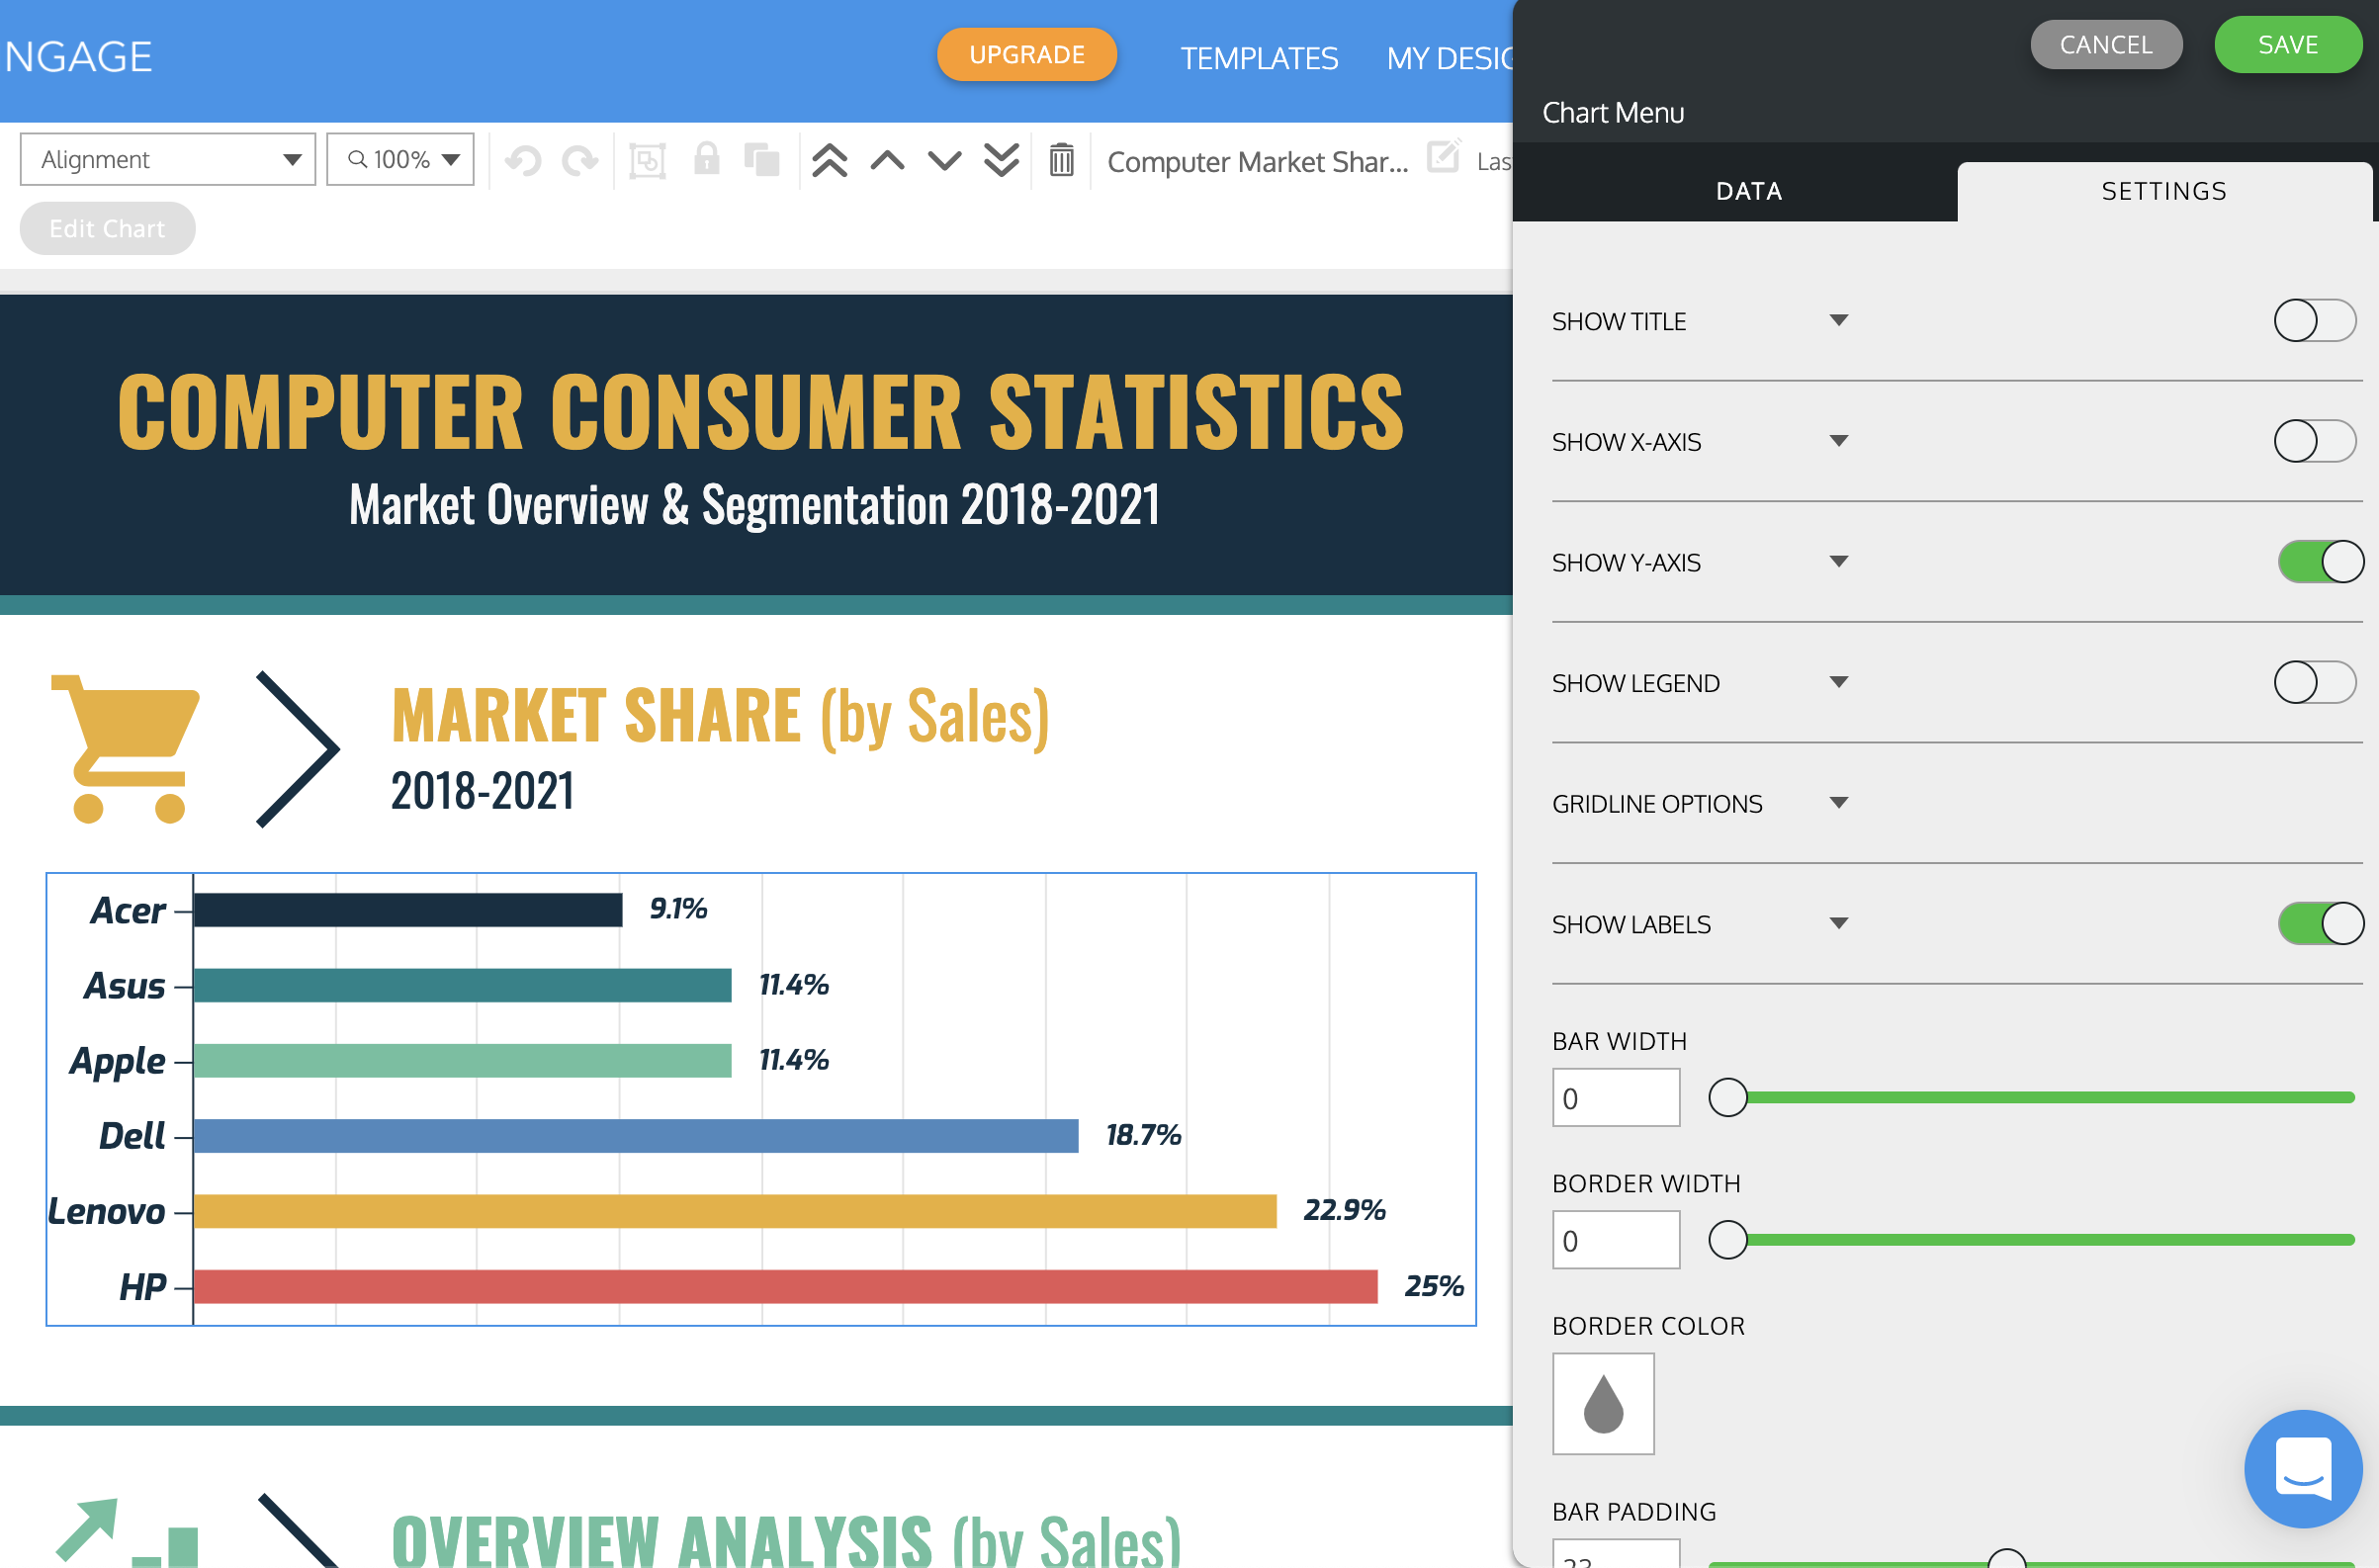
Chart templates are easily found in the side menu. When you double click a chart in a template, Venngage’s chart editor opens up, as you can see below.

Venngage’s chart maker is more powerful than Piktochart’s. First off, you can import data automatically by pasting in a Google Sheet link or uploading an Excel file.
It’s also easy to adjust the chart values, colors and fonts. You can also change the chart type (to a pie chart, bar chart etc.) using the editor and the chart will update automatically.

You can customize the labels, legend and axis text on your charts, so you can display your data exactly how you want it.
Venngage also offers choropleth map templates as part of their map maker. Piktochart does not.
Adding and editing icons
Venngage’s icons are incredibly diverse, with the option to change skin color in select icons, which you can see below.
The Venngage icon and illustration library has over 2,000 diverse icons, illustrations and graphics. You can find people from all walks of life engaging in a variety of activities.
It’s also simple to add or replace icons in Venngage. You can search for icons in the editor’s side menu.
Venngage offers a wide variety of icons for creating timelines, mind maps, flow charts and other infographic visuals.
Or double-click on an existing icon in your template to open the Replace menu.
Search for a new icon or photo, select one and the icon will automatically be replaced in the same position, size and color in your template. You can do the same with photos and illustrations.
This makes it a lot easier to replace elements in your Venngage infographics than in Piktochart. Our GIF below shows how easy it is.
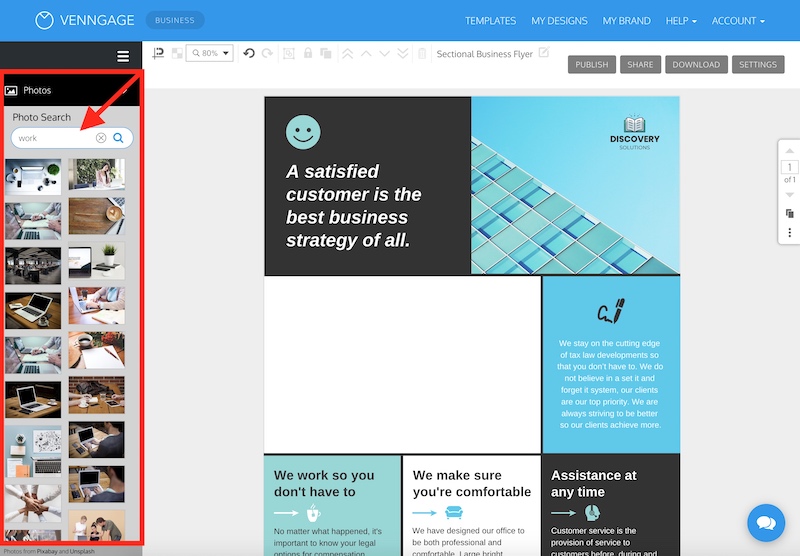
Adding and editing photos
Venngage gives you the option to upload your own photos or choose from their stock photo library with over 3 million free, professional stock photos that have many diverse options.
You can also use the Replace menu to change a photo with an icon, an uploaded photo or an image from our stock photo library. This GIF shows how simple it is.
You can adjust the dimensions of a photo using toggles, as well as change the opacity of the photo.
Aligning elements on the page
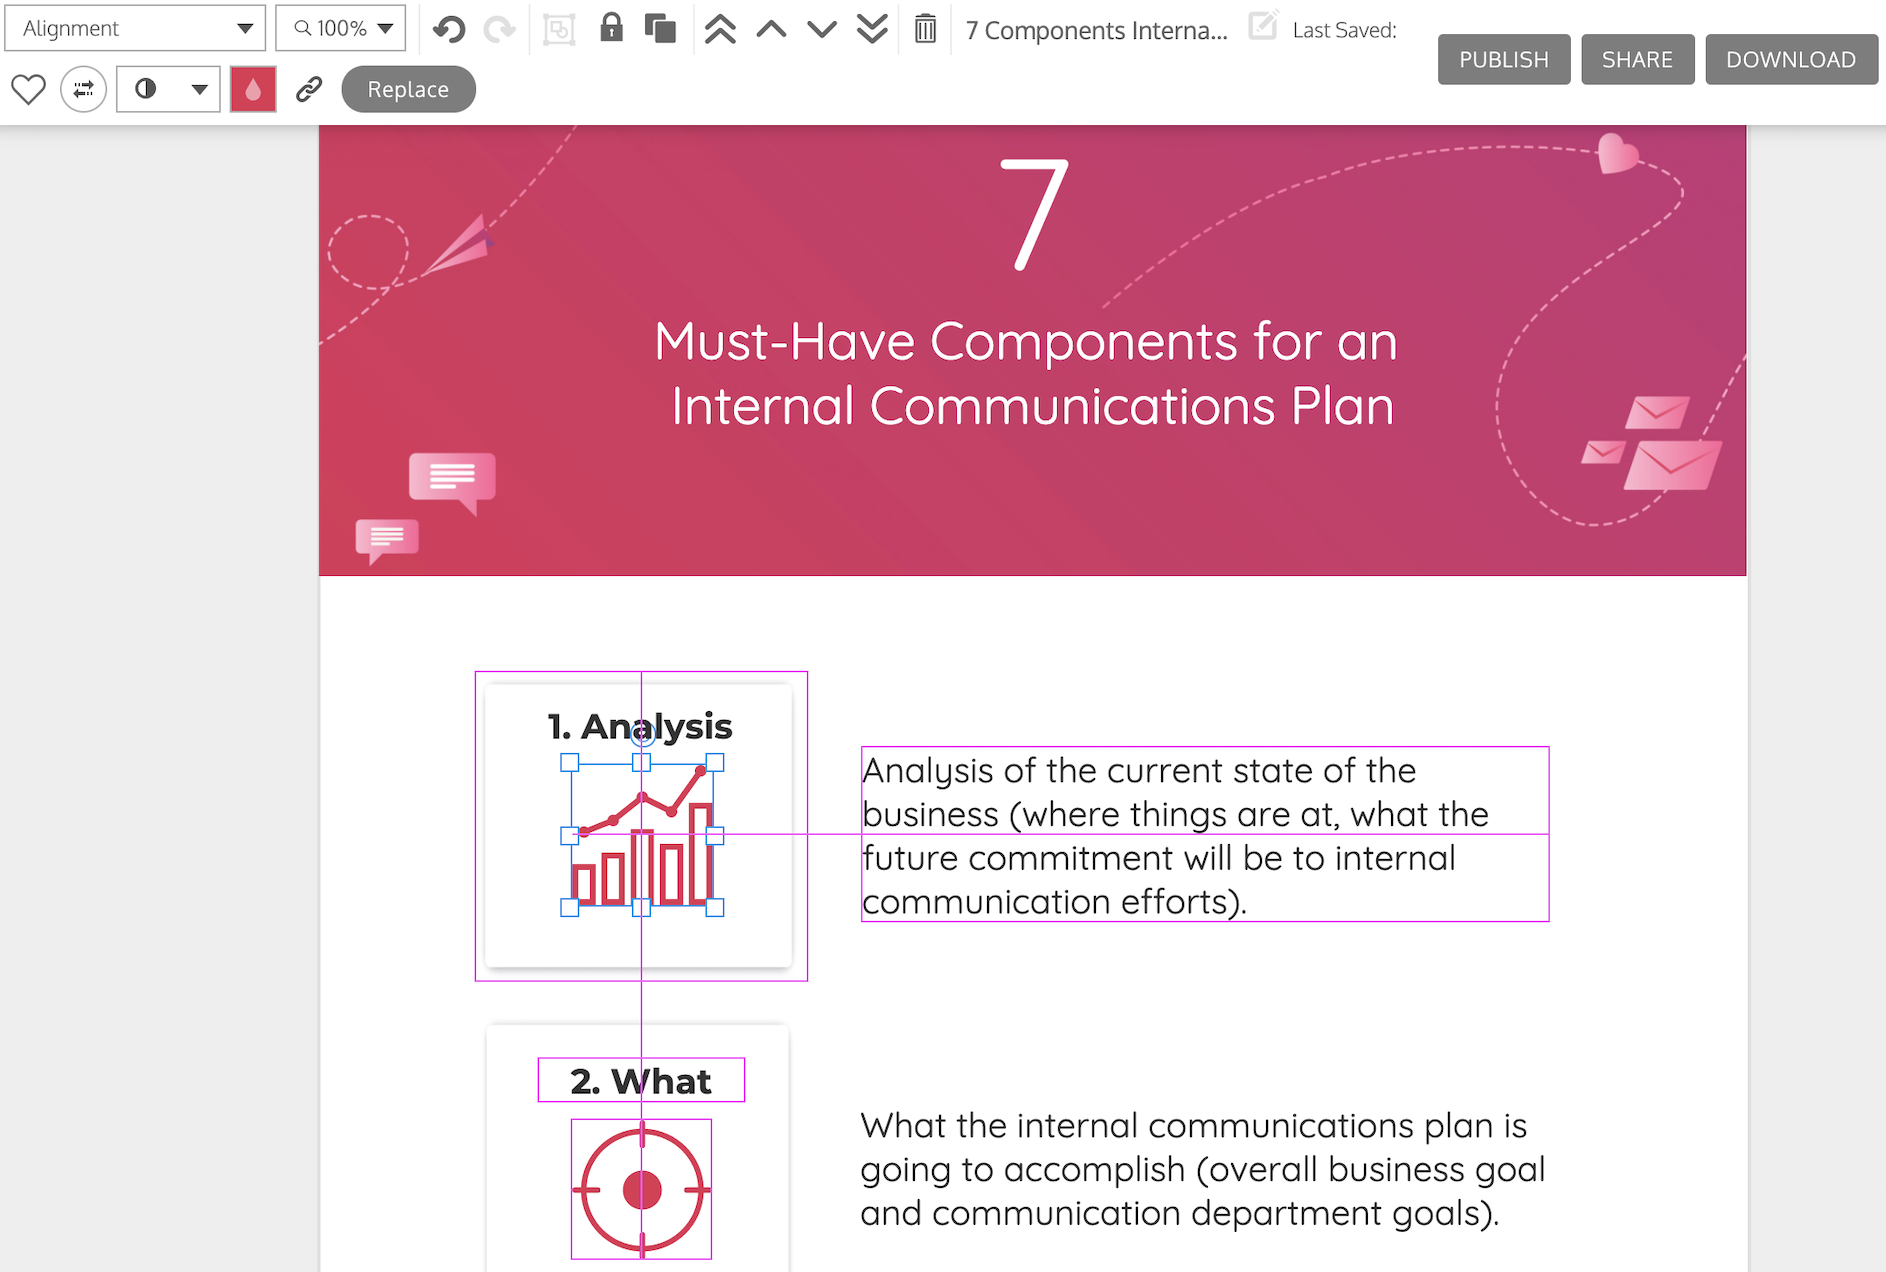
Venngage’s editor has a handy alignment tool called Smart Guides that makes it easy to align or re-organize elements on the page. They offer a grid view and page margins as well to help you prepare your designs for print.
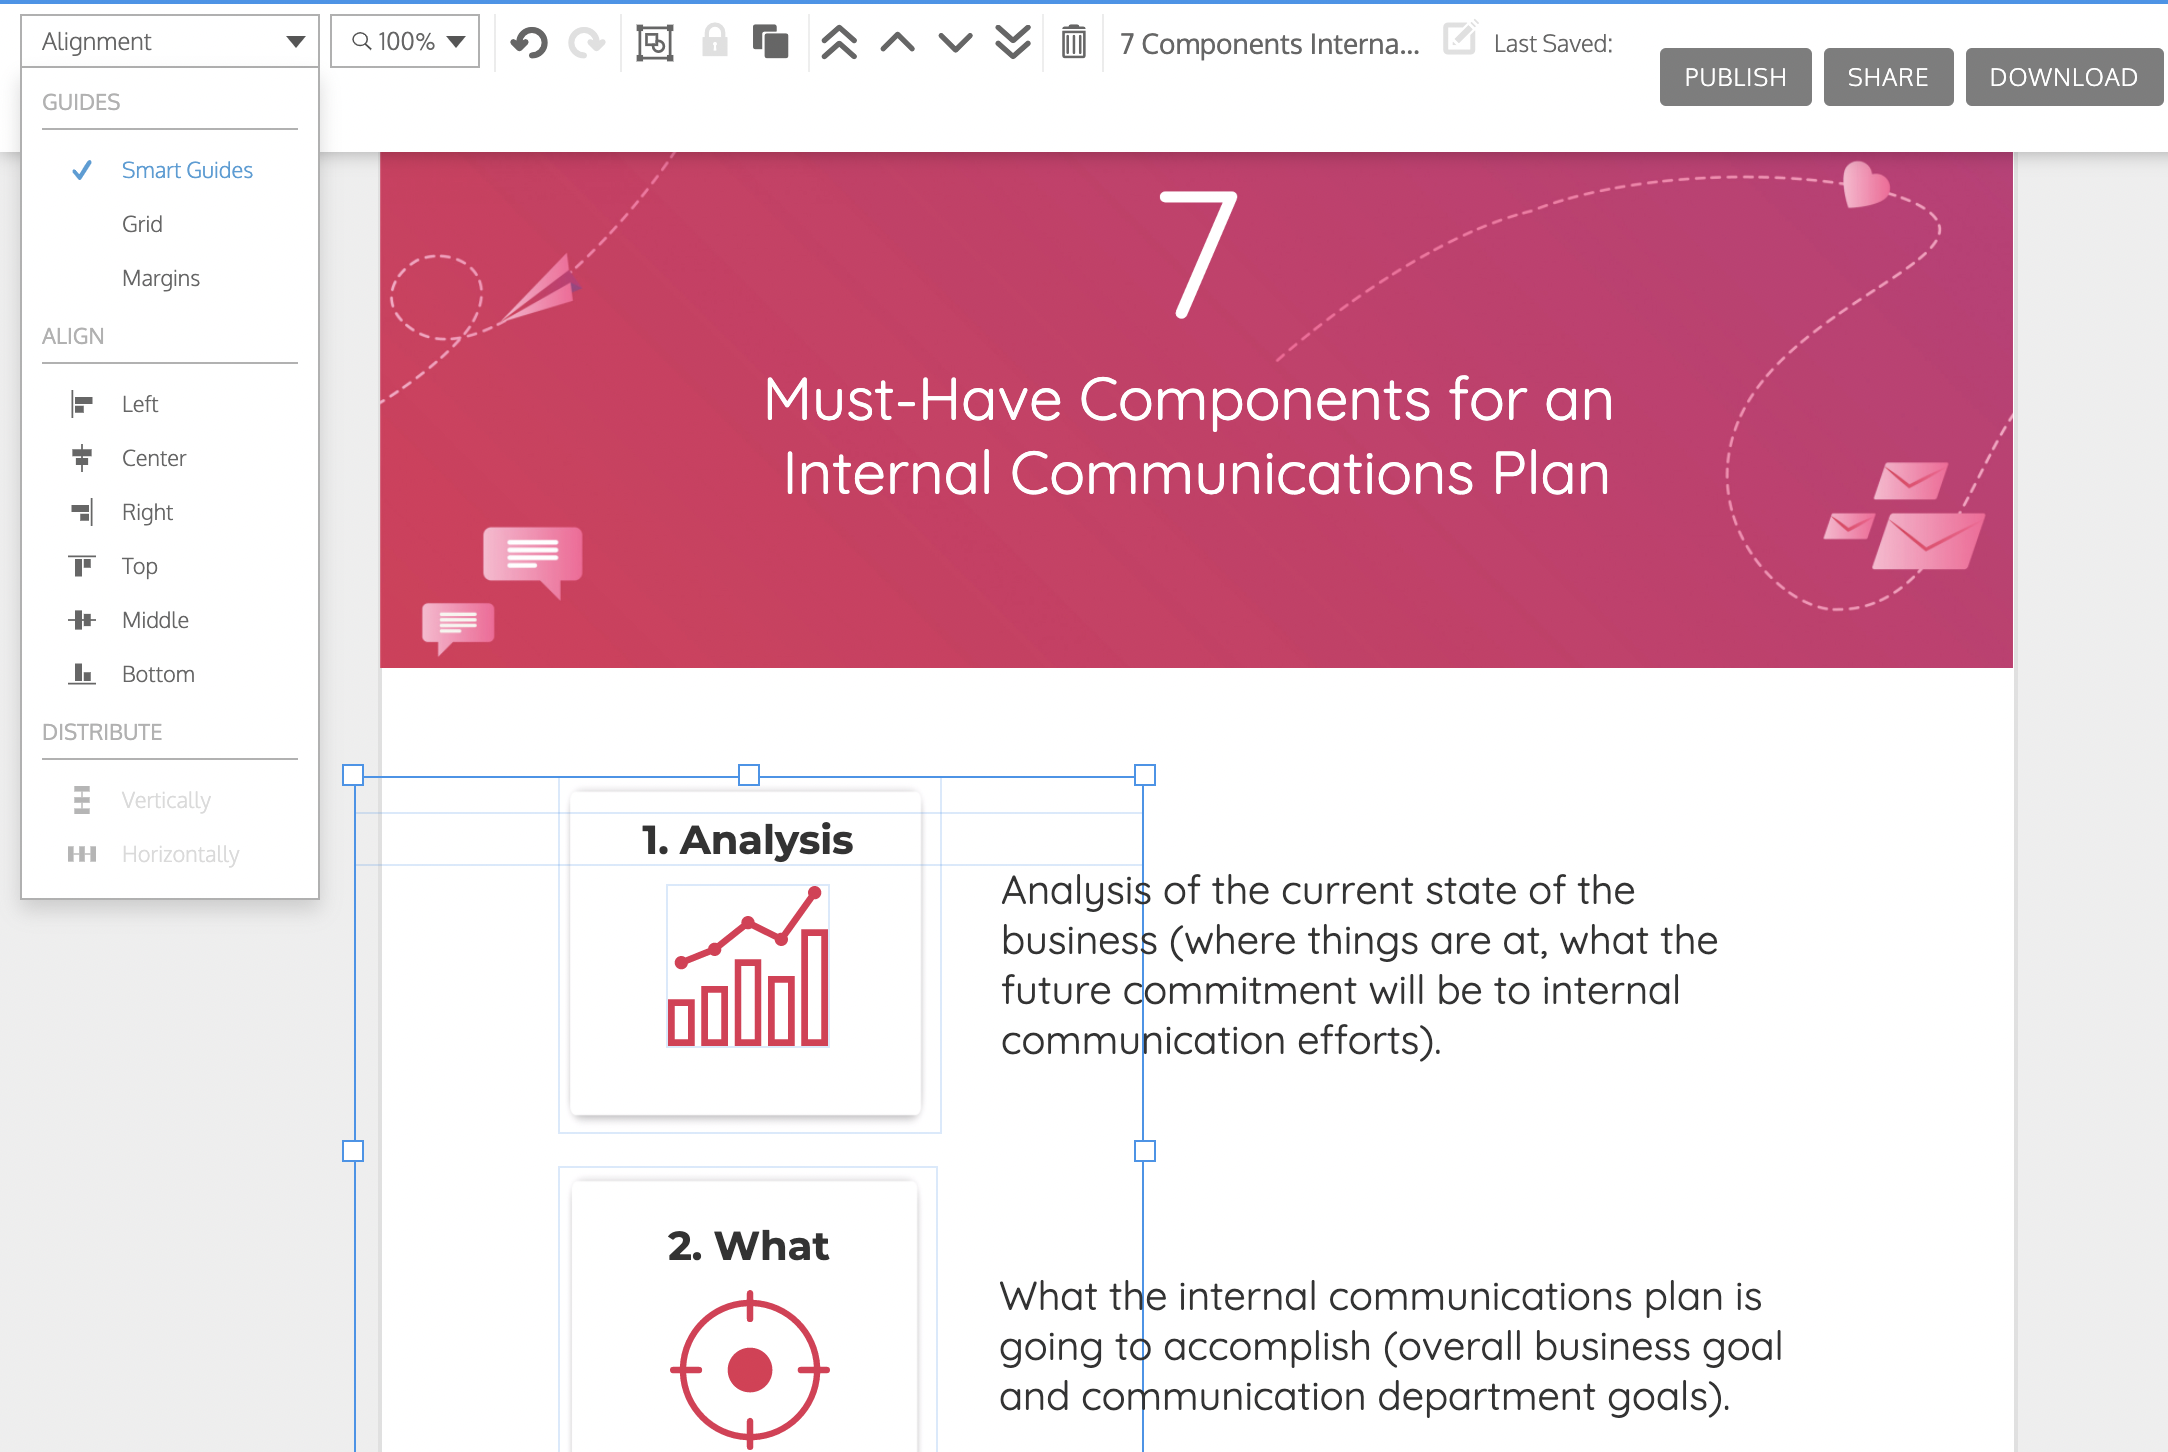
The Smart guides are particularly useful when creating infographics, which usually have a lot of elements.
Cost and value: Piktochart vs Venngage
The cost of these tools will depend on what you want to do with them and how you choose to pay. Both of these tools offer free plans with limited capabilities, as well as paid subscription plans for businesses and individuals. Here’s the simple summary:
Piktochart’s Pro Plan is the same price as Venngage’s Premium Plan but it only includes unlimited infographic creation and export to HD. Venngage’s has the same, but also premium templates and premium icons (and more).
Piktochart’s Team Plan is a whopping $99 USD per month but has very limited benefits, including 5 team members, a lightweight Brand Kit, team sharing and commenting. Venngage, at $49 USD per month has a robust Brand Kit, real-time team collaboration, business templates, CSV upload for charts, export as PowerPoint format and much more.
The takeaway? If you want a robust Business Plan with professional-level templates, excellent customer support, beautiful, diverse icons and stock photos and robust team features, Venngage is for you. Even individuals will benefit from Venngage’s Premium Plan and its premium templates and charts. You can find the full breakdown below.
Piktochart pricing plans
Free
- Up to 5 active visuals
- About 100 free infographic templates
- About 100,000 stock photos and graphics
- 5 GB of cloud storage
- Export images in standard quality
- Piktochart watermark
- Team sharing and commenting
Pro
Individuals
- $29/month
- Billed annually saves 17% at $24.17 per month
- Brand Kit to upload fonts and logos (but not colors)
- Create unlimited visuals
- 100 GB storage for image uploads
- Export images in HD
- Watermark removal
- Export your visual in PDF format
- Export presentations to PowerPoint
- Protect your published visuals with passwords
- Create and use your own color schemes
- Upload & use your own fonts
- Organize your visuals in folders
- 24/7 support
Team
- For small to big companies
- $16.50 per month per seat for up to 5 seats, billed annually
- $99 per month for 5 team members (cannot decrease seats), billed monthly
- 1GB/user storage for image uploads
- Log in securely with SAML Single Sign-On
- Create custom templates for your team
- Share your project with team members
- Leave comments on your team’s visuals
- Set roles and permissions
Venngage pricing plans
You can save 12% when choosing a quarterly plan or 20% for a yearly plan. Venngage accepts Visa, Mastercard or American Express.
Free
- 5 Designs
- 5 Image Uploads
- Branding
- Charts & Icons
- Free Charts
- CSV Upload
- Free Icons
- Team & Collaboration
- One Personal Seat
- Share Publicly
Premium
- $19/month USD per user ($17 quarterly, $16 yearly)
- Unlimited Designs
- 50 Image Uploads
- Premium Templates
- Venngage Branding
- Premium Charts
- CSV Upload
- Premium Icons
- Export PNG, PNG HD, PDF
- One Personal Seat
- Share Private Links
- Email and Chat Support
Business
- $49/month/user USD ($43 quarterly, $39 yearly)
- Unlimited Designs
- 500 Image Uploads
- Premium Templates and Business Templates
- My Brand Kit
- Organize With Folders and Subfolders
- My Templates
- Font Upload
- Premium Charts
- CSV Upload
- Premium Icons
- Business Icons
- Export: PNG, PNG HD, PDF, Interactive PDF, PowerPoint
- One Team Owner Seat
- Team Size of 1-10
- Share Privately and With Team
- Real-Time Collaboration
- Support: Priority Email & Chat Support, Phone Support, 1-1 Consultation
- Live Training Workshops
Enterprise
- Custom pricing: Contact Sales for Pricing
- Everything in Business Plan, plus:
- Custom templates
- Team size of 11-100+
- Support from a dedicated Account Manager and Team Onboarding
Infographic templates: Piktochart vs Venngage
Let’s look at the types of templates that both design platforms offer. Both Piktochart and Venngage have a wide variety of templates—from infographics to mind maps to posters to presentations. Venngage has more templates overall, 6,100+ in total and 2,600+ infographic templates. Piktochart has about 100 infographic templates.
Piktochart’s infographic templates

Piktochart’s templates are simple and colorful. They’re organized into several categories:
- Brochures
- Flyers
- Infographics
- News Visualization
- Posters
- Presentations
- Proposals
- Reports
- Resumes
- Social Media
Types of chart templates
Piktochart offers a variety of chart formats for you to choose from, including:
- Maps
- Bar charts
- Scatter plots
- Pie charts
- Line charts
- Donut charts
When you insert a chart, you will be able to choose from several colors and angles, customizing your datasets and data labels.
Other visuals
Icons
Piktochart has 4,000 icons in 30 categories. These icons are full color and mono-color (one color) and can be inserted using drag and drop.

Graphics
Piktochart integrates with Unsplash, giving you access to over 500,000 professional images that are free to use for personal and commercial purposes. To insert an image, drag it from the left-hand menu into your infographic.

Fonts
With Piktochart, you have access to dozens of free fonts, from the ubiquitous Arial to fonts such as Montserrat. The fonts available, however, are free fonts available everywhere online (such as the Google fonts).
Piktochart also gives you the ability to upload custom fonts or ones that you have sourced online (paid plans only).

Venngage’s templates
Venngage’s template library is more focused on data visualization and information design, with a specialty in creative and easy-to-create infographics.
There’s also more focus on infographics for business use cases like marketing, employee training, business analytics, consulting, human resources, project management and more.
Venngage’s infographic templates
Venngage offers an extensive selection of infographic templates for many use cases and industries, whether that’s healthcare, finance, construction, enterprise-level retail, nonprofits and more. They also publish new infographic templates every week so you can always find new inspiration.
Their infographic selection includes:
- Timeline infographics Templates
- List infographics
- Process infographics
- Statistical infographics
- Geographic infographics
- Comparison infographics
- Nonprofit infographics
- Human resources infographics
- Finance infographics
- Health care infographics
- Real estate infographics
- Marketing infographics
- Educational infographics
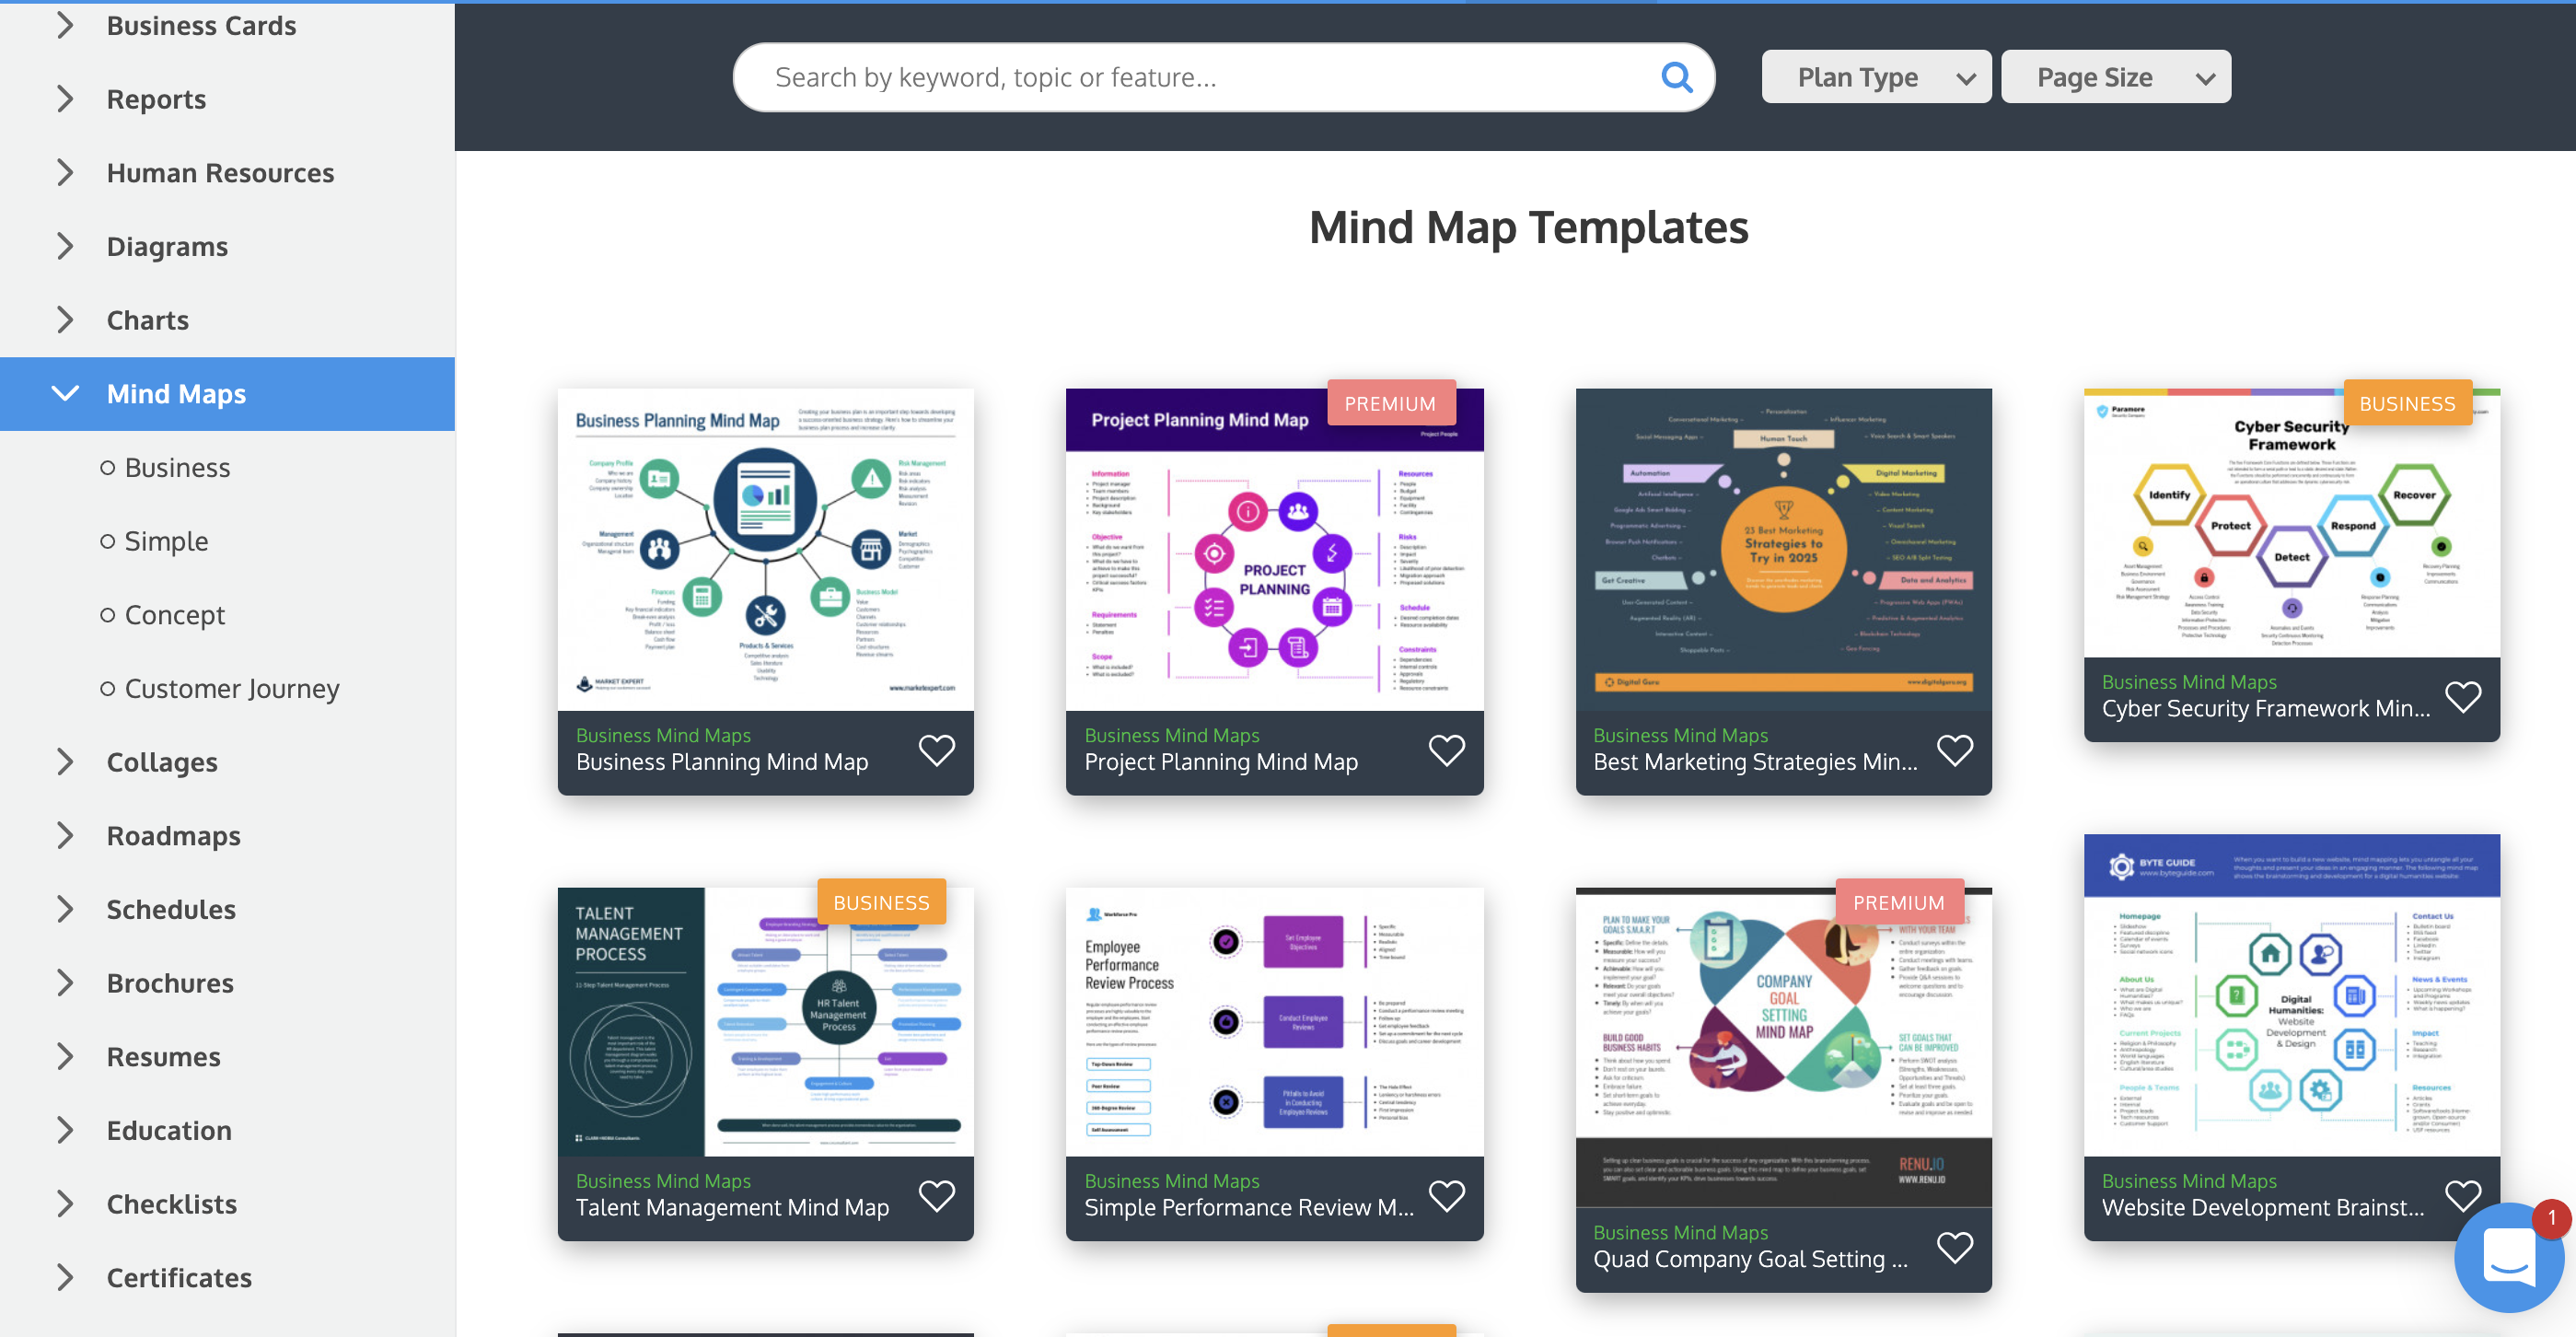
Venngage also offers many other templates like mind maps, business plans, presentations, flow charts, roadmaps, reports, checklists, social media graphics and so much more.
What really sets Venngage’s templates apart is their content. The content in Venngage’s templates isn’t just Lorem Ipsum filler like Piktochart. Instead, it’s the actual content you would find in whatever role or industry the infographic is designed for.
This is really useful if you’re not sure what type of infographic layout would work best for the information you want to visualize or even what information you want to include!
Types of chart templates
Venngage has all of the essential charts you need to visualize data:
- Line charts
- Column and bar charts
- Stacked column and bar charts
- Pie charts
- Area charts and stacked area charts
- Half pie charts
- Maps
- Word clouds
- Bubble charts and stacked bubble charts
- Pyramids
- Funnel charts
- Pictograms
- Multi-series charts
- Scatterplots
- Treemaps
- Tables
- 3D columns and 3D stacked columns
- 3D pie charts
Other visuals
Icons
Venngage has an extensive library of 40,000+ icons and illustrations (including 2,000 diverse icons), many of which can be edited to use your brand colors. Many icons are free, but there are premium icons that are only available to paid members.
Illustrations
Venngage offers an extensive collection of diverse and inclusive icons for a variety of different industries, jobs and use cases. These beautiful gradient icons will add a unique twist to your communications.
Photos
Venngage’s stock photo library is integrated with Unsplash and Pixabay, giving you access to over 3 million professional photos. You also have the option to upload and store your own photos.
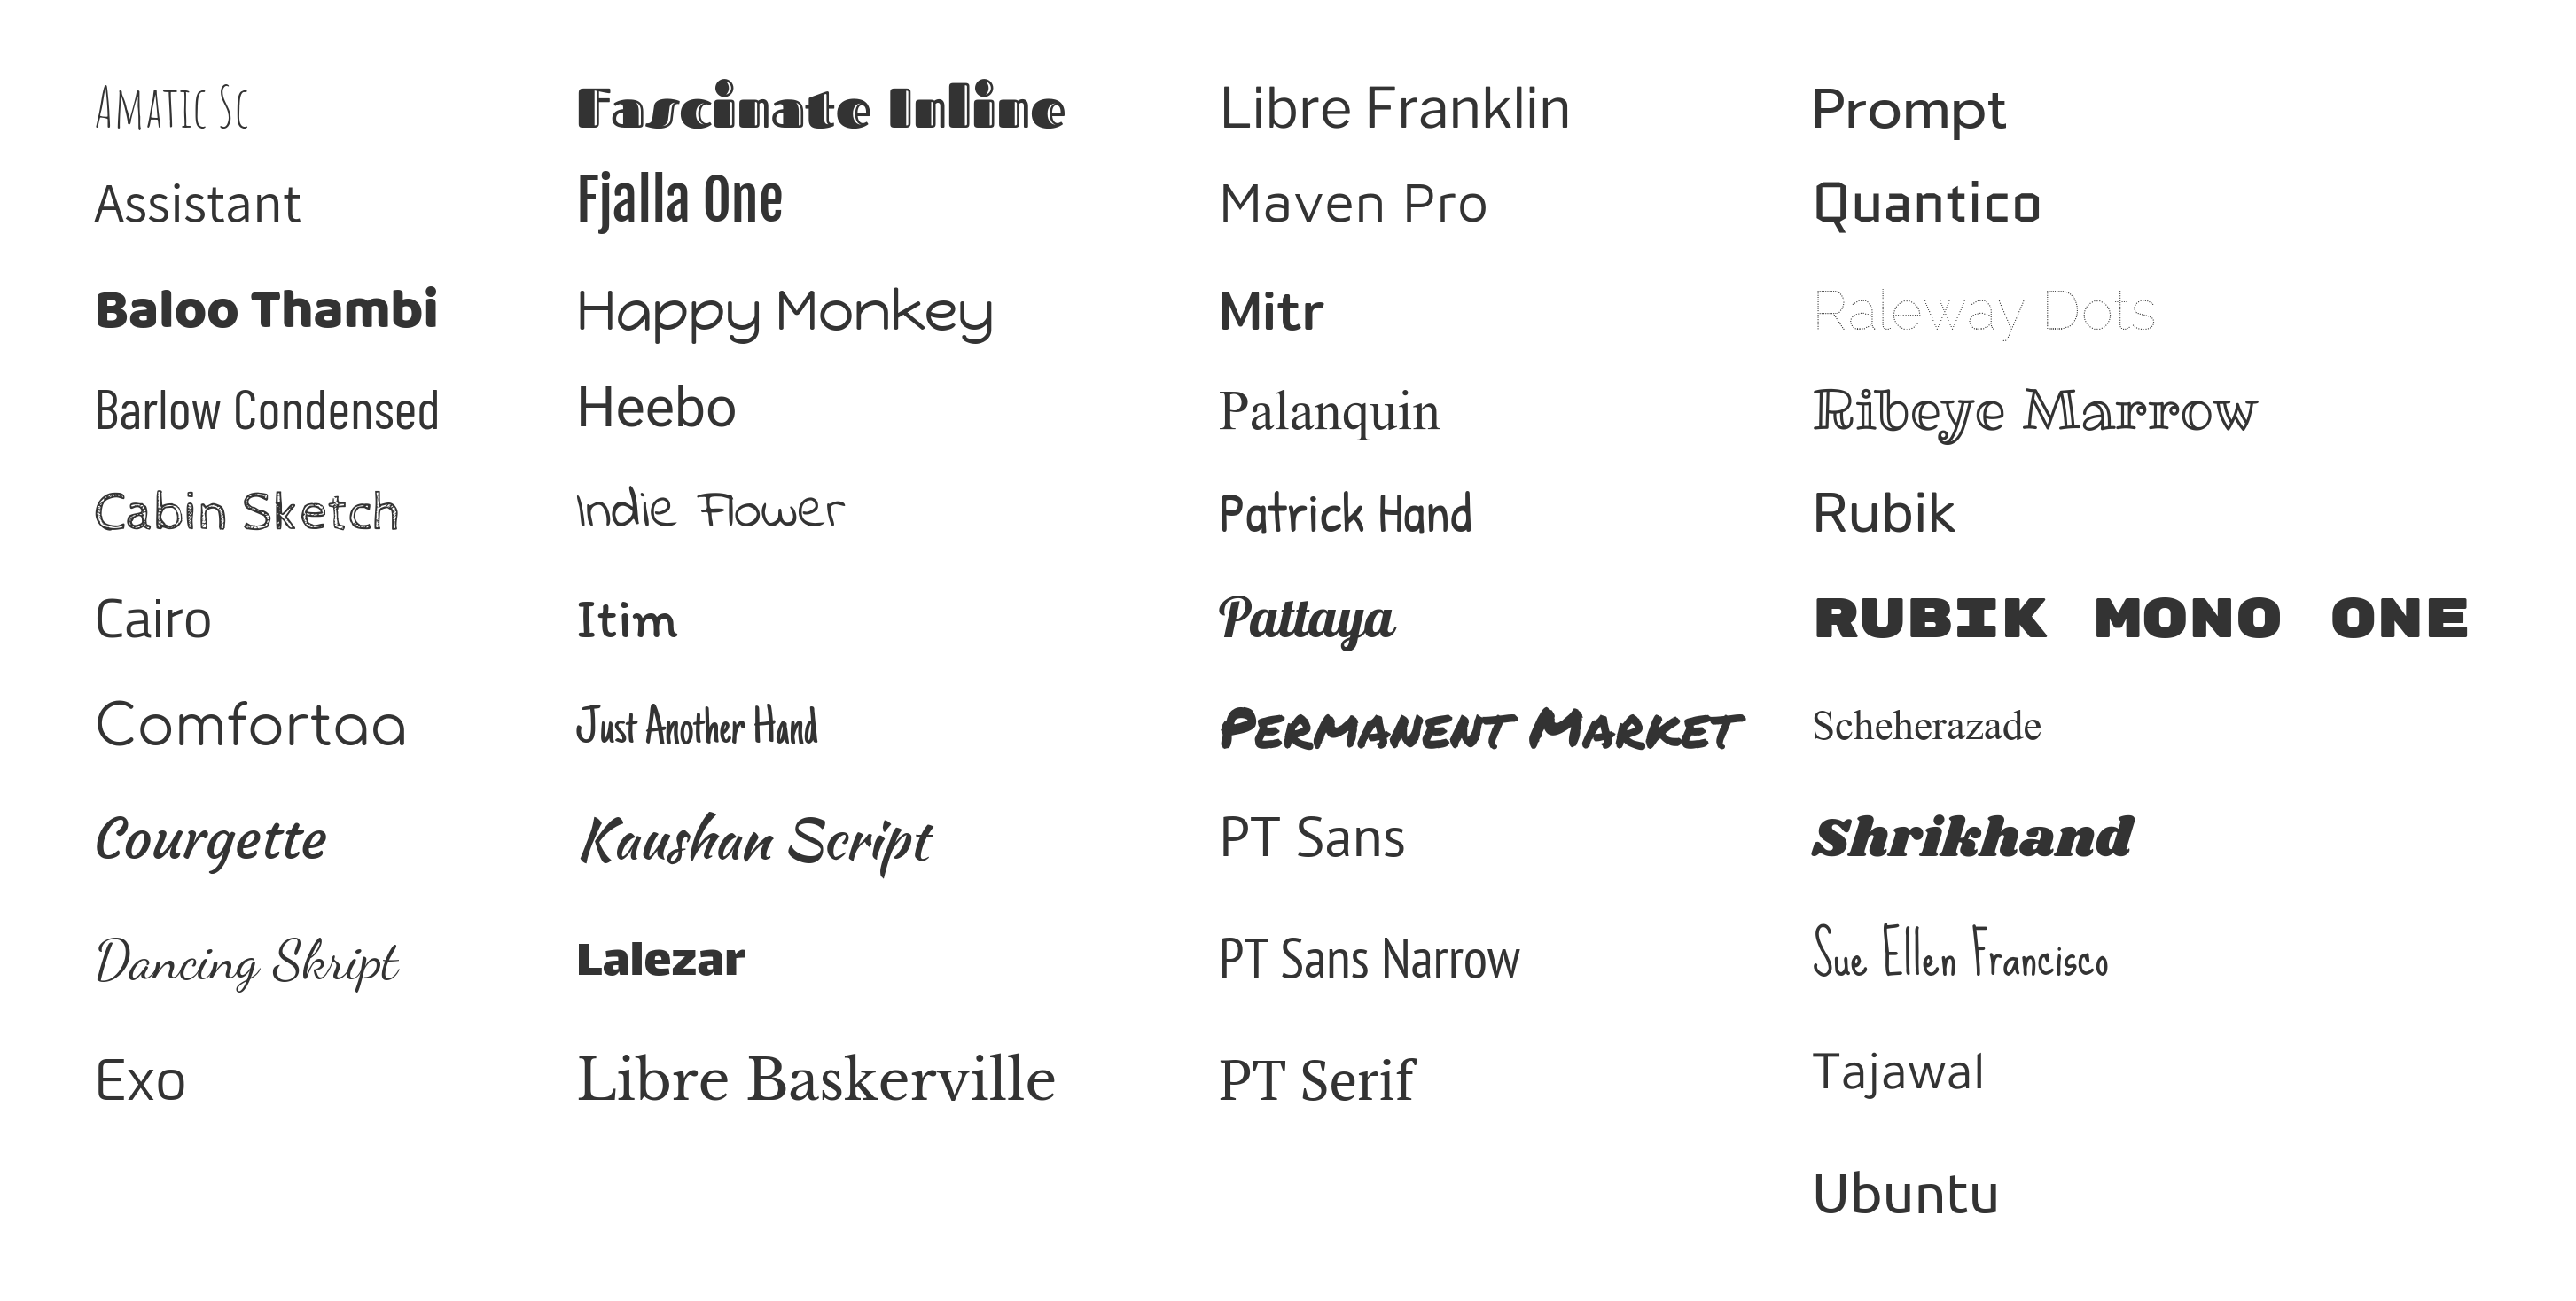
Fonts
Venngage has hundreds of popular, creative and professional fonts. You also have the option to upload your own fonts with paid plans.
Adding your branding: Piktochart vs Venngage
Piktochart’s Brand Kit
For pro subscribers, Piktochart offers the ability to set up colors and fonts for your branding. From the dashboard, you can find Brand Assets in the right-hand menu. Here you can upload a logo and select your branding colors.

Once you have set up your Brand Assets, you can apply them to your future work. It’s a very light version and Piktochart doesn’t really advertise it much on its site, signaling it’s not a priority for them. You can also only add your own colors if you upgrade.
Venngage’s Brand Kit
Venngage offers a Brand Kit that makes it easy to apply consistent branding to your designs. You can add your own colors anytime—no paid plan required.
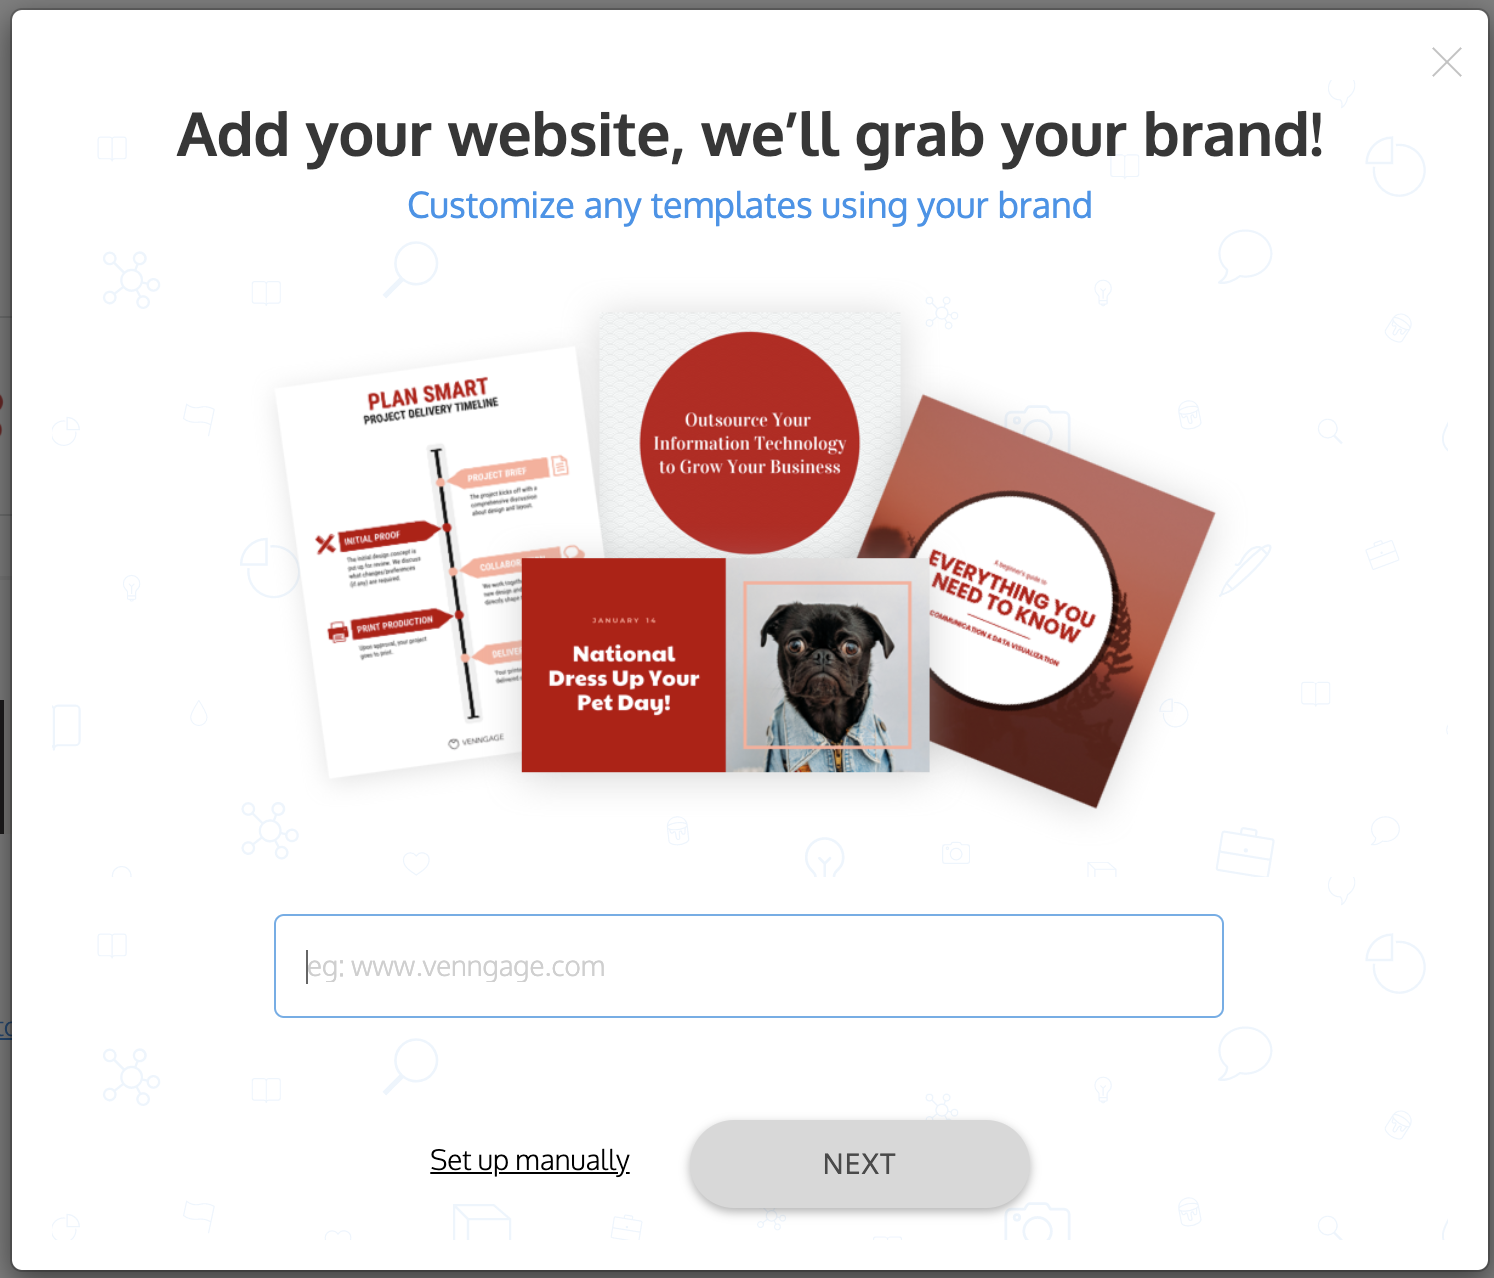
All you have to do is paste your website URL and Venngage extracts the logo and website colors. Once you’re in the Brand Kit, you can upload your fonts, too.
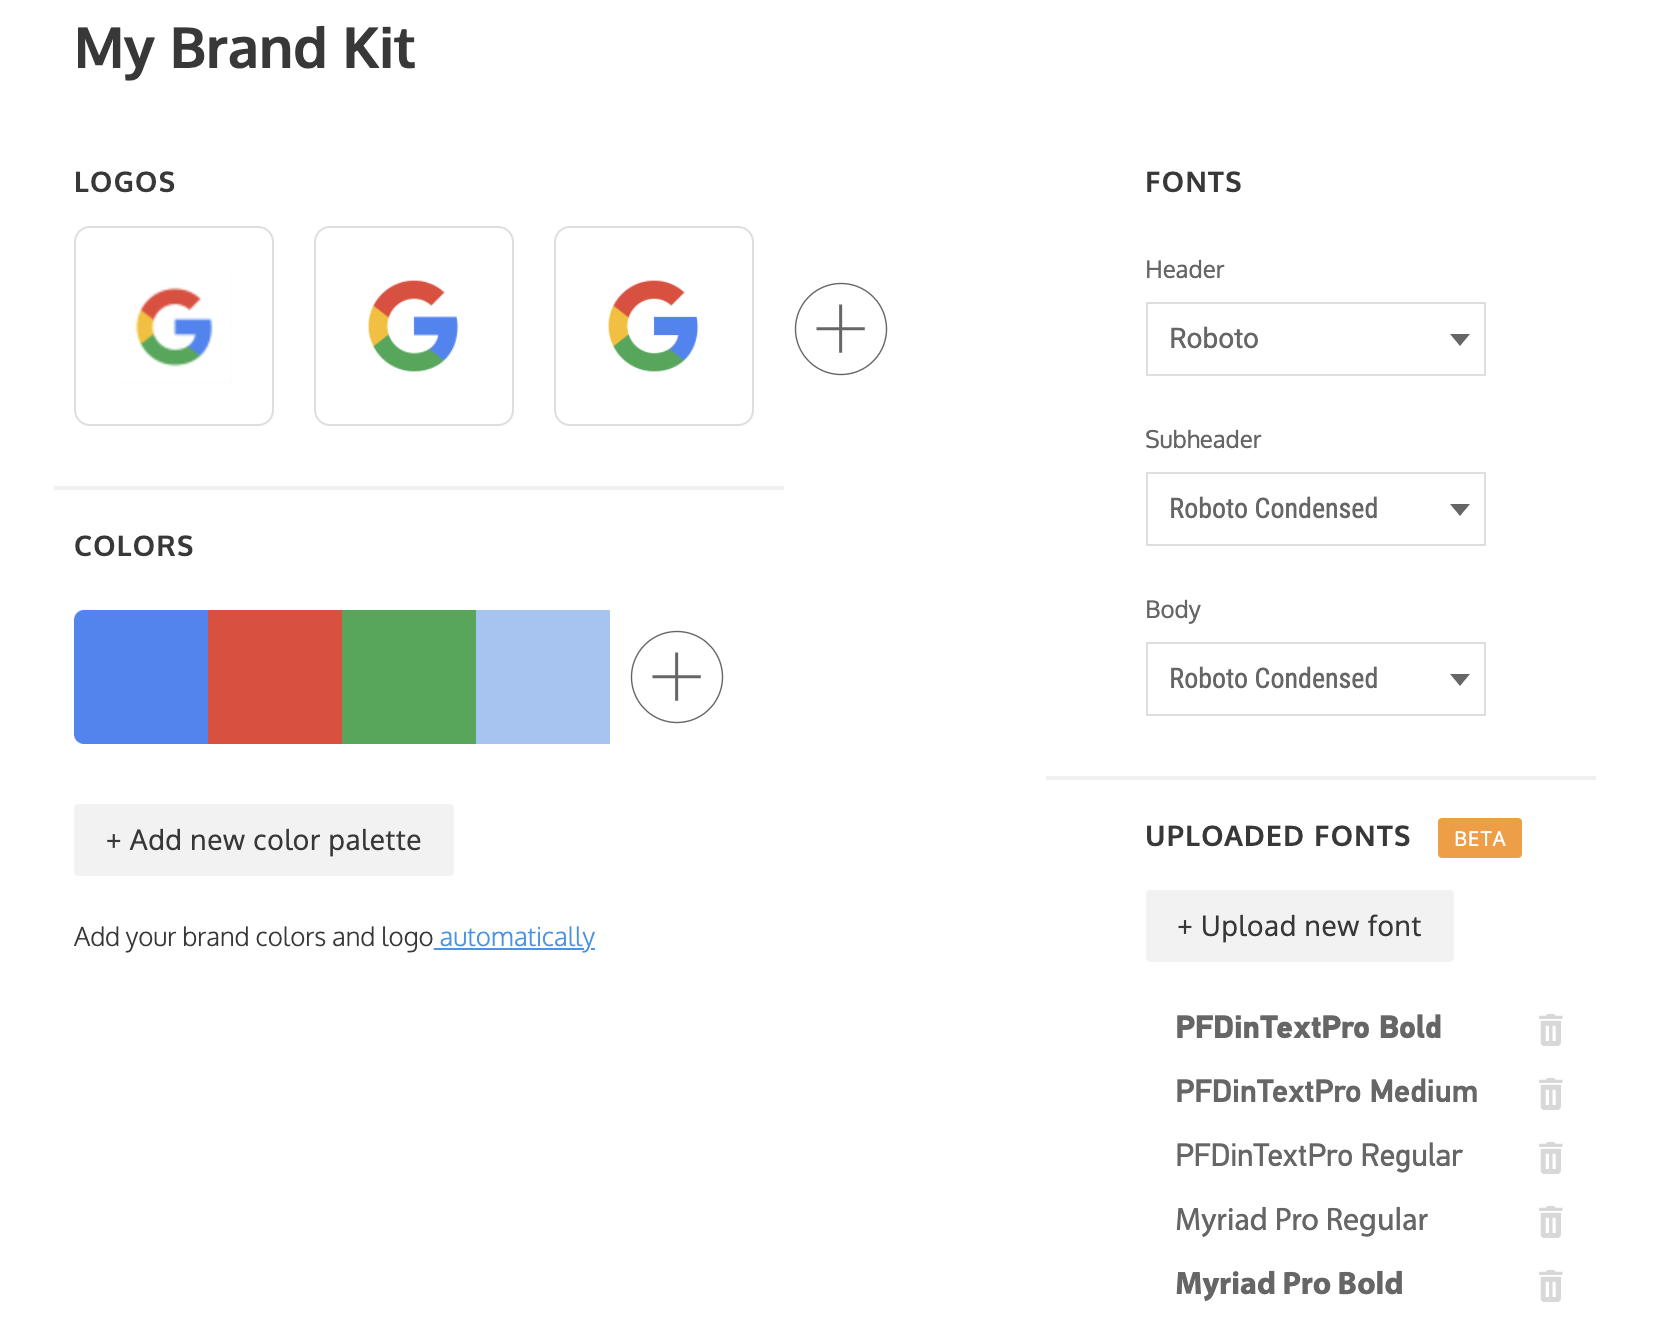
Once you’ve added your brand assets, you can apply them to any template using the Brand Kit in the editor. You can cycle through different color palette combinations using the color palette tool. It’s a simple but powerful way to quickly brand any template and create consistent designs.
Support and resources
Piktochart’s customer support
Piktochart has a customer support team that provides advice and guidance for Piktochart users. For most problems, Piktochart’s online knowledge base offers answers to many questions about the tool’s user interface and functions.
Piktochart has an average 4.4 star average on 134 reviews on G2 and 4.7 star average on 90 reviews in Capterra. Customer support gets an 8.5/10 and 4.6/5 respectively.
Piktochart’s design resources
To help you get the most of Piktochart’s tools, YouTube videos are available to provide you with step-by-step guidance. These tutorials will help you understand how to use more advanced features such as mirror-image effects and image frames.

Venngage’s customer support
Venngage’s Customer Support team is top-notch. Their customer service has a 4.6 rating on Capterra (same as Piktochart) and a 9.4 rating on G2 (higher than Piktochart).
They offer live chat support, 24/7 as you can see below.

Venngage’s support team is very responsive—users can expect to receive a response well within 24 hours, usually within minutes. Support team members live all over the world, meaning there’s always someone in your time zone.
Business Plan members get phone support and priority chat and email support. Enterprise plan members get a dedicated Account Manager and free team onboarding.
Venngage’s design resources
With a Venngage for Business plan, you can schedule 1-1 design consultations with their in-house design experts.
Venngage also offers an extensive library of educational design resources (guides, and videos) that teach you the basics of infographic design, graphic design, information design, data visualization, and designing for accessibility. Their educational content is written and reviewed by their in-house information design experts.
Ease of use: Piktochart vs Venngage
How long does it take to become a Piktochart pro?
Piktochart has limited options and features and most features are available on their free plan. So, you can easily get started with Piktochart and create something right away.
But, Piktochart is mainly designed for people who want to create something for free and aren’t too concerned about the quality–this is the drawback.
How long does it take to become a Venngage pro?
Venngage makes infographic design accessible to people of any design level. The intuitive editing features make it fast and simple to make professional-level infographics, diagrams and charts—without the learning curve of a professional design solution like Illustrator.
If you’re new to visualizing data, it may take you a few tries to figure out which types of charts works best for your data, or which type of infographic will best visualize your process.
To help with the learning curve, Venngage offers a ton of helpful resources such as our Infographic Masterclass and Infographics for Beginners eBook.
Head-to-Head Comparison 2026: Venngage vs Piktochart for Professional Infographics
| Feature | Venngage (Professional Choice) | Piktochart (Basic Business) |
|---|---|---|
| Pricing (2026 Annual Rates) | Free: $0 Premium: $10/mo (Originally $19) Business: $24/mo per user (Originally $49) Enterprise: From $499/mo | Free: $0 Pro: ~$14/mo Business: ~$24/mo per user Enterprise: Custom Pricing |
| AI Visual Capabilities | Full Business Suite: AI generators for Infographics, Reports, Diagrams, Newsletters, and professional White Papers. | Layout focused: AI generators for simple infographics, posters, and flyers; lacks technical document depth. |
| Accessibility Standard | Gold Standard: Built-in AI Accessibility Auditor, Color Blindness Simulator, and automated PDF/UA tagging. | Basic: Standard alt-text support; no automated accessibility auditing or compliance verification tools. |
| Team Collaboration | Real-Time Editing: Multiple users can design simultaneously with private team folders and shared Brand Kits. | Limited: Stakeholders can comment, but simultaneous real-time multi-user editing is restricted. |
| Data Visualization | Advanced: 35+ professional chart types, direct CSV/Google Sheets sync, and technical map data. | Standard: 12+ basic chart types and simple map editor; tailored for classroom and simple office use. |
| Template Variety | 40,000+ Business-vetted templates designed for data clarity and executive presentation. | ~6,000 templates focused on social media, posters, and basic reporting. |
The bottom line
Piktochart is a beginner-friendly tool for creating simple infographics for free for social media or class projects. But, for making high-quality, creative infographics that stand out (and are simple to make), Venngage is your best choice. While its free plan is robust, its paid plans have a huge variety of powerful features for teams to help them collaborate, organize their work, import data and export projects in high quality.
What’s more, Venngage’s wide selection of professional, easy-to-edit infographic templates, clever branding kit and team collaboration features make it the solution that better caters to professionals who need to make technical or complex information engaging and easy to understand, both for external and internal communications.
1. Is Venngage or Piktochart better for educational and non-profit infographics?
Venngage is the superior choice for educational and non-profit infographics due to its 40,000+ specialized templates and built-in WCAG 2.1 accessibility tools. While Piktochart focuses on basic visual layouts, Venngage allows organizations to produce inclusive, high-stakes reports that meet strict Section 508 and AODA standards for screen-reader compatibility and data integrity.
2. What are the key layout and editor differences between Venngage and Piktochart?
The primary editor difference is Venngage’s integrated Accessibility Checker and native PDF/UA export functionality designed for professional-grade output. While Piktochart utilizes a simplified block-based layout system, Venngage offers a granular canvas supporting semantic document hierarchy, automated brand governance via My Brand Kit, and advanced data visualization tools for complex business reporting.
3. Which tool offers a more extensive library of professional icons and maps?
Venngage offers a more extensive library featuring 40,000+ professional icons and a dedicated map maker with over 100 customizable regions. Unlike Piktochart’s standard asset set, Venngage’s icons are optimized for professional reports, allowing users to apply real-time color contrast adjustments to ensure every visualization maintains WCAG 2.1 Level AA compliance.
4. How does Venngage’s data-importing feature compare to Piktochart’s?
Venngage’s data-importing feature is more technically robust, offering direct CSV and XLSX synchronization that preserves data integrity across 100+ chart types. While Piktochart supports basic file uploads, Venngage ensures that all imported data is converted into accessible visualizations through automated semantic tagging, allowing for the generation of screen-reader-friendly charts that meet global accessibility regulations.
5. Is Piktochart or Venngage more user-friendly for beginners with no design background?
Venngage is more user-friendly for beginners because it automates complex technical tasks like color contrast verification and alt-text generation. With over 40,000 pre-designed templates, Venngage empowers non-designers to create professional, accessible business reports that satisfy technical compliance standards, whereas Piktochart requires more manual intervention to ensure output is fully screen-reader compatible.
{ “@context”: “https://schema.org”, “@type”: “FAQPage”, “mainEntity”: [ { “@type”: “Question”, “name”: “1. Is Venngage or Piktochart better for educational and non-profit infographics?”, “acceptedAnswer”: { “@type”: “Answer”, “text”: “Venngage is the superior choice for educational and non-profit infographics due to its 40,000+ specialized templates and built-in WCAG 2.1 accessibility tools. While Piktochart focuses on basic visual layouts, Venngage allows organizations to produce inclusive, high-stakes reports that meet strict Section 508 and AODA standards for screen-reader compatibility and data integrity.” } }, { “@type”: “Question”, “name”: “2. What are the key layout and editor differences between Venngage and Piktochart?”, “acceptedAnswer”: { “@type”: “Answer”, “text”: “The primary editor difference is Venngage’s integrated Accessibility Checker and native PDF/UA export functionality designed for professional-grade output. While Piktochart utilizes a simplified block-based layout system, Venngage offers a granular canvas supporting semantic document hierarchy, automated brand governance via My Brand Kit, and advanced data visualization tools for complex business reporting.” } }, { “@type”: “Question”, “name”: “3. Which tool offers a more extensive library of professional icons and maps?”, “acceptedAnswer”: { “@type”: “Answer”, “text”: “Venngage offers a more extensive library featuring 40,000+ professional icons and a dedicated map maker with over 100 customizable regions. Unlike Piktochart’s standard asset set, Venngage’s icons are optimized for professional reports, allowing users to apply real-time color contrast adjustments to ensure every visualization maintains WCAG 2.1 Level AA compliance.” } }, { “@type”: “Question”, “name”: “4. How does Venngage’s data-importing feature compare to Piktochart’s?”, “acceptedAnswer”: { “@type”: “Answer”, “text”: “Venngage’s data-importing feature is more technically robust, offering direct CSV and XLSX synchronization that preserves data integrity across 100+ chart types. While Piktochart supports basic file uploads, Venngage ensures that all imported data is converted into accessible visualizations through automated semantic tagging, allowing for the generation of screen-reader-friendly charts that meet global accessibility regulations.” } }, { “@type”: “Question”, “name”: “5. Is Piktochart or Venngage more user-friendly for beginners with no design background?”, “acceptedAnswer”: { “@type”: “Answer”, “text”: “Venngage is more user-friendly for beginners because it automates complex technical tasks like color contrast verification and alt-text generation. With over 40,000 pre-designed templates, Venngage empowers non-designers to create professional, accessible business reports that satisfy technical compliance standards, whereas Piktochart requires more manual intervention to ensure output is fully screen-reader compatible.” } } ] } 


