


Ever stared at a bunch of notes and thought, “There’s got to be an easier way to make sense of this”? Same here. That’s where graphic organizers come in, they’re simple visual tools that help organize messy ideas into something clear and easy to follow.
In this post, I’ll walk you through 19 graphic organizer examples that can help you break down complex topics, connect ideas and communicate more effectively, whether you’re teaching a class, studying for an exam or planning a project.
You’ll also find tips on how to use each one and links to customizable templates by Venngage (they’ve seriously made life easier).
Venn diagram
Ideal for comparing product features, perspectives or concepts in a competitive analysis.
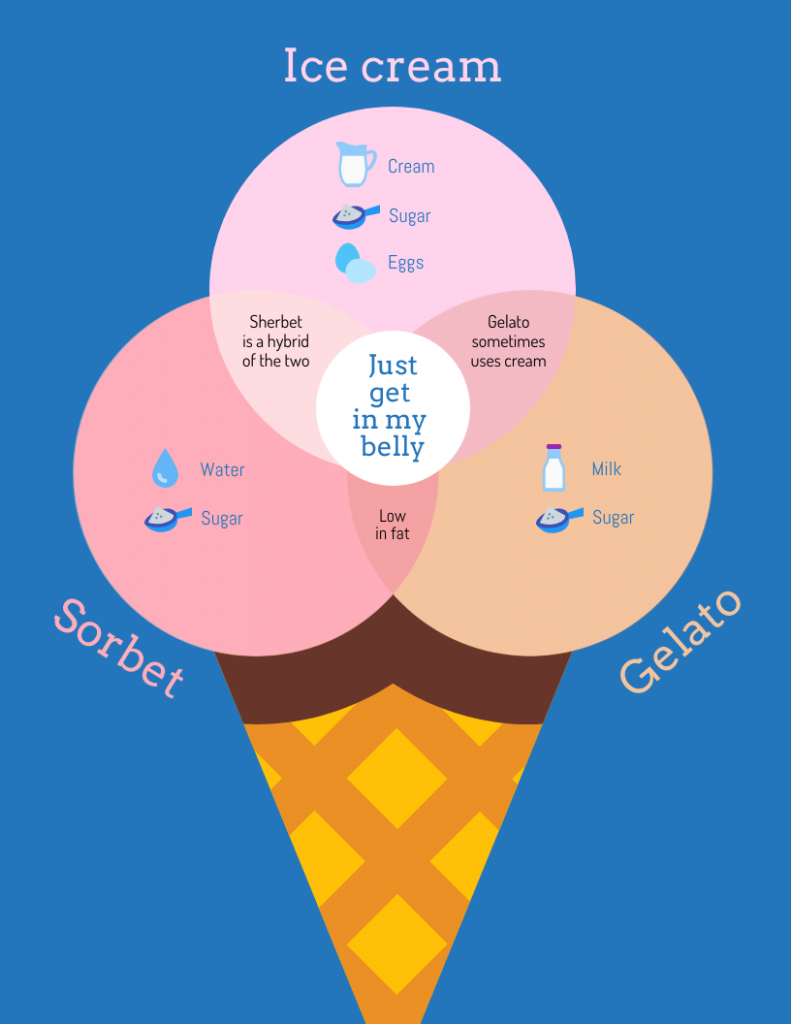
A Venn diagram is a widely used visual tool that shows the relationships between different sets of information using overlapping circles.
Each circle represents a separate category or concept, while the overlapping areas reveal similarities or shared elements. This makes Venn diagrams especially effective for comparing and contrasting ideas.
Venn diagrams are especially useful for:
- Comparing and contrasting concepts
- Highlighting similarities and differences at a glance
- Clarifying complex relationships in an easy-to-understand format
You’ll find Venn diagrams used in a variety of settings, from classrooms to boardrooms for:
- Problem-solving
- Data analysis
- Brainstorming sessions
Educators, students, and professionals alike use Venn diagrams to communicate insights clearly and make informed decisions. Explore customizable Venn diagram templates on Venngage to start visualizing your ideas in minutes.

Mind map
Best for brainstorming ideas, outlining topics or planning essays with interconnected thoughts.
A mind map, similar to a concept map in structure but more free-form, is a trusted visual tool used to brainstorm, organize, and plan ideas around a central concept. From that core idea, related thoughts branch out, helping users see how everything connects in a clear and logical way.
Educators, students and professionals rely on mind maps because they:
- Make it easier to structure complex information
- Support creative thinking and idea generation
- Improve memory retention through visual learning
Mind maps are commonly used for:
- Note-taking, essay planning, and studying in educational settings
- Project planning, strategy development and brainstorming in business contexts
Their flexible format allows you to integrate:
- Keywords to keep information focused
- Images to make concepts more memorable
- Colors to group and differentiate ideas visually

Concept map
Useful for showing relationships between ideas, especially in scientific or academic topics.
Concept maps are visual tools used to organize and represent knowledge. They’re made up of concepts, usually shown in circles or boxes, connected by labeled arrows that branch out in a hierarchical structure.
These maps help you:
- Show relationships between different ideas
- Break down complex topics into smaller, connected parts
- Visualize how concepts fit together within a bigger picture
In educational settings, concept maps are commonly used for:
- Learning and studying
- Teaching new material
- Assessing how well students understand a topic
In professional environments, they’re helpful for:
- Problem-solving and decision-making
- Explaining complex systems or workflows
By mapping out how ideas relate to one another, concept maps make it easier to understand and communicate complex information clearly and effectively.

Story map
Great for organizing plot elements—characters, setting, conflict and resolution—in narratives.
Story maps are graphic organizers designed to break down and analyze the key elements of a story or narrative. They help students identify and understand important components such as:
- Setting
- Characters
- Plot
- Conflict
- Resolution
By laying out these elements, story maps offer a clear structure for interpreting and analyzing narratives.
They’re especially useful in educational settings for:
- Literary analysis
- Reading comprehension
- Creative writing support
Story maps not only help students summarize stories but also provide a solid framework for planning and writing their own. This ensures their narratives stay organized, coherent and easy to follow.

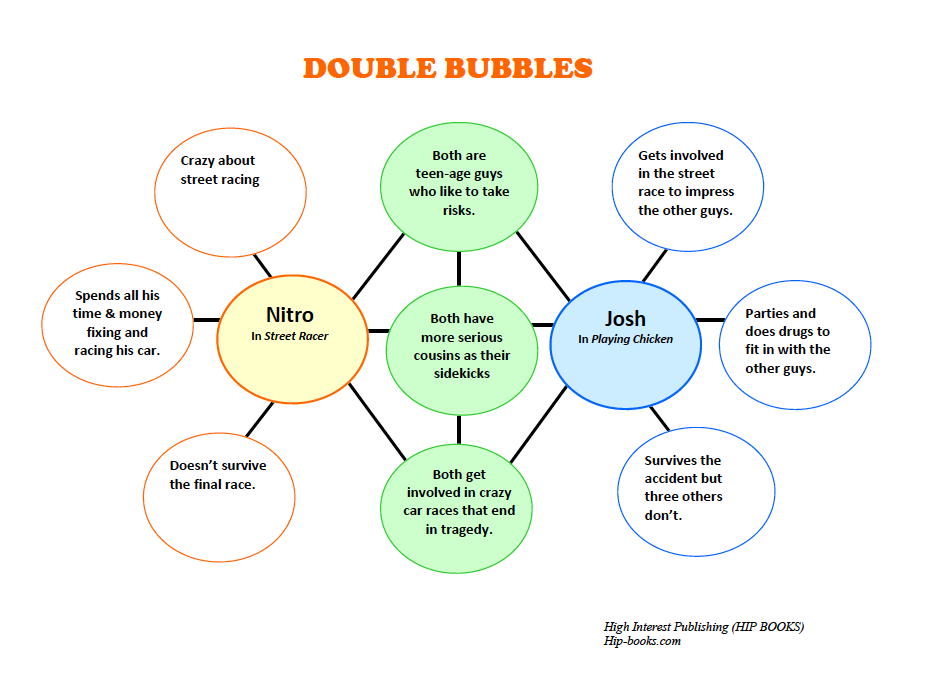
Double bubble map
The double bubble map is a helpful graphic organizer used to compare and contrast two items, concepts or events.
It includes:
- Two central bubbles for the items being compared
- Outer bubbles showing unique traits of each item
- Shared bubbles in the middle that highlight similarities
This format gives students a clear, side-by-side view of how two things are alike and different.
Double bubble maps are especially useful for:
- Critical thinking exercises
- Literary analysis
- Understanding complex or abstract topics
By visually organizing details, this tool encourages students to think deeply, spot connections and better grasp subtle differences or shared traits.

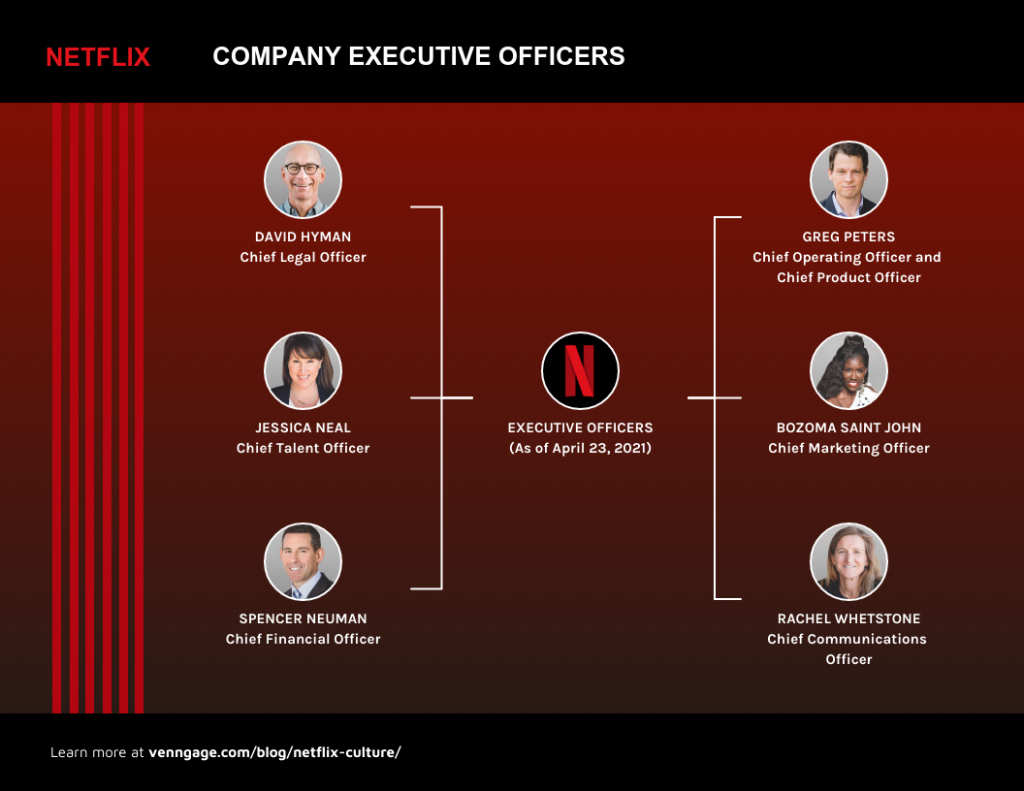
Hierarchy chart
A hierarchy chart, also known as an organizational chart, is a graphic organizer that illustrates the structure of an organization or a system. It is structured in a top-down manner, with the highest level at the top (like a CEO or the main concept) and subsequent levels representing different ranks or sub-categories.
This kind of chart helps people:
- Visualizing the chain of command within an organization
- Breakdown of complex systems into smaller
Hierarchy charts are widely used in business for depicting organizational structures, in education for breaking down concepts and in project management for outlining the structure of a project. They offer a clear, easy-to-understand representation of relationships and roles within any hierarchical system.
T-chart
Perfect for weighing pros and cons, comparing options or analyzing cause and effect.
The T-chart is a simple yet effective information diagram used to compare two aspects of a single topic. It’s shaped like the letter “T,” with a vertical line dividing the page into two columns.
Each column represents:
- A different viewpoint, characteristic or option
- A clear, side-by-side comparison for easy analysis
T-charts are commonly used in classrooms for:
- Analyzing texts
- Comparing historical events
- Listing pros and cons during decision-making
This tool helps students:
- Organize their thoughts clearly
- Explore topics from multiple perspectives
- Develop stronger analytical and critical thinking skills
Thanks to its simplicity, the T-chart works well for learners of all ages and makes complex comparisons easier to manage.

Cluster diagram
Cluster diagrams, sometimes called cloud diagrams, are helpful tools for brainstorming and organizing ideas around one main topic. You place the core idea in the center, then branch out related points to create a visual “cluster” of connected thoughts.
They’re especially useful when you want to:
- Explore how ideas relate to each other
- Break complex topics into smaller, more manageable pieces
- Organize thoughts clearly during planning or creative sessions
You’ll often see cluster diagrams used in:
- Brainstorming meetings
- Project planning
- Classrooms for writing and studying
They’re easy to use and work well for both individual work and group discussions. Because they show connections at a glance, cluster diagrams are great for sparking creativity and making sense of big-picture thinking.

Sequence chart
Ideal for mapping out step-by-step processes, workflows or historical timelines.
Sequence charts, similar to a process flowchart, are useful tools for outlining events or steps in the order they happen. They’re especially helpful when you’re working with chronological information, whether it’s historical events, story plots or scientific processes.
These charts usually include:
- Boxes or arrows to show the flow
- A clear, step-by-step structure
- Visual cues that highlight how each part connects to the next
In the classroom, sequence charts help students:
- Understand timelines or progressions
- Break down complex events into manageable pieces
- Improve recall and comprehension of ordered information
Outside of education, they’re also used for:
- Project planning
- Workflow mapping
- Process visualization
By laying everything out clearly, sequence charts make it easier to follow steps, track progress and stay organized.

Idea web graphic organizer
Great for expanding on a central idea with supporting details or categories.
Idea web graphic organizers help visually map out how different concepts connect to a central idea.
The main topic sits in the center, with lines or branches extending outward to related ideas, forming a web-like structure. This layout is especially helpful during brainstorming sessions, where it supports free thinking and creative exploration.
Common uses include:
- Essay planning
- Story writing
- Breaking down complex topics
Idea webs encourage students to:
- Think in a non-linear, flexible way
- Make connections between ideas
- Expand on a topic from multiple angles
Their open-ended format makes them a great tool for both structured assignments and open-ended thinking.

Spider map graphic organizer
Use it to break down a main concept into several subtopics or attributes.
Think of a spider map like a brainstorming visual map, it starts with one main idea in the center and everything else branches out from there like the legs of a spider. Each branch leads to a related point, detail or subtopic.
It’s a super handy way to:
- Break a big idea into smaller pieces
- Keep related thoughts grouped together
- See everything laid out at a glance
In the classroom, spider maps are great for note-taking, studying or kicking off a writing assignment. But they’re just as useful outside of school too like when you’re planning a project or sorting through ideas at work.
If you’ve got a lot of thoughts floating around, a spider map can help you organize them without overcomplicating things.

Circle map graphic organizer
Best for defining a concept by brainstorming everything you know about a single topic.
A circle map is one of my go-to tools for getting ideas out of my head and onto the page. It’s simple but surprisingly effective, especially when you’re just starting to explore a new topic.
Here’s how it works:
- You write your main idea in the center circle
- In the outer circle, you jot down related thoughts, facts or anything that helps define or explain that idea
I’ve seen teachers use circle maps to kick off class discussions or activate students’ prior knowledge. They’re great for:
- Brainstorming before writing
- Prepping for research projects
- Making abstract ideas feel more grounded and accessible
What I love most is how flexible they are. Whether you’re a student trying to understand a new concept or an educator guiding a class through early thinking, circle maps make it easy to see what you know and where you can go next.
If you’re looking for a low-pressure way to start thinking through something, give a circle map a try. It’s a small step that can really open up deeper learning.

Hexagon organizer
Hexagon organizers are dynamic graphic tools used for exploring connections and relationships between various ideas or concepts. Each hexagon represents a unique idea or piece of information, and these hexagons are arranged next to each other to demonstrate how they interconnect.
Hexagon organizers are popular in brainstorming sessions, for mapping out systems or processes, and in educational settings to help students understand the interdependent nature of certain concepts or events.

Idea wheel graphic organizer
Great for showing how supporting ideas revolve around and contribute to a main idea.
An idea wheel is one of those tools I keep coming back to when I need to unpack a topic from all angles. It’s basically a circular graphic organizer with a central idea in the middle and spokes that lead out to related thoughts or subtopics.
Here’s why it works so well:
- It helps you visually organize your thoughts
- You can easily spot gaps in your understanding
- It’s great for brainstorming essays, projects or discussions
I’ve seen teachers use idea wheels to help students explore a theme in literature or break down big questions in social studies. They’re especially helpful when you want to get a full picture of something before diving into details.
In my experience, it’s also a great prewriting tool. Instead of staring at a blank page, you’re working with a structure that naturally leads you from big ideas to smaller, supporting ones.
If you’re looking for a creative way to plan, explore or just get unstuck, idea wheels are a great place to start.

Tree chart graphic organizer
Useful for displaying categories or branching decisions, such as project planning or classification.
Tree charts are one of my favorite tools for breaking down complex ideas. They start with a main concept at the top (like the trunk of a tree) and branch out into smaller parts or details.
I’ve used them for everything from mapping out essay structures to understanding company org charts. They’re especially helpful when:
- You need to organize layered information
- You want to show relationships or hierarchies clearly
- You’re tackling topics like biology, family trees or decision-making processes
They’re simple, visual and surprisingly powerful when it comes to making sense of structured info.

Read Also: What is a Decision Tree and How to Make One [Templates + Examples]
Sequence of events chain graphic organizer
Best for outlining chronological events in stories, history or processes.
Sequence of events chain graphic organizers are simple, linear tools used to show the order of events or steps in a process. Each link in the chain represents one stage, making it easy to see how one event leads to the next.
They’re especially useful for:
- Teaching narrative structure
- Visualizing historical timelines
- Explaining scientific processes
You’ll also see them used in:
- Project planning, to outline task flow
- Workflow management, to track progress step by step
By laying out events in a clear, logical order, sequence chains help students and professionals better understand how things unfold over time.

Cause and effect map graphic organizer
Perfect for analyzing the reasons behind events and their outcomes in essays or discussions.
Cause and effect maps are one of those tools I reach for when I need to figure out why something happened or what might happen next. They lay out causes and their effects using simple arrows or lines, making it easy to trace how one event leads to another.
I’ve seen them work really well in:
- Science classes (explaining chain reactions or systems)
- History lessons (unpacking what led to major events)
- Literature discussions (understanding character choices and consequences)
They’re also super useful in real-world scenarios, like:
- Problem-solving—identifying root causes
- Decision-making—visualizing possible outcomes
If you’re trying to break down a complex situation or explain how different factors connect, a cause and effect map can make everything a whole lot clearer.

Problem-solving chart
Use it to identify a problem, explore solutions and evaluate possible outcomes.
Whenever I’m tackling a tricky problem, whether for work or a creative project, I like using a problem-solving chart. It helps break things down so I’m not overwhelmed.
The basic steps usually include:
- Defining the problem
- Looking at possible causes
- Brainstorming solutions
- Choosing what’s most realistic
I’ve seen teachers use these with students, and they’re just as useful in team meetings or solo planning sessions. They keep you focused, make sure you’re thinking things through, and help you land on solutions that actually work.

Organizational chart graphic organizer
Ideal for visualizing team structures, company hierarchies or project roles.
I’ve always found organizational charts helpful when I need to quickly understand how a company or team is structured. They show who reports to whom and how different roles connect.
Here’s what they typically include:
- Top-level roles (like executives or department heads)
- Branches showing teams or individual positions underneath
- Lines that map out reporting relationships and communication flow
They’re super useful in:
- Business settings, to clarify hierarchy and roles
- Education, for teaching management and organizational behavior

Related: 40+ Charts & Graphs Examples To Unlock Insights
Frequently asked questions about graphic organizers
How do I create my own graphic organizer step by step?
It’s easier than you think, just follow these three steps:
- Choose a template that fits your purpose (compare/contrast, sequencing, brainstorming, etc.).
- Customize the labels, shapes and colors to match your topic or lesson.
- Export or share your graphic organizer with a click—print it, present it, or embed it online.
Need help getting started? Try one of our ready-to-use chart and diagram templates to create a professional design in minutes.
Which graphic organizer works best for comparing similarities and differences?
Go with a Venn diagram for simple comparisons or use a double-bubble map for more detailed analysis.
For example, you can use a Venn diagram like this for topics like the differences between ice cream, gelato and sorbet:
Or, you can use double-bubbles for literary comparisons, like character traits or themes.
How can graphic organizers support writing and brainstorming?
Graphic organizers help clarify ideas and speed up the writing process by turning abstract thoughts into visual structure. Tools like Venngage’s mind map templates spark new angles by branching ideas from a central topic, while story maps guide narrative flow from beginning to end.
These visual aids reduce cognitive load and help writers organize their thoughts more efficiently. As one Venngage user put it, “Mind maps have been a game-changer—my students planned their essays in just 5 minutes and felt way more confident starting their drafts.”
How do graphic organizers help students with learning or cognitive disabilities?
Graphic organizers support Universal Design for Learning (UDL) by presenting information through visual chunks, color-coded branches and clean, simplified layouts.
These design elements help students with learning or cognitive disabilities, such as dyslexia, stay focused, understand material more easily, and improve retention. Research indicates that visual learning is 83% more effective than using text alone.
Venngage’s accessible templates are built with these UDL principles in mind, offering dyslexia-friendly, inclusive formats optimized for diverse learners.
Bottom line
Graphic organizers play a crucial role in learning and information processing due to their ability to visually structure and simplify complex information.
By leveraging the power of graphic organizers, you can transform the way information is absorbed and presented.
With Venngage’s user-friendly platform, the creation of your own custom graphic organizers is just a few clicks away.
Sign up on Venngage today and gain access to a treasure trove of graphic organizer templates, ready to be tailored to your educational needs.


