
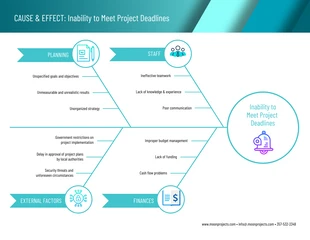
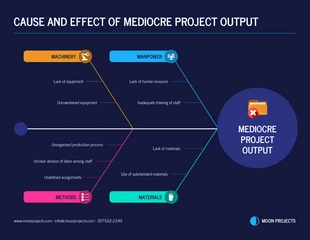
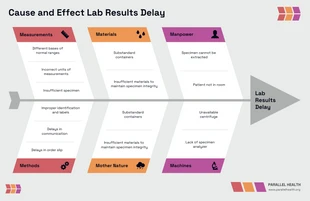
Project Management Cause and Effect Diagram Template
Use this cause and effect diagram project management template for your team’s benefit.

 100% customizable templates
 Millions of photos, icons, charts and graphics
 AI-powered editing features
 Effortlessly share, download, embed and publish
 Easily generate QR codes for your designs
- Design stylemodern
- Colorsdark
- SizeLetter (11 x 8.5 in)
- File typePNG, PDF, PowerPoint
- Planpremium
A cause and effect diagram is a tool that is used to identify, organize, and display the potential causes of a particular problem or event. The diagram is also known as a fishbone diagram because of its resemblance to the skeleton of a fish. The cause and effect diagram can be used to identify the root causes of problems or events. It is also useful for brainstorming and identifying potential solutions to problems. To create a cause and effect diagram, you need to first identify the problem or event that you want to analyze, identify the major categories of causes that contribute to the problem or event, for each major category, identify the specific causes that contribute to the problem or event, and, lastly, display the information in a cause and effect diagram. When creating a cause and effect diagram, it is important to keep in mind that the causes can be either direct or indirect. Direct causes are those that directly lead to the problem or event. Indirect causes are those that contribute to the problem or event but are not directly responsible
Related Diagram Templates
fishbone diagrams
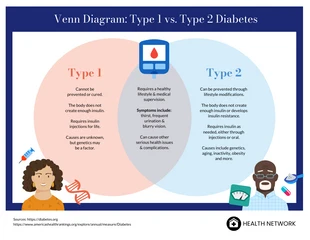
venn diagram diagrams
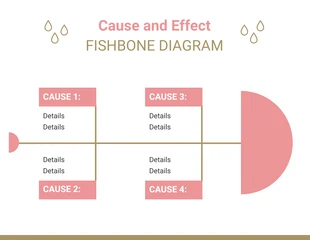
fishbone diagrams

venn diagram diagrams
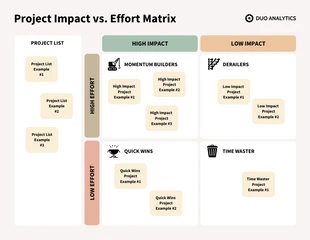
impact effort matrix diagrams
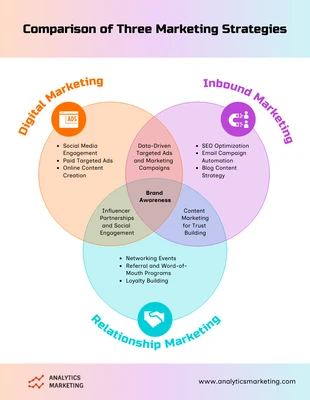
venn diagram diagrams
fishbone diagrams
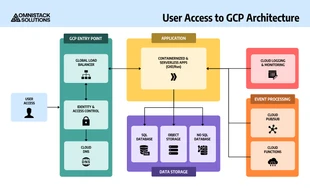
architecture diagrams

venn diagram diagrams
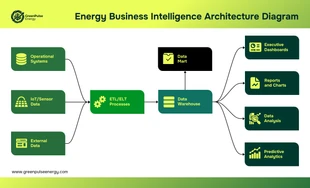
architecture diagrams
fishbone diagrams
architecture diagrams