


Want to better understand and streamline your business processes? Look no further than workflow charts.
These types of diagrams offer a visual representation of the steps involved in a workflow from start to finish, providing a clear overview of the entire process and highlighting areas that can be improved and optimized. And while getting started may seem daunting at first, with the right approach, you’ll be able to create effective workflow diagrams that can help you achieve your goals.
So today, I’ll explore the basics of workflow charts, their benefits and the steps involved in creating them. Whether you’re looking to improve a current process or interested in starting a new project, this guide will provide you with the tools you need — including a ton of handy flowchart templates you can customize to your own liking too.
What is a workflow diagram?
A workflow chart, also known as a (process) flowchart or process / workflow diagram, is a visual representation of a workflow — i.e. a business process requiring a series of steps and decision points involved to achieve a particular goal.
These types of charts are used to illustrate the sequence of actions required to complete a task or a project. Here’s one example of a workflow chart template:

You’ll notice the above workflow chart uses different shapes for certain steps. That’s not just a stylistic choice!
Workflow charts typically use standardized symbols to represent different elements of a process, such as decision points, actions, inputs and outputs.
Arrows or lines are used to connect the different shapes, indicating the direction of the flow and the order in which the steps need to be performed. Read more about the different symbols used in flowcharts here.
That being said, you don’t *have* to limit yourself. Even if every step is represented with, say, a rectangle (as shown below), it still counts as a workflow chart — so long as the steps in a workflow are being described.

It’s easy to see how a workflow chart like the above can be customized to visualize any workflow or task.
That’s why this kind of business process mapping is frequently used in a variety of industries and fields, such as software development, project management, manufacturing, sales, human resources and more.
History of workflow diagrams
Origins of workflow diagrams
Workflow diagrams started in the early 1900s when engineers looked for better ways to understand and improve how work was done in factories. They used simple flowcharts to map each step in a process so it was easier to spot delays, unnecessary steps and inefficiencies.
One early example is the flow process chart, introduced in 1921 by industrial engineers Frank and Lillian Gilbreth. Their work helped show how visual diagrams could improve productivity and make processes easier to analyze. IBM explains this idea well in what a flowchart is and how it works.
These early diagrams became the starting point for modern workflow charts used in business today.
Evolution in business & technology
As businesses grew and technology advanced, workflow diagrams became more useful for documenting complex processes. In the 1940s and 1950s, engineers began using flowcharts to plan computer programs before writing the actual code.
This made it easier to understand how systems worked step by step. Over time, organizations also created standard symbols so teams could read and interpret diagrams more consistently. You can learn more about how flowcharts are used in process improvement from the American Society for Quality’s flowchart guide.
How they became a standard in process management
By the late 20th century, workflow diagrams were widely used to organize and improve business processes. Companies used them to train employees, document procedures and identify ways to make work more efficient.
In the early 2000s, Business Process Model and Notation (BPMN) introduced a standardized way to visualize complex business workflows. This made it easier for both technical and non-technical teams to understand how processes worked.
Today, workflow diagrams are commonly used across industries to analyze processes, improve efficiency and help teams collaborate more effectively.
Workflow diagram examples by industry
Looking for some examples of workflow charts?
There are tons of ways you can use these handy diagrams to relay or revisit your business processes.
I’ve rounded up a few options and workflow examples below you can use as your starting point, no matter what your workflow looks like.
Workflow diagrams for software development

When it comes to software development, coding and other tech tasks, workflow charts are a super helpful tool that can help developers organize their work and ensure each step is completed accurately and efficiently.
The templates above and below are perfect for just that.

Workflow diagrams for project management
By providing a visual representation of the project workflow, workflow charts are an invaluable tool when it comes to project management.

In addition to helping stakeholders understand and improve task sequences and how they relate to each other, these charts help project managers allocate resources more effectively — a vital aspect of proper project development.
These are just a few of the templates you can customize instantly for all your project management needs. Check out the diagram templates page for more.

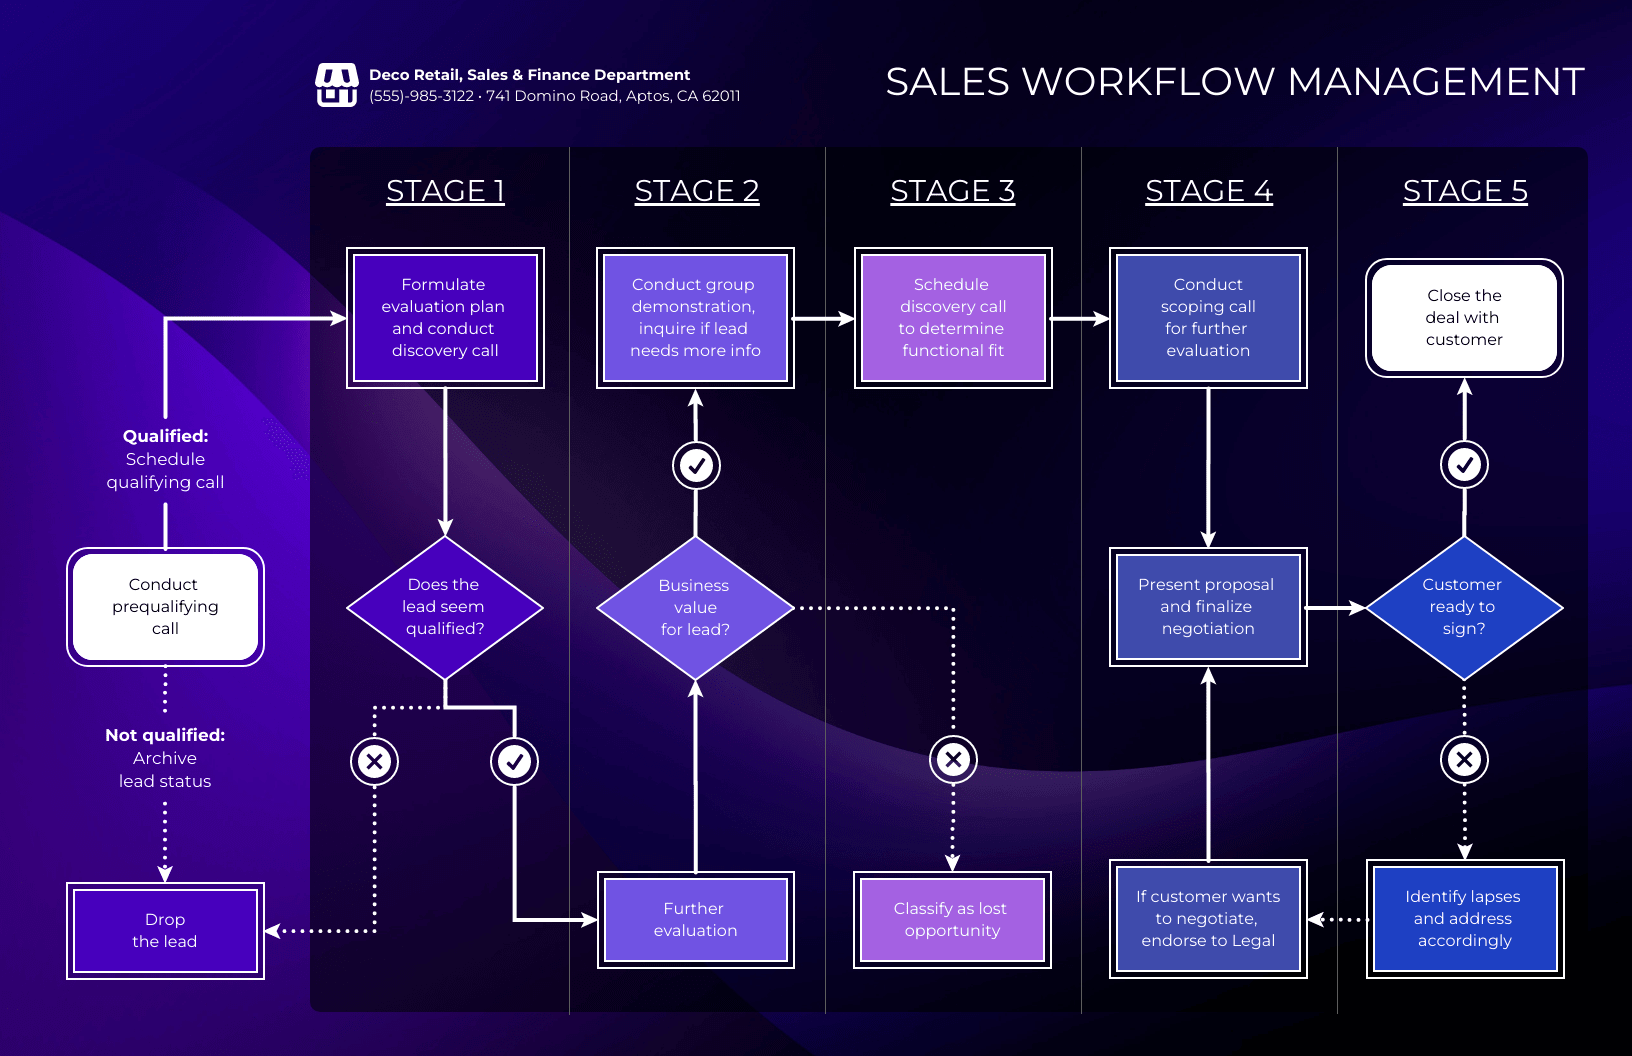
Workflow diagrams for sales teams
By mapping out the steps involved, workflow charts allow businesses to make data-driven decisions to optimize their sales process, resulting in increased productivity, reduced costs, and improved customer satisfaction.

Workflow charts can also help sales teams stay on track by providing a visual representation of their progress and highlighting areas that require attention. This helps ensure that nothing falls through the cracks and enables sales teams to work more efficiently and effectively, so you can stay ahead of the competition.

Related: How to Create a Sales Process Flowchart in 5 Steps
Workflow diagrams for human resources (HR)
Finally, workflow charts can help streamline complex human resources (HR) procedures, such as recruitment, employee onboarding, performance management and benefits enrollment.
They can also help to standardize HR procedures, making them consistent and repeatable, reducing errors and improving the overall quality of HR processes.

Plus, workflow charts help professionals in these roles communicate more effectively with employees, as they provide a clear understanding of what is expected from them at each step. This leads to increased productivity, better decision-making, and ultimately a more efficient HR department.

Basic workflow chart symbols (with cheat sheet)
When creating a workflow chart, a few core symbols appear again and again. These shapes help readers quickly understand what’s happening in a process without reading long explanations. Here’s a quick cheat sheet for the most common ones:
| Symbol | Name | Meaning | When to use | Common mistake |
|---|---|---|---|---|
| Oval | Start/End | Indicates where the workflow begins or finishes | Use at the very beginning and end of a process | Adding too many start/end points in a single workflow |
| Rectangle | Process | Represents a specific action, task, or step in the workflow | Use for any step where work actually happens | Using it for decisions instead of actions |
| Diamond | Decision | Shows a point where a yes/no or conditional choice is made | Use when the workflow branches into different paths | Forgetting to label decision branches (Yes/No) |
| Arrow | Flowline / Arrow | Shows the direction the workflow moves from one step to the next | Use to connect symbols and guide the sequence | Drawing arrows that cross over each other and clutter the chart |
| Parallelogram | Input/Output | Represents information entering or leaving the process | Use when data is received, entered, or displayed | Using it for internal process steps instead of data actions |
| Circle | Connector | Links different parts of a workflow, often across pages or complex diagrams | Use to keep charts clean when lines would otherwise cross | Overusing connectors instead of simplifying the chart |
What is the purpose of a workflow diagram?
By visually representing the steps involved in a process or task, workflow charts help ensure tasks are completed efficiently and effectively. This is particularly important when it comes to…
- Planning and Design: Workflow charts are great for planning and designing processes before they’re put in motion. By mapping out each step and any potential decision points involved, these charts allow you to create the most efficient workflow possible, and troubleshoot aspects that could be improved
- Communication: Workflow charts make it easy to communicate processes or tasks to others by offering a visual representation of the steps involved. This is particularly important for employee training, as it helps folks better understand not only what needs to be done, but when and how.
- Standardization: Workflow charts are often used to standardize processes across an organization. By providing a clear, consistent visual representation of a process, these charts ensure everyone is up to speed so that tasks are completed the same way every time.
- Process Improvement: Workflow charts help identify areas for process improvement. With a glance, stakeholders can identify bottlenecks, inefficiencies, or areas where errors are likely to occur, and work to improve the process accordingly. This is especially useful when tackling problems with multiple interconnected factors, often referred to as ‘wicked problems,’ where a simple solution is elusive.
Now you might be thinking: that’s good and all, but I don’t want to spend hours creating one.
No sweat! I’ll describe exactly how you can do just that.
How to make a workflow diagram (step-by-step guide)
Now that you know the basics, you’re nearly ready to create workflow charts yourself. Below, I’ve outlined the process of making a workflow chart at a high level.
Step 1 – Identify the process & goals
Begin by defining the specific process or workflow that you want to chart. This could be any process, whether it’s a business, manufacturing, or another type of procedure. Clearly outline the goals of creating the diagram—what do you want to achieve? Understanding the purpose will help you structure the diagram effectively.
Step 2 – Gather workflow information
Next, gather all the relevant information needed to accurately map out the workflow. Consider the process as a whole and any specifics about the steps involved. Take note of the necessary details such as key actions, decision points, and participants. This will form the foundation of your diagram.
Step 3 – Choose the right diagram type
Think about your audience and the purpose of the diagram. Who will be using this chart, and what information do they need to see? The answers will guide you in selecting the most appropriate diagram type (e.g., flowchart, BPMN, or process map) and help you decide on the level of detail required.
Step 4 – Map out the steps & decision points
Identify and outline the key steps in the process. Consider any decision points that might create branches in the workflow. Stay focused on the critical steps that ensure the process is completed successfully. This will help you design a clear, concise flow of activities that are easy to follow.
Step 5 – Select symbols & arrange the Ffow
Choose the correct symbols to represent the different steps and decision points in your workflow. Each symbol should have a clear meaning, like a rectangle for actions or a diamond for decisions. Arrange these elements in the order that the steps are executed, making sure the flow is logical and easy to understand.
Step 6 – Review & optimize the diagram
Once you’ve mapped out the entire process, review the diagram to ensure accuracy and clarity. Look for areas that may need revision, such as unclear steps or missing information. Optimize the diagram by simplifying where possible and making sure it is easy for others to comprehend.
Step 7 – Use a workflow diagram maker (with templates)
To streamline the creation process, use a tool like Venngage’s Diagram Maker. The platform offers ready-made Smart templates that allow you to create a professional workflow diagram in minutes. Templates simplify the design process and make it easier to modify or update the chart as needed.

4 types of workflow diagrams
Process flowchart (process flow diagram)

A process flow diagram (PFD) is a visual representation of a process or a system. It represents the flow of materials, information or other resources through various stages of a process or system.
In other words, it’s exactly what we’ve already been talking about.
Keep in mind that the contents of your business process diagram should be chosen based on:
- The information you need to map (i.e. the steps, people, systems, data, inputs, outputs, decisions or actions involved)
- The purpose of the diagram
- The audience you’re communicating with
For example, the workflow chart below uses language that those familiar with data management systems will understand.

Swimlane diagrams

Swimlane diagrams — also known as process flow diagrams or cross-functional diagrams — are a type of workflow chart that divides the steps involved in a process into categories, or swimlanes. These categories represent the groups or individuals that perform each step in the process.
Unlike a simple flowchart, swimlane charts depict who is in charge of each step. This means they’re great for highlighting the process steps and responsibilities assigned to different employees or departments, and seeing how everything works together.
You can see this represented in the swimlane diagram template below.

This example shows how the payroll workflow is divided amongst various roles, and how those roles interact. It’s not hard to see why these diagrams are key for streamlining project management and onboarding, or illustrating internal workflows and documenting business processes.
Related: Swimlane Process Maps: How do They Work Together to Improve Business Processes?
Business process modeling notation (BPMN) chart
Business Process Modeling Notation, otherwise known as BPMN, is a workflow chart that models the steps of a business process.
Once again, BPMN visually depicts detailed sequences of business activities and information flows for a process to be complete — however these types of diagrams follow specific rules made by the Object Management Group.
Suppliers inputs processes outputs customers (SIPOC) chart

Suppliers Inputs Processes Outputs Customers (SIPOC) charts offer a visual overview of the key components of a business process or system. Specifically, they focus on the inputs and outputs of a process, as well as the stakeholders involved.
In mapping out flows and identifying collaborators according to supplier, input, process, output and customer, these charts usually end up looking like a mix between a flowchart and a swim lane diagram. They’re most frequently used to map out manufacturing processes.
Related: 7 Types of Flowcharts and How to Choose the Right One
Workflow diagram in Word vs Excel vs PowerPoint vs Google tools
Different tools work better depending on how the workflow chart will be used. Some are better for documentation, others for presentations or team collaboration. Here’s a quick comparison to help you decide which tool fits your workflow.
| Tool | Best for | Pros | Cons | Collaboration | Best output |
|---|---|---|---|---|---|
| Microsoft Word | SOPs or process documentation where the workflow chart sits inside a written document |
Easy to keep charts and explanations together. Familiar interface for most teams. Exports cleanly to PDF. |
Connector alignment can get fiddly. Large diagrams become difficult to manage. |
Good with OneDrive or SharePoint, but multi-editor diagrams can feel clunky | SOPs, policy documents, printable PDFs |
| Microsoft Excel | Simple workflows where grid alignment or step lists help organize the process |
Grid helps with alignment. Steps and data can live in the same sheet. Works well for structured print layouts. |
Not designed for diagrams. Connectors can be frustrating. Workflows can become messy across cells. |
Decent with OneDrive, though diagram editing isn’t as smooth as slide tools | Printouts, internal working documents, lightweight operations tracking |
| Microsoft PowerPoint | Presentations or quick workflow visuals for meetings and workshops |
Fast to build diagrams. Strong shape and connector tools. Good layout control. |
Not ideal for long-form documentation. File versioning can get messy across teams. |
Good co-authoring support and smoother diagram editing than Word | Presentations, workshops, stakeholder reviews |
| Google Slides / Google Drawings | Lightweight, shareable workflows for teams using Google Workspace |
Real-time collaboration. Easy sharing via links. No software installation required. |
Formatting precision can be limited. Complex diagrams become harder to manage. |
Excellent real-time collaboration with comments and simple sharing | Team alignment docs, quick training visuals, shareable diagrams |
| Online diagram tools (template-based) | Cross-functional workflows or processes updated frequently |
Purpose-built diagram tools. Templates and swimlanes keep charts clean. Better for complex workflows. |
Some templates or exports may be gated. Learning curve varies by tool. |
Usually excellent collaboration with comments, sharing, and version history | Reusable templates, process libraries, onboarding materials, exports (PNG, PDF, PPT) |
How to create a workflow diagram in Venngage
You don’t have to be a design whiz to produce a workflow chart that looks great and gets the job done. With Venngage’s Diagram Maker and extensive library of professionally-designed Smart templates, you can get started right away.

- Start by signing up for a free Venngage account.
- Select a chart template that matches your use case.Click on the “Flowcharts” tab on Venngage’s template page to see a range of options you can choose from. Then, click the “Create” button on the template.
- Swap in your desired text, icons and colors to make it your own. Then, use the drag-and-drop editor to map out the process with symbols and directional cues. (Our diagram templates are “Smart” — meaning you can add, edit, delete or drag nodes, texts and icons around in one click, and the nodes will automatically adjust to match.)
- Once you’re happy with your design, share the link publicly for free or upgrade to a paid plan to download.
Upgrading gives you the ability to download your flowchart as a PNG, PNG HD, PDF, Interactive PDF or PowerPoint file. And with a Business Plan, get access to other premium features like real-time Team Collaboration, and automated branding via My Brand Kit.
Workflow diagram FAQ
What are the four main flowchart types?
The four types of flowcharts are:
- Process flowcharts
- Workflow charts
- Swimlane charts
- Data flowcharts
What are the three basic components of a workflow diagram?
The three basic components of a workflow diagram are:
- Activities/Steps: The individual tasks or steps that need to be completed as part of the workflow. Each step should be clearly defined and labeled.
- Decisions/Branching: Points in the workflow where a decision is made or where the process branches into different paths. Each decision should be clearly labeled with the possible outcomes.
- Connectors/Arrows: Lines or arrows that connect the activities and decisions in the workflow diagram. These show the sequence and direction of flow.
Is a workflow chart and a workflow diagram the same?
Yes, a workflow chart and a workflow diagram are essentially the same. Both terms refer to a visual representation of a process or workflow, illustrating the sequence of steps and decision points needed to achieve a specific goal.
What are the four main types of workflow diagrams?
The four main types of workflow diagrams are:
- Process Flow Diagrams (PFD): Visual representation of a process showing the flow of materials, information, or resources.
- Swimlane Diagrams: These diagrams organize the steps of a process into categories or “lanes” representing different groups or individuals responsible for each step.
- BPMN Diagrams: Business Process Model and Notation diagrams follow specific standards for modeling business process flows.
- SIPOC Diagrams: Focus on the key components of a business process, such as suppliers, inputs, processes, outputs, and customers.
What is the best tool to create a workflow diagram?
There are several tools available to create workflow diagrams, with some of the best options being Venngage’s Diagram Maker, Lucidchart, and Microsoft Visio. Venngage, for example, provides customizable templates and an easy-to-use interface for quick creation of professional diagrams.
Can AI generate workflow diagrams?
Yes, AI can generate workflow diagrams using advanced diagramming tools that incorporate AI to automate aspects of the design process. These tools can suggest layouts, symbols, and even entire workflows based on user inputs and data, saving time and effort in diagram creation.


