


Consulting reports play a big role in helping consultants turn insights into actionable plans. They break down where a company stands, pinpoint areas for growth, and provide clear recommendations to move forward. For consultants, these reports are key to connecting their expertise with their client’s needs.
But starting a report from scratch every time? That can be a lot of extra work. That’s where consulting report templates come in. They make the process faster and easier while keeping your reports professional, consistent, and easy to follow—no matter your industry or focus.
In this post, I’ll share 25+ consulting report templates that can save you time and help you create impactful reports. Plus, they’re all customizable with Venngage’s report creator. Take a look and find the perfect templates for your needs, or explore the full collection in one place.
What is a consulting report?
A consulting report presents a consultant’s analysis, findings and recommendations to help a client solve a problem, tackle a challenge or seize an opportunity. It’s designed by consulting firms to provide clear, actionable solutions tailored to the client’s needs.
Typically, a consulting report includes:
- Scope: What the report aims to achieve.
- Methodology: How the data and insights were gathered.
- Analysis: Key findings and patterns.
- Recommendations: Practical steps to move forward.
Strategic reports give clients the insights they need to make informed decisions. They’re customized to each client’s goals and often include industry research and best practices. For example, a competitive analysis report could highlight a company’s competitors’ strengths and weaknesses to help guide strategy.

For consultants, these reports are a crucial way to turn expertise into results, especially for clients who don’t have the time or resources to dig into the details themselves.
Different types of consulting reports:
Here are some common types of consulting reports that consultants often use:
- Project status report
- Social media reports (current metrics vs. goals)
- Client’s supply chain model vs. industry leader’s supply chain model
- Competitor analysis or industry report
- Sample business plan
- Cybersecurity project management report
Why use a consulting report template?
Using a consulting report template helps you organize your findings, analysis and recommendations in a clear way. It saves you time by offering a ready-made format that you can easily customize.
Plus, with visuals like icons and charts and data visualizations, your report becomes more engaging and easier to digest. Check out this consulting report template below:

A consulting report template can also spark design ideas, showing you the best ways to visualize specific data or information. For example, check out this project-specific consulting report template:

In the template above, you’ll notice how checkmark icons are used to show things like project progress, schedule, scope, and budget. It’s a simple way to make key details stand out and easy for clients to understand.
Like some more inspiration before you pick a template? Check out this quick video:
What are the key elements of a consulting report?
A consulting report typically includes several key elements that help organize the findings and recommendations clearly:
- Executive Summary: A brief overview of the main findings and recommendations.
- Introduction: Explains the purpose of the report, including the project goals and scope.
- Methodology: Outlines the approach used to gather data and conduct analysis.
- Findings: Presents the insights and key observations from the research.
- Analysis: Breaks down the findings, connecting them to the client’s goals and challenges.
- Recommendations: Offers practical steps for addressing the issues and improving outcomes.
- Conclusion: Summarizes the report’s key points and highlights the impact of the recommendations.
These elements provide a clear structure for presenting actionable insights, making it easier for clients to understand the consultant’s recommendations and take informed action. You can use agentic AI tools to extract key information from recent meetings, ensuring your proposal is grounded in actual discussions.
Top 25 Consulting Report Templates for Every Need
Let’s take a look at these types of consulting report templates + design tips for each:
Project status report templates
Keeping your clients in the loop is essential. Regular project status reports help keep everyone updated, flag any issues, and outline what’s still on the to-do list. It’s a great way to maintain clear communication and build trust with your client.
Pro Tip: When choosing a project status report template, think about how often you’ll be reporting—whether it’s weekly, monthly or quarterly.
This Project Status Report Template has everything you need, broken down into easy-to-digest sections. The icon checkmark chart makes it simple for your client to see if the project is:
- On track
- Experiencing scope creep
- On budget

Alternatively, this project report status template uses a straightforward chart with checkboxes to display the overall project status. The focus is on timelines—showing when milestones should be completed and the revised overall completion date.

It’s ideal for a quick update with minimal explanation. The title page is simple, customizable, and can easily be adapted to any industry.
Progress report template
A progress report template is perfect for highlighting what you’ve accomplished so far. Using bullet points makes it easy for your client to see the progress at a glance and reassure them that things are moving forward.
When multiple people are involved in a project, it’s easy for things to get disorganized. For example, this monthly progress report template clearly assigns tasks to everyone so everyone knows what they’re responsible for.

Pro Tip: With Venngage’s team features, you can easily share your project status reports with clients and other stakeholders. Just email it directly or share a private link. And with the Venngage for Business plan, you can update the report in real time and keep everyone in the loop.

Social media report templates
Marketing consultants often use social media reports to track progress, but presenting the data in a way that’s easy for clients to understand can be tricky. Here are two tips for making a better social media report:
- Focus on key stats that matter most.
- Choose a simple, easy-to-read format with charts or graphs.
This social media report template uses icons to highlight key stats:

Icons help convey the message—such as a funnel for conversion rates and a dollar sign for savings. Use colorful icons for creative industries like marketing, or simple line icons for more formal fields like management consulting.
Here’s another version of a social media report template, with a different color scheme and icons:

The next social media report template focuses entirely on stats—no words needed. Red/green icons show whether the stats are positive or negative at a glance. The report is segmented by channel, with pie charts clearly displaying user breakdowns and growth opportunities. Your client will appreciate the clean, straightforward overview.

Here’s another version of the same template, with a new color scheme:

The social media report template above can work for any industry, not just marketing. You can easily change the content by clicking on text boxes, swap icons or adjust the color scheme with just one click. And if you need more detail, you can add pages or delete elements as needed. It’s all customizable and no hassle with the Venngage report maker.
Recommendation report templates
After hours of problem-solving, it’s time to present your findings. A clear, concise recommendation report is key to communicating your solutions effectively.
This one-page action plan report template helps you outline growth goals or any other recommendations at a glance:

With a clean, organized layout—title page, introduction, table of contents, and divider pages—this recommendation report template below helps your client quickly digest your ideas.

This recommendation report example is simple but eye-catching. The background image and colors can easily be changed using our online editor and free stock photo library.

Perfect for any industry, this template can be easily adjusted to fit your client’s needs. Whether it’s real estate or another sector, you can swap icons, text, and images to make the report fully tailored.

Customize the report title page to match your industry, or use the third page of the template below to present your recommendations:

Alternatively, create a more visually engaging recommendation report with this case study template. With bold subheadings and icons, it organizes your recommendations clearly and highlights key results, helping your client quickly grasp the expected outcomes and takeaways.

Business case study templates
Consultants can use business case studies to showcase how they’ve helped clients achieve growth, improve marketing, or solve challenges. These case studies not only highlight past successes but also demonstrate the value of hiring an independent consultant, ultimately helping convert potential clients into new projects.
Here are two key ways to use business case studies:
- Present them as “proof” in your portfolio to attract new clients.
- Share them through your blog, newsletter, eBook or social media to establish thought leadership.
The business case study template below lays out the essential components including:
- A problem a company (or sometimes a specific decision maker) needs to solve
- Context of the problem
- Available solutions
- Why the winning solution was picked
- Results of using this solution, with data to back it up

Design wise, the template above enhances the standard case study with bold colors and graphics, using a contrasting navy background and hot pink text to highlight key information, such as the title and critical stats.
On the other hand, the business report template below effectively establishes the consultant’s authority.
It includes:
- Client recommendations
- A customizable bar graph of results
- Icons and subheadings explaining top deliverables
- Clear context on the title page, presenting the need for services
- Immediate results on the first page

The below consulting report template works as both a business report and presentation. It also makes great use of different types of charts and graphs to present information:

Lastly, this case study template uses contrasting font colors and icons to draw attention to key results, making it easy for clients to quickly identify important takeaways and data points. The visual elements help highlight the impact of your solutions, ensuring that your results stand out.

Industry analysis templates
Industry analysis reports help clients understand the future of their business.
Consultants create an industry analysis to collect and analyze industry data. Clients can then create a plan for their business’s future.
Industry analysis reports can focus on any of these topics:
- The value competitors provide to customers
- Who competitor customers are
- New competitor products/services
- How to edge out potential new competitors in the future
- How to make sure business strategy aligns with company culture/values into the future
- Skills new recruits need to have for the business to remain competitive
Here’s an example of an industry analysis template that focuses on industry trends:

This consulting report template uses bold, illustrated icons and a vibrant color palette to say that its contents are anything but ordinary.

Use color psychology to communicate an idea. For example, yellow is associated with confidence and creativity. Here’s a color psychology cheat sheet, to help you pick the right shades:
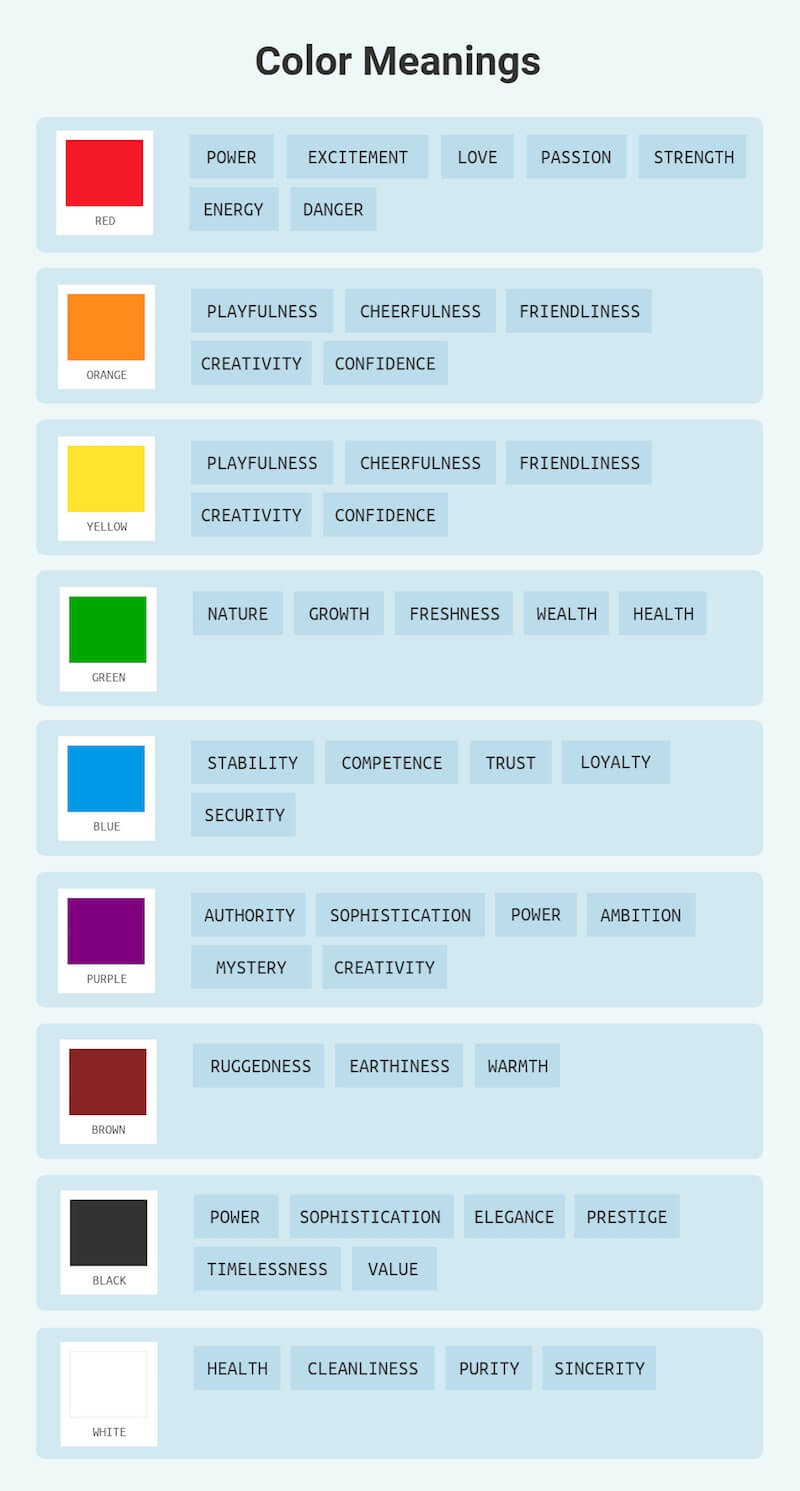
Our blog post on brand colors delves even deeper into how to pick and use colors for your business.
Here’s another example of an industry analysis report that uses a bold color palette:

It nicely contrasts warm pink (“energy”) with blue (“stability”).

Meanwhile, the below industry analysis report plays it safe with black (“prestige”) and hints of blue “trust”):

Make your charts and graphs really pop by putting them in a contrasting color to the dominant color. Above, the green charts really pop against the gray and black color scheme. Also, using different types of charts (horizontal vs. vertical stacked bar charts) keeps the reader interested.
Competitor analysis report templates
A competitor analysis report zeroes in on specific competitors rather than offering a broad market overview. For consultants, the real challenge isn’t gathering the data—it’s presenting it in a way that keeps the client engaged.
Look at how this competitor analysis report template segments and visualizes key research:

The competitor analysis report template abmakes it easy to share key insights:
- Page 3: Industry stats stand out in blue text boxes with enlarged figures.
- Page 4: Website analytics are clearly listed, with bolded stats for emphasis.
- Page 5: Social media stats use bold icons and big numbers, while the SWOT analysis is neatly organized in columns.
The result: a report your client will actually read (and understand).
Try different font sizes and weights (like bold) to highlight important data. Use subheaders and colored text boxes to section off data and make it easy to scan. Marketing consultants can use this template, but it can be adapted for any industry.
Here’s the same competitor analysis report, but with a different color scheme:

The next competitor analysis report template does double duty as a report and presentation:

Consultants can enhance their reports by using a graphic SWOT analysis to clearly highlight opportunities and threats. Icons make key points easier to understand.
Check out our SWOT analysis template below or use our our online SWOT analysis maker tool to customize it to your needs.

Change the stock photos in any of our templates. Our in-editor photo library has thousands of high-quality, professional stock photos that are completely free to use. Search by keyword (ex: “healthcare” or “marketing”) and click to add your choices to the report. Or, upload your own photos.
How to write a consulting report
Consulting reports can cover different topics, but they usually follow a similar structure. Sticking to this format helps keep things organized, makes the information flow naturally and ensures the client stays engaged and isn’t left feeling confused.
Here’s how to write a consulting report:
- Executive Summary: Start with a brief overview of the main findings, recommendations, and conclusions. It gives your client a quick idea of the report’s key points.
- Introduction: Introduce the problem you’re solving, the goals of the project, and what you aim to achieve. This gives the client context and helps set expectations.
- Methodology: Explain how you collected data and did your analysis. This shows your client that your findings are based on solid research.
- Findings: Present the results of your research clearly. Focus on the key insights that are most relevant to your client.
- Analysis: Explain what your findings mean for the client’s goals. Use visuals to make your analysis easy to understand.
- Recommendations: Provide clear, actionable steps the client can take. Make sure they’re practical and tailored to their needs.
- Conclusion: Wrap up with a summary of the key points and reinforce the next steps. Let your client know what they should do next.
- Appendix (optional): Include any supporting documentation like references, bibliography, photographs etc. Basically, anything that supports your recommendations.
Check out this template below. It includes all the essential sections you’ll need, making it easier to organize your ideas and present your findings in a clear, professional way.

FAQs about consulting reports
What is an executive summary?
An executive summary is a concise overview of a larger report, proposal, or document. It highlights the key points, recommendations, and conclusions, allowing the reader to grasp the main ideas quickly without diving into the full content. Executive summaries are especially useful for busy stakeholders or decision-makers who need a quick understanding of the document’s purpose and findings.
How to write an executive summary
It’s best to write the executive summary after you’ve finished the full report. This way, you’ll know exactly what to highlight.
Typically, your executive summary should cover:
- The problem or issue
- Key findings (with facts and figures)
- Analysis of findings
- Recommendations
- Conclusion
How do I write an effective executive summary?
- Limit it to two pages for longer reports.
- Keep it to one paragraph for shorter reports (3-4 pages).
- Break up text with subheadings and bullet points.
- Include a chart or graph to highlight key findings or recommendations.
What’s your #1 tip for writing a great business report? Let us know in the comments below.
You might also enjoy:


