


There are an estimated 300 million color-blind people worldwide, including Mark Zuckerberg, Bill Clinton and Prince William!
Optimizing your graphics can help make them more accessible—and that doesn’t mean banishing color from your charts and graphs either. It means ensuring people with visual impairments can understand your designs with a WCAG contrast checker — lucky for you, this feature is built right into Venngage’s Accessible Design Tool.
In this guide, I’ll talk about the different types of color blindness and how it affects data visualization. Plus, I’ll share tips on using color-blind-friendly palettes to make your graphics more accessible with the help of accessible templates.
I’ve also put together some ready-made color-blind-friendly palettes to inspire you. Scroll down to section 4 for that.
First things first…
What is color blindness?
Color blindness—also known as color vision deficiency (CVD)—is a deficiency in distinguishing between different colors. It occurs when light-sensitive tissue in the back of the eye—the retina–fails to properly respond to variations in wavelengths of light, which enable people to see different colors.

Although color blindness is primarily an inherited condition, it can also result from cataracts or trauma to the eye, as well as a number of diseases, including Parkinson’s, Kallman’s Syndrome and diabetes. Damage to the retina caused by aging can additionally cause color blindness.
Why color is important to data visualization
Color plays a significant role in data visualization. For starters, colors are used to highlight important information, as well as illustrate relationships between various types of data. Color also plays an instrumental role in guiding the viewer’s eye. It can even be used to stimulate emotion through color psychology.

You can even argue that the colors used in charts and infographics actually tell the story of the data they represent. As Eva Murray writes in Forbes:
In data visualization, color sets the tone and enforces a message for the underlying visual display. It creates a certain atmosphere and can turn an unassuming visualization into an emotion-filled data story.
WATCH: Everything you need to know about COLOR… in under 3 minutes
Knowing how to pick colors is important, but when you’re optimizing for accessibility, there’s more to consider than color theory and design composition.
Related: 8 Best Practices for Designing for Diversity and Inclusion
You can also use Venngage’s color picker tool to easily switch out different colors, a particularly useful tool for working with color blind friendly palettes.

What colors are color blind-friendly?
Colorblind-friendly palettes usually use two main colors like blue and red, along with shades made from these two hues. Examples include blue/orange, blue/red, or blue/brown. Blue is a safe bet as most types of color blindness have little effect on how blue is perceived.
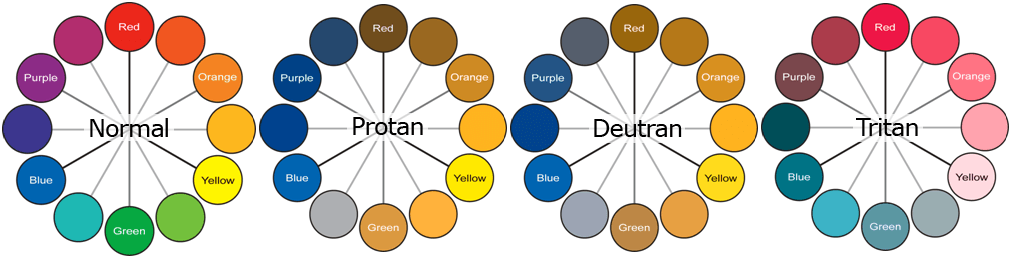
If you’re not sure where to start, these color blind color wheels can be a useful reference to quickly determine how your colors will translate across different forms of color blindness:
Better yet, I’ve put together some versatile color blind friendly palettes:
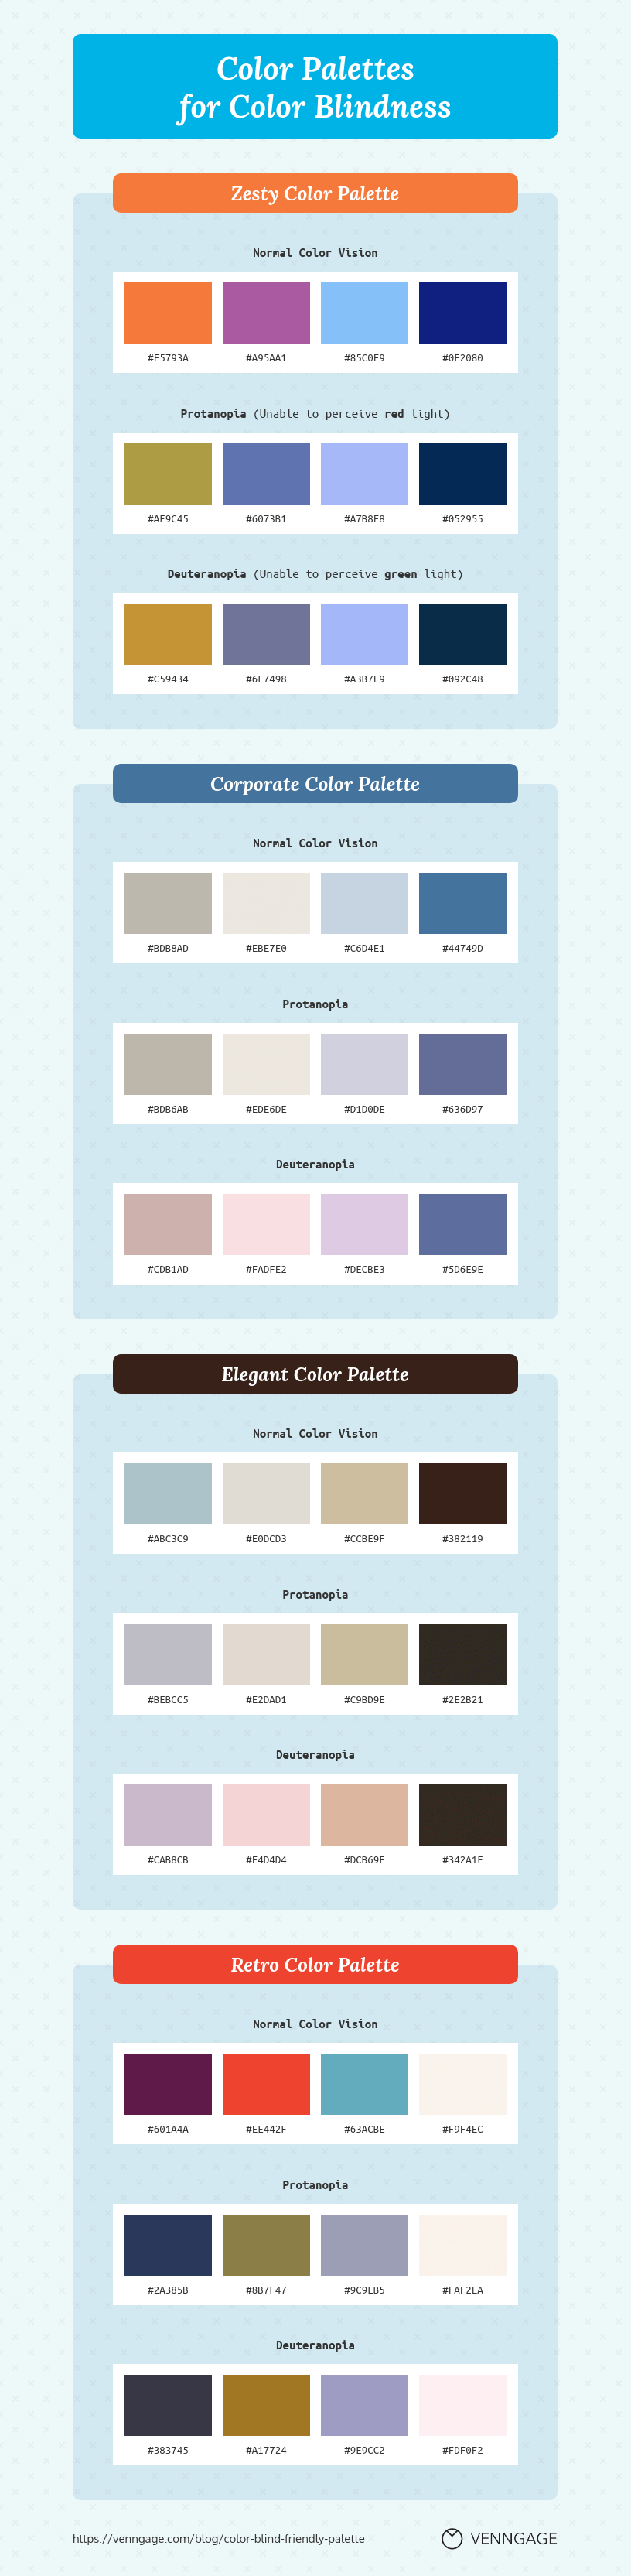
To make your visuals more accessible, here’s a quick reference table with HEX codes, color names, and notes on which types of color blindness each is suitable for.

Popular color blind-friendly palettes you can also check:
Okabe-Ito Color Palette
Designed to be distinguishable for all types of color blindness, especially useful in scientific visuals.

Kelly’s 22-Color Palette (selection of most distinct)
Chosen for maximum contrast and color distinction, even for color blind viewers.

How to design charts with a color blind friendly palette
1. Plan out your color scheme beforehand
Using a color blind friendly palette with accessible colors doesn’t mean you need to compromise on aesthetics or strip out all the color from your charts. By planning ahead and utilizing tools like a color palette tester, you can ensure a color blind friendly palette compliments your design, rather than clashes.

Even with a tool like Venngage, which can drastically scale back the number of hours required to create an infographic, it’s still ideal to flesh out your color scheme before you dive in and start a new project.
If you don’t have a pre-planned accessible color scheme, you can generate one for free using Venngage’s Accessible Color Palette Generator:

Gone are the days of mixing, matching, testing and retesting to find a beautiful, accessible color palette. Now you can use this simple tool to generate inclusive color pairings in seconds — for free.
How does it work? In two ways:
- Randomize. Don’t think twice — roll the dice and generate palettes based on a random color.
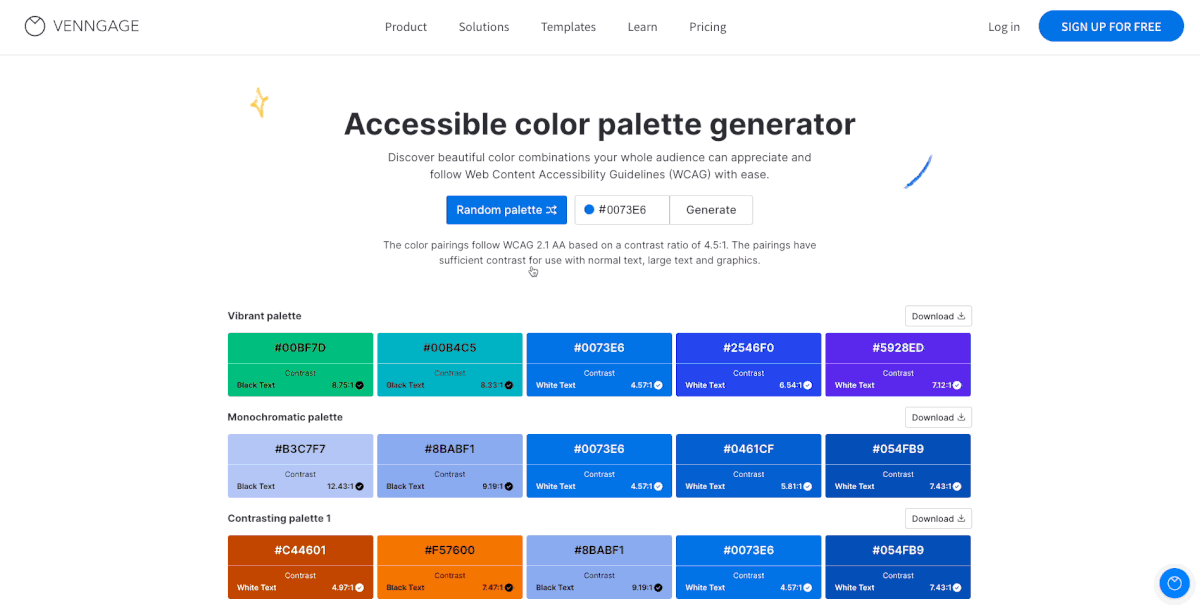
- Generate from HEX. Input a HEX code to discover accessible palettes based on your color of choice.

No matter which route you choose, you’ll see the contrast ratio of each color against black or white text. And every palette generated adheres to a contrast ratio of 4.5:1 as per the latest Web Content Accessibility Guidelines (WCAG) 2.1 AA.
In other words, the designs you create with these color combos will be compliant and inclusive.
Once you find a palette you love, simply click Download. You’ll get a text file with the HEX codes for that palette and for the text color that goes with it (#ffffff for white text and #000000 for black text).
Try Venngage’s Accessible Color Palette Generator for free! Once you’ve narrowed down your color palette, you can upload your data. It’s simple with Venngage’s chart widgets. Double-click your chart to access your chart widget, click the green IMPORT button under the DATA tab and upload your CSV file. Your chart will visualize the data automatically.

Venngage has also made it easier to customize your tables now. You can present data and highlight important information without compromising the accessibility of your design.
When editing your table, you can choose the style and color of your fonts, and the background colors of your cells.

You can also organize your text to improve the readability. Here you can choose how to align your text horizontally and vertically within each cell.

Take advantage of stylization features like these! After all, if it turns out your colors aren’t particularly suited to color blind people—and accessibility is important to you—it’s better to find this out before you’ve invested considerable time and effort in your design composition.
HOT TIP: If you’re stuck, try using a tool like Coblis, a free color blind simulator which will give you a better sense of how your images will appear to people with color blindness.
Related: A Total Guide to Accessible Colors [Including Palettes & Templates]
2. Avoid problematic color combinations
Another reason you should plan out your color scheme beforehand is so you can avoid using problematic color combinations, some of which can make your charts or infographics completely inaccessible to color blind people.
Color combinations to avoid for people with color blindness include:
- Red & green
- Green & brown
- Green & blue
- Blue & gray
- Blue & purple
- Green & gray
- Green & black
If you’re stuck and absolutely must use one of these combinations, try adjusting the shades so one is extremely dark, and the other extremely light—most color blind people can detect contrast, so this likely will make things easier.
While high-contrast palettes are typically recommended for accessibility, you can also experiment with muted or pastel color combinations—as long as contrast is preserved. Check out our guide to pastel color palettes for ideas that balance aesthetic and readability.
Incorporating color blind-friendly palettes in your design can significantly enhance accessibility and user experience, ensuring your website is inclusive for all visitors. Partnering with a webflow design agency can help you seamlessly integrate these thoughtful design elements, transforming your vision into a functional, visually appealing reality.

3. Use highly contrasting colors
As previously mentioned, contrast isn’t an issue for most people who are color blind. Darken and lighten your colors, respectively, to make the contrast more pronounced. You can also play with different hues, as well as levels of brightness and saturation.

4. Use patterns and textures
Using patterns and textures in your design is a great way to incorporate visual elements into your design which don’t rely on color.

Venngage’s drag-and-drop design editor features a library of patterns you can use to enhance your design and make it more accessible.

Related: Color Blind Design Guidelines: How to Convey Meaning to Everyone [With Examples & Templates]
5. Use symbols
Symbols and icons are a great way to make your designs more accessible because they can visually punctuate a message, without relying on color.

Hot Tip: Venngage’s library includes over 4,000 icons you can use to make your infographics and charts more accessible.

6. Make your chart monochromatic
Because color blindness doesn’t impact the ability to distinguish between different shades, consider making your charts monochromatic. Using a restricted color palette will naturally mean there are fewer opportunities to use problematic colors or combinations.


7. Keep your design clean and simple
When you’re designing for accessibility, it’s important to keep your infographics as simple and streamlined as possible. Adopting a minimalistic approach will help ensure your presentations are more easily understood, whether or not your audience is color blind.
Designing for color blindness is just one part of making visuals accessible. For a broader understanding of accessibility, learn how the POUR principles—Perceivable, Operable, Understandable, and Robust—can guide inclusive design.
Useful tools to design for color blind accessibility
Designing with color blind accessibility in mind is much easier when you have the right tools. Here are some useful resources to help you choose, test and refine color palettes:

What colors to avoid for color blindness?
Color blindness doesn’t mean people see in black and white. In fact, more than 99% of people with color blindness actually see color, just not exactly like everyone else.
The most common type of color blindness affects how people see reds and greens. Here are some color combinations to avoid to ensure your designs are more accessible:
- Red & green
- Green & brown
- Green & blue
- Blue & gray
- Blue & purple
- Green & gray
- Green & black
What are the 3 types of color blindness?
There are three distinct types of color blindness:
Red/Green Color Blindness
According to Colblindor, 99% of all color blind people suffer from red/green color blindness. This is further broken down into two distinct categories:
- Protanopia: Also referred to as “red weakness”, individuals who suffer with this variation of red/green color blindness are unable to perceive red light.

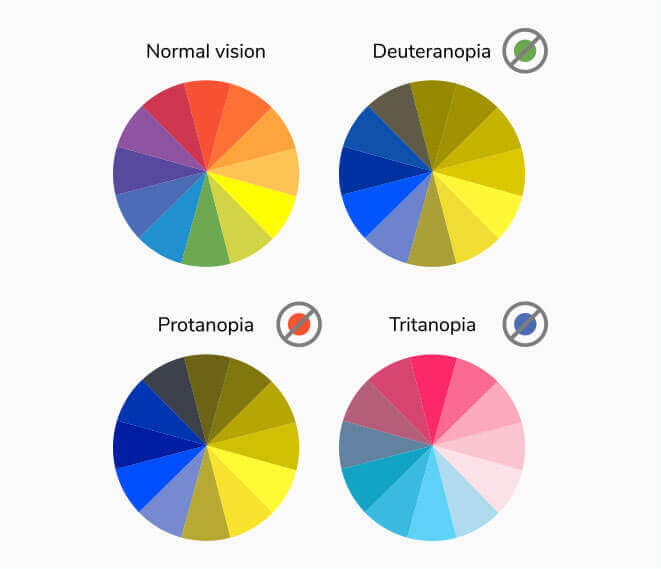
Left: Normal vision, Right: Protanopia
The protanopia color spectrum looks like this:

- Deuteranopia / Deuteranomaly: Also known as “green weakness”, this type of red/green color blindness renders people insensitive to green light (deuteranomaly) or unable to perceive any green light at all (deuteranopia).

Left: Normal vision, Right: Deuteranopia
The deuteranopia color spectrum looks like this:

Red/green color blindness is inherited, and affects males more than females. The reason for this is because the genes responsible for this condition are contained within the X chromosome.

Because women have two X chromosomes, any deficiencies in one will typically be compensated by the other. Men, however, only have one X chromosome, and don’t have a “spare” to fall back on.

Blue/Yellow Color Blindness
People who suffer from blue/yellow color blindness have difficulty distinguishing between blue and yellow colors.
This particular form of color blindness–also known as Tritanopia–is far less common than its red/green counterpart. In fact, according to the U.S. National Library of Medicine, blue/yellow color blindness affects fewer than 1 in 10,000 people worldwide.
Because Tritanopia isn’t caused by a genetic trait linked to the X chromosome, it is equally present in both men and women.

Left: Normal vision, Right: Tritanopia
The Tritanopia color spectrum looks like this:

Complete Color Blindness
People who suffer from complete color blindness—also known as Monochromacy—are unable to distinguish between any colors at all. Monochromacy is extremely rare, occurring in 1 in 33,000 people, according to Colour Blind Awareness.

What colors can color blind people see?
Most individuals with color blindness can see colors, just not in the same way as those with typical color vision. The term “color blindness” is more accurately referred to as color vision deficiency (CVD). People with CVD have difficulty distinguishing certain colors, not a complete inability to see color.
The colors a person can perceive depend on the type and severity of their condition. Below is a breakdown of the major types:
Red-green color blindness (most common)
This type includes two primary forms: protanopia and deuteranopia.
Protanopia (absence or malfunction of red cones):
- Reds appear dark or nearly black.
- Greens, oranges, and browns may look similar or muted.
- Blues and yellows are generally unaffected.
Deuteranopia (absence or malfunction of green cones):
- Difficulty distinguishing reds, greens, and browns.
- Blues and yellows remain largely distinguishable.
Colors commonly perceived:
- Blue, yellow, white, gray
- Some limited perception of red and green in altered tones
Blue-yellow color blindness (rare)
Known as tritanopia, this form is far less common.
Tritanopia (absence or malfunction of blue cones):
- Blue and green may appear similar.
- Yellow can appear faded, pinkish, or gray.
- Red and green vision is typically unaffected.
Colors commonly perceived:
- Red, green, and some pinks
- Impaired perception of blue and yellow
Monochromacy (complete color blindness – extremely Rare)
Monochromacy occurs when none of the cone cells function properly.
Rod Monochromacy:
- No color vision at all
- Vision is limited to black, white, and shades of gray
- Often accompanied by light sensitivity
Cone Monochromacy:
- Very limited color vision
- May still detect some hues depending on which cones function
Colors commonly perceived:
- Black, white, gray
Key takeaways for using color blind friendly palettes
Optimizing your infographics and charts for people affected by color blindness is important for both accessibility and inclusivity. It’s also possible to do without compromising the aesthetic quality in the process.
The following measures can help ensure color blind people are actually able to engage with your designs:
- Selecting color blind friendly palettes
- Avoiding problematic color combinations
- Using different textures and patterns to highlight important information–not just color
- Using symbols and icons to supplement color-coded messages, warnings and alerts
- Using highly contrasted color combinations
- Adopting minimalistic design to help avoid unnecessary confusion.
Combining all these elements will help make your designs more accessible to color blind people. After all, the more people you can engage with, the more impactful your work will be.
Related: ADA Standards for Accessible Design: How to Be Compliant
Related blog posts:


