NotebookLM can generate an infographic in minutes, but fixing a distorted word or typo isn’t as simple as clicking the text and editing it.
NotebookLM, which Google renamed Gemini Notebook in July 2026, is good at finding what matters in your sources. The problem is the infographic it makes from them, because it can still misspell words and misstate numbers, it comes out as a flat image, and the only fix inside the tool is to generate it again and hope the next one is right.
This guide shows you two ways to fix it. The quick way is to upload the PNG so its text becomes editable. The thorough way is to rebuild it from your notes in five steps, using a copy-paste prompt for Venngage’s AI Infographic Generator. You’ll also get a fact check to run before you share anything, and the results of a side-by-side test.
I tested this with notes for Sunfern, a made-up company with sample data, and the screenshots below come from that test.
Quick answer: You can’t edit the text in a NotebookLM infographic, because it downloads as a flat PNG image. To fix a typo or a wrong number, upload the PNG to Venngage, which recreates it as an editable design, or rebuild it from your NotebookLM notes in an AI infographic generator, then check every number against your notes.
Why your NotebookLM infographic has typos you can’t fix
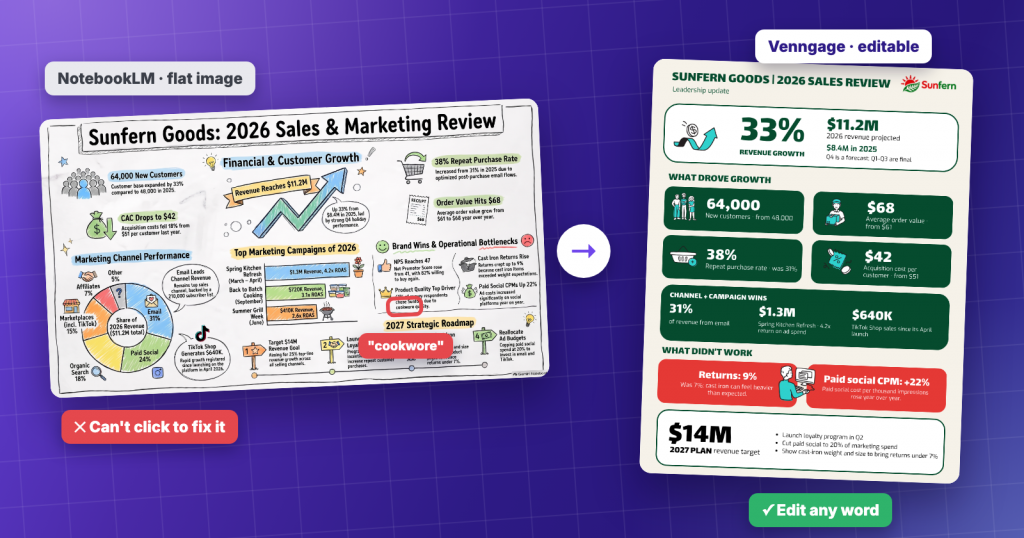
NotebookLM creates an infographic as a single image. Once it’s made, you can rename it, download it as a PNG, share it or delete it, but you can’t change the words or numbers inside it. Google also warns that its infographics are AI-generated and may contain visual or factual inaccuracies, so a typo or a wrong number is something you should expect to check for.
Slide decks work differently. Google’s March 2026 Workspace update added slide revisions and PowerPoint export for decks, but infographics still come out as images.
In my test, the text came out misspelled or jumbled most often in Detailed mode with many sources selected. Google also labels the Detailed level as beta.
The fastest fix: upload the PNG and edit the text in Venngage
Say the layout looks right and only a word or a number is wrong. You don’t have to rebuild anything, because Venngage can recreate the flat PNG as a design where the text is editable.
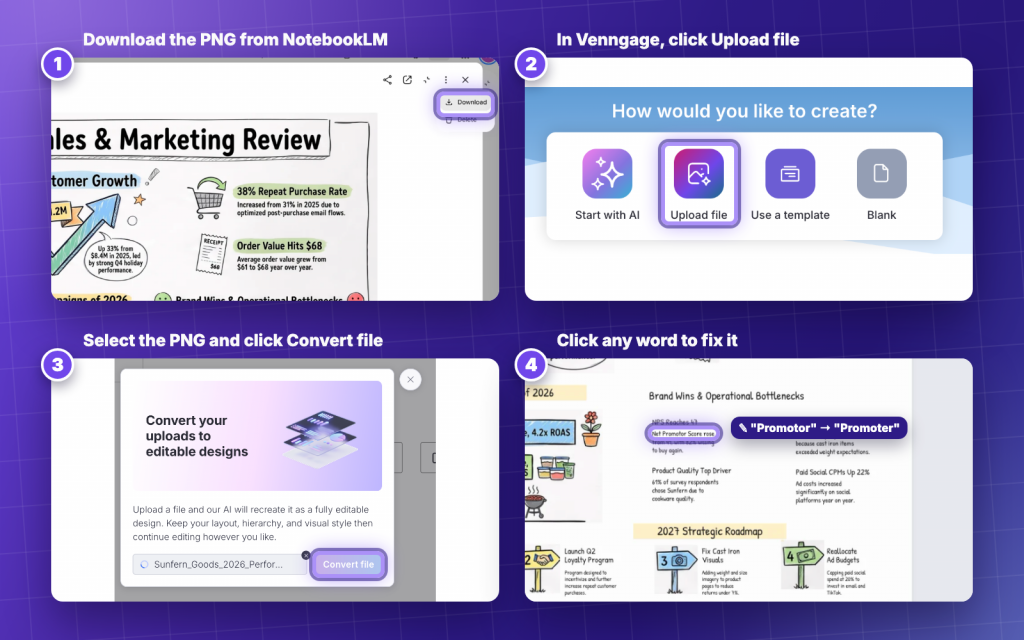
- In NotebookLM, open the three-dots menu next to your infographic and click Download to save the PNG.
- Log in to Venngage or create a free account. On the dashboard, under “How would you like to create?”, click Upload file.
- Select your NotebookLM PNG and click Convert file. Venngage’s AI recreates it as an editable design and keeps your layout, hierarchy and visual style.
- Click the wrong word or number and type the correction. In my test, the conversion had already fixed “cookwore” to “cookware”, but “Net Promotor” still needed fixing.
- Put the new version next to the original and fix any small design differences, such as a font or an icon that changed.
Optional: clean up the background. If a section keeps the background from the NotebookLM image, select it, click Edit Image and use Background Remover in the Image Filters panel.
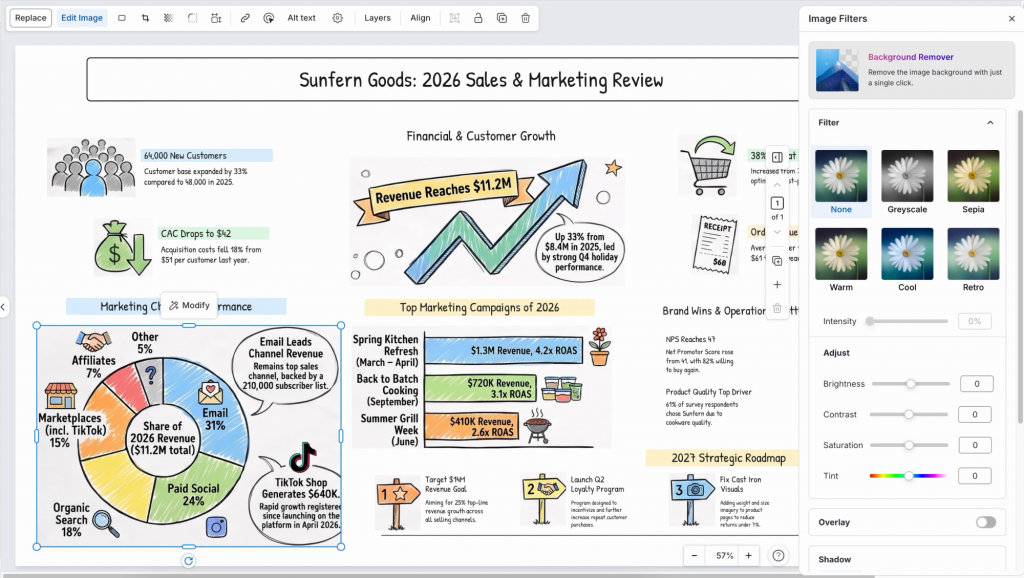
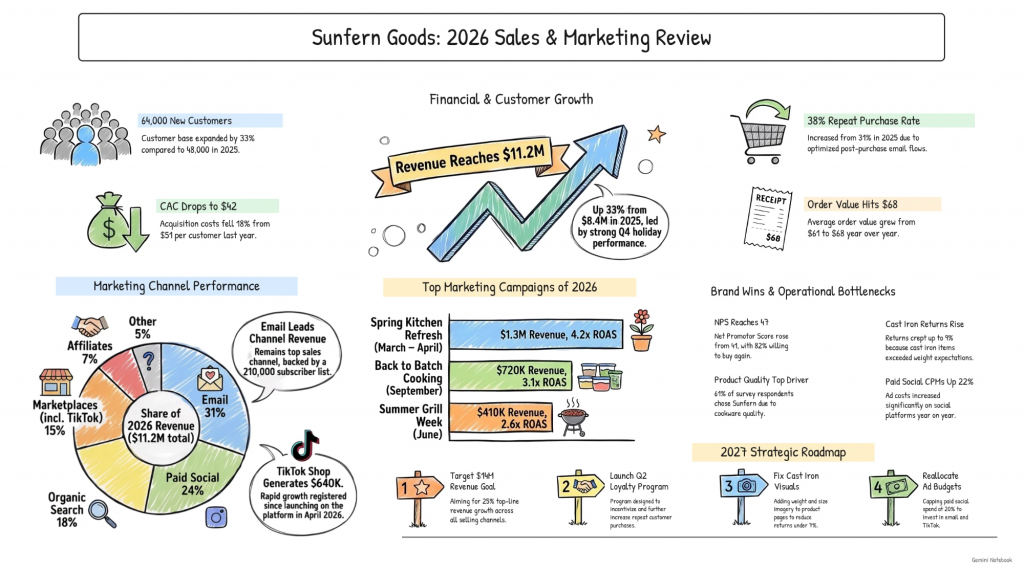
By now you should have an editable version of your NotebookLM infographic, with the same layout and your corrections in place.
Quick comparison: Upload the PNG when the layout works and you only need to fix a few words, because it’s faster than regenerating and gives you more control over what changes. Rebuild it from your notes with the steps below when the infographic is crowded or off-brand. Either way, run the number check in Step 4 before you share it.
The fix: rebuild it from FLAT to EDIT
When the infographic is crowded or off-brand, or you want a cleaner result than the upload gives, rebuild it instead. You still use NotebookLM to pull out your key points, then build a new design from them in a tool you can edit.
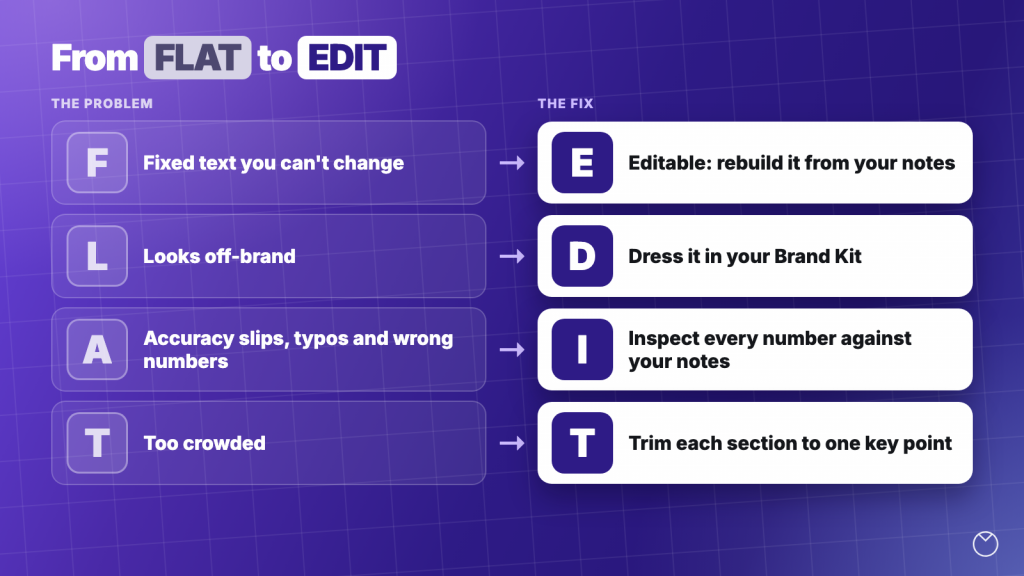
The method is called FLAT to EDIT: four problems with the NotebookLM image, and a fix for each one.
| Problem: the infographic is FLAT | Fix: make it EDIT |
|---|---|
| Fixed text you can’t change | Editable: rebuild it from your notes in a generator |
| Looks off-brand | Dress it in your Brand Kit |
| Accuracy slips, with typos and wrong numbers | Inspect every number against your notes |
| Too crowded | Trim each section to one key point |
Want to see how it works? Watch the full tutorial below:
Step 1: Get your key points out of NotebookLM
NotebookLM has already done the hard part by finding what matters in your sources. You only need that content as text you can copy.
- Open your notebook and select the sources the infographic should cover.
- Paste the prompt below into the chat.
- Read the bullets against your sources and fix anything that looks wrong.
- Copy the bullets into a doc so you can paste them in Step 2 and check against them in Step 4.
List the key points and numbers from my selected sources as short bullet points.
Keep every number exactly as it appears in the source.
Group the bullets under [3 to 5] headings for [topic].
Don’t add anything that isn’t in the sources.
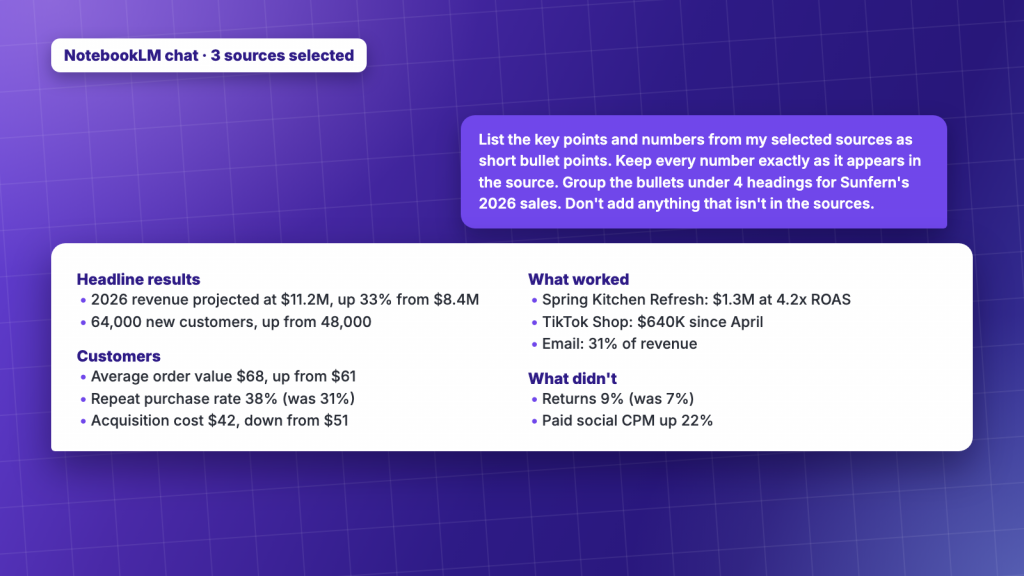
By now you should have a checked list of bullet points saved in a doc.
Step 2: Make it editable in Venngage’s AI Infographic Generator
Now you rebuild the design somewhere you can change it. The AI needs three things from you: the type of infographic, the content, and where it’s going.
- Open Venngage’s AI Infographic Generator and sign in or create a free account.
- Paste the prompt below, with your bullets under it.
- Generate the infographic and pick the layout that fits your content.
Create a one-page vertical infographic for a leadership update on Sunfern’s 2026 sales.
Sections: the headline result, what drove growth, what didn’t work, the 2027 plan.
Make the 33% revenue growth the biggest number.
Only use facts from my notes. Don’t add any numbers that aren’t in them.
Sunfern Goods 2026 sales (sample data made up for this video)
- 2026 revenue projected at $11.2M, up 33% from $8.4M in 2025 (Q4 is a forecast)
- Q1 $2.1M, Q2 $2.6M, Q3 $2.9M, Q4 $3.6M
- 64,000 new customers, up from 48,000
- Average order value up from $61 to $68
- Repeat purchase rate 38% (was 31%)
- Customer acquisition cost down from $51 to $42
- Biggest channel: email, 31% of revenue
- Best campaign: Spring Kitchen Refresh, $1.3M at 4.2x return on ad spend
- TikTok Shop launched in April: $640K
- Problems: returns up to 9% (was 7%), paid social CPM up 22%
- 2027 target: $14M, loyalty program in Q2
Why this works:
- The type sets the layout. “One-page summary” and “timeline” lead to very different designs, so naming it saves a round of edits.
- The destination sets the tone. A client report and a team update need different levels of polish.
- “Only use facts from my notes” limits invention. It tells the AI to work from your content instead of adding its own, though you still check the result in Step 4.
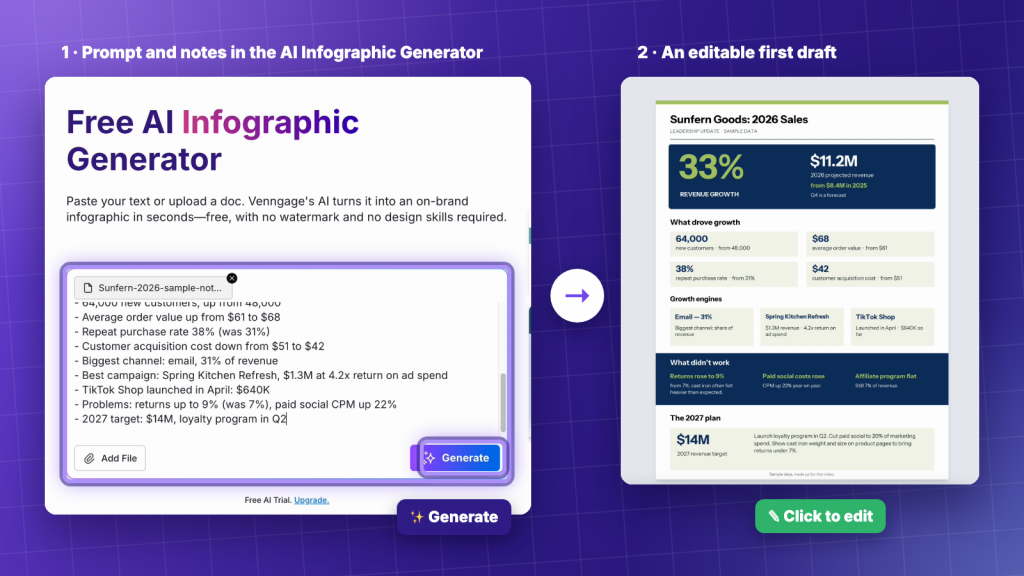
A good prompt defines the layout, audience and source material before the AI starts designing. For more examples, see our guide to AI infographic prompts.
By now you should have an editable infographic built only from your notes. If you’ve got a NotebookLM infographic with a typo right now, paste your notes into Venngage’s AI generator and see what comes back.
Step 3: Dress it in your brand
A manager or client will notice wrong colors before they read a word. This step makes the infographic look like it came from your team because brand consistency matters just as much as the information you’re presenting.
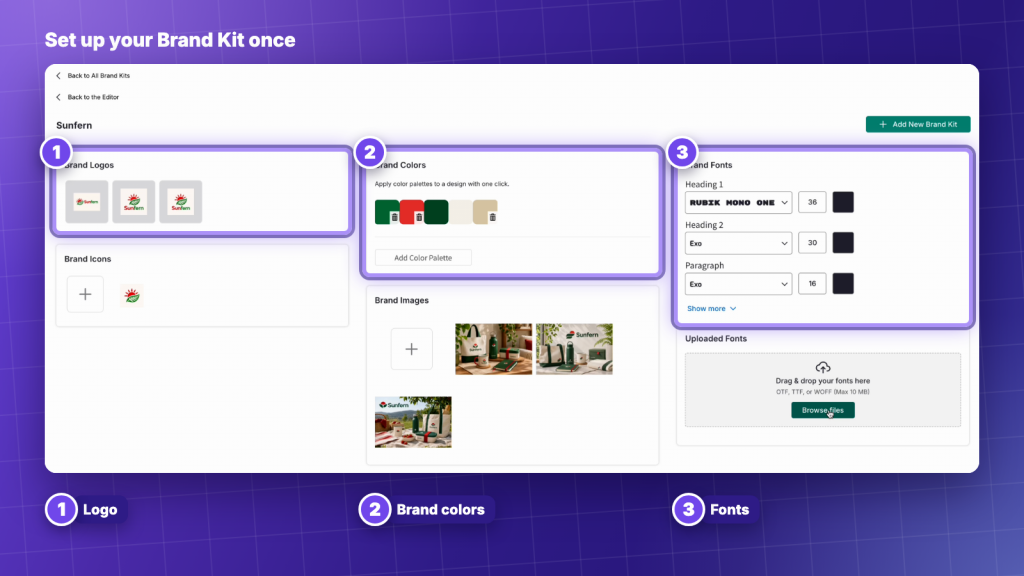
- In the editor, click Brand Kit in the side menu.
- Choose your brand kit and click Apply Brand. Your colors, fonts and logo are already saved in it, so you don’t need to match hex codes by hand.
- Check that every heading, label and number uses your brand fonts and colors, and fix anything that doesn’t match.
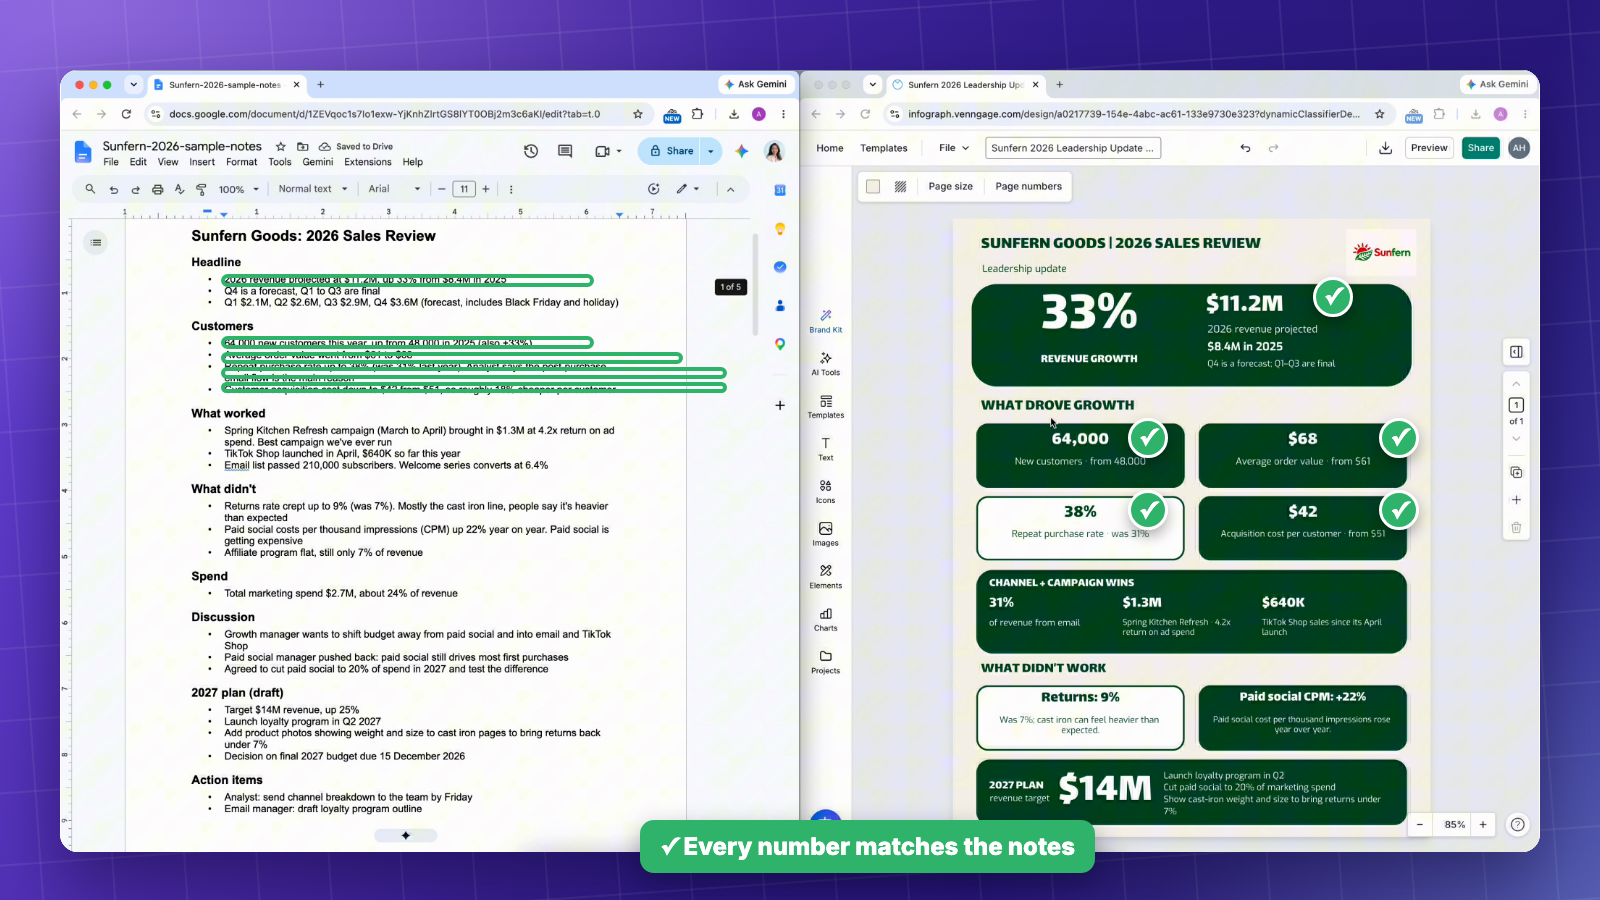
Know the limits: the generator page lists auto-branding under the Premium and Business plans, so check that Apply Brand is included in your plan.
By now you should have an on-brand infographic.
Step 4: Inspect every number against your notes
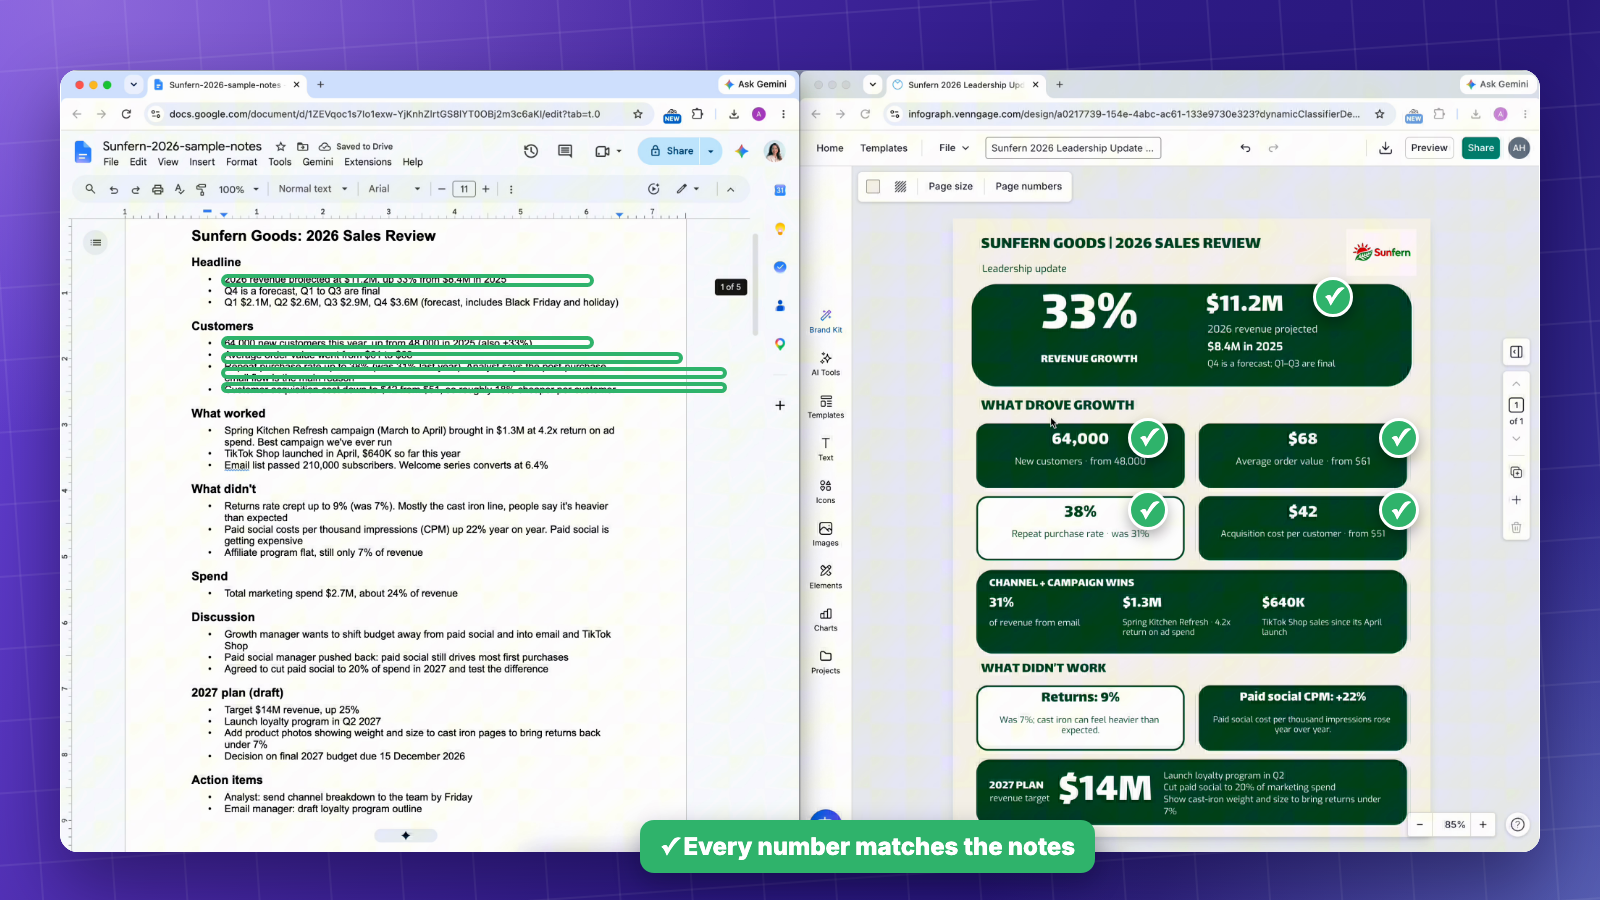
Before anyone sees your final on-brand design, put your notes next to it and check it like a proofreader, because a good-looking layout can still carry a wrong number.
- Open your notes or original sources next to the infographic.
- Tick off every number in the design against your notes.
- Circle anything that isn’t in your notes, including labels, statistics and claims.
- Read every heading and label for spelling.
- Click into the design and correct anything you circled.
Ask three questions before you move on: are the numbers right, did the AI add anything that isn’t in my notes, and does the main point stand out?
If you’re working with more complex datasets, our comparison of AI data visualization tools covers other ways to turn numbers into charts and reports.
Step 5: Trim each section to one point and export
Less text on the page means fewer words to check, and it makes the main number easier to find.
- Ask the AI to cut each section to one key point.
- Delete anything your reader won’t miss.
- Make the main number the largest thing on the page.
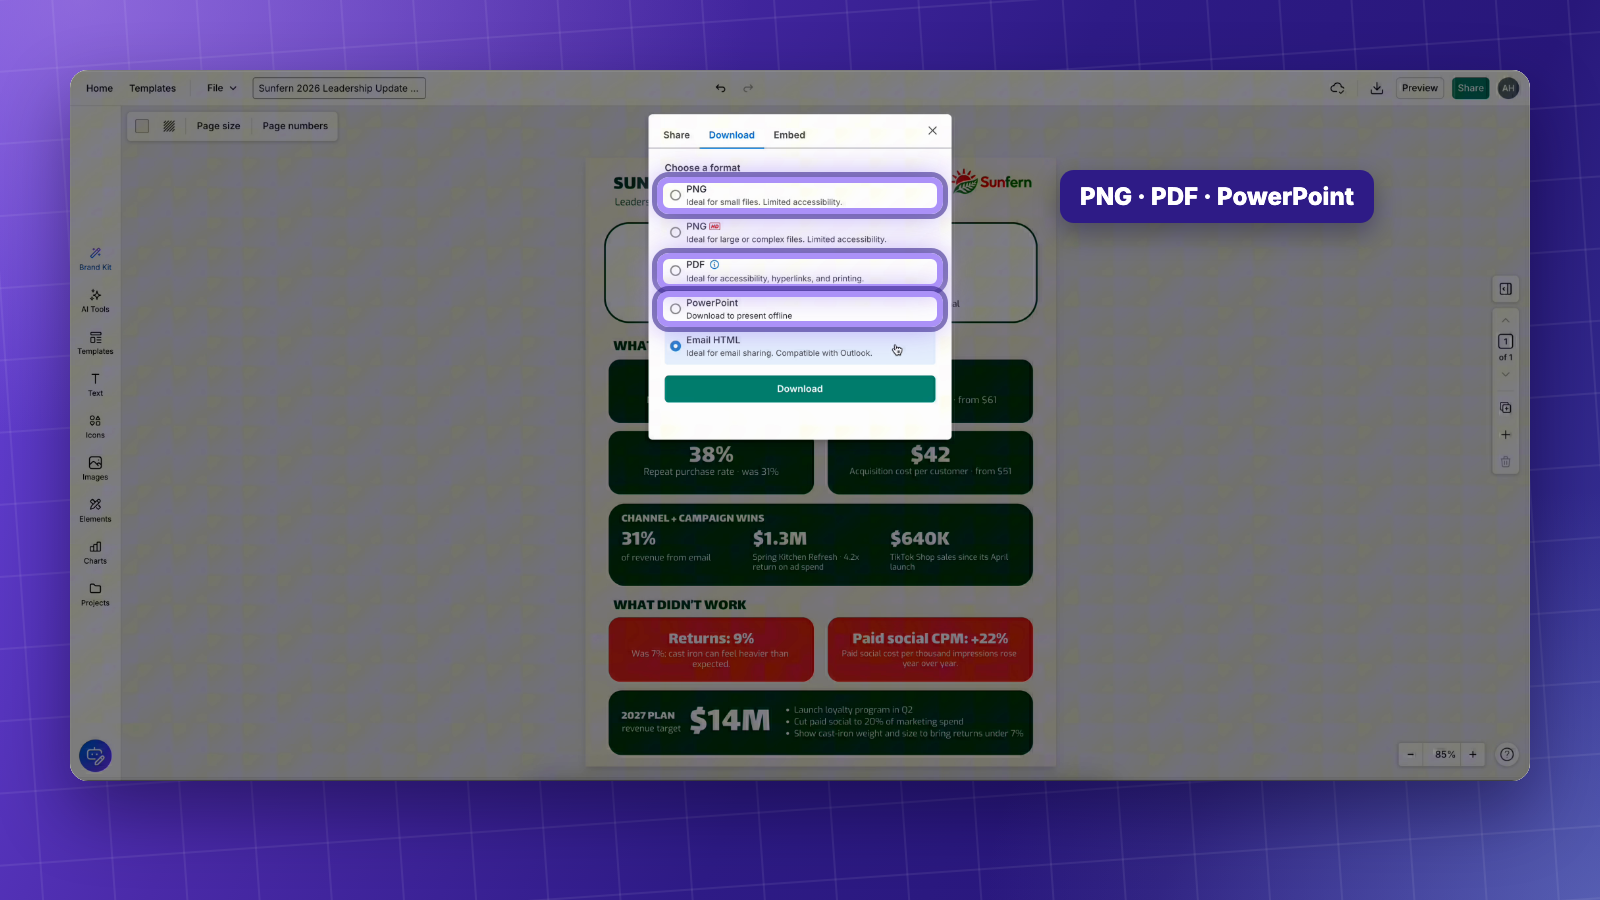
- Download it as PNG, PDF or PowerPoint, or share a link.
I tested both: NotebookLM vs Venngage on the same notes
To see how much the rebuild changes, I gave both tools the same checked notes and the same instructions, then scored each result against those notes.
NotebookLM’s version had three typos and one misleading claim, while the Venngage version matched every number in my notes. The typos were “Net Promotor”, “Sunform” and “cookwore”, and the misleading claim said the customer base expanded by 33%, when my notes said the 33% growth was in new customers.
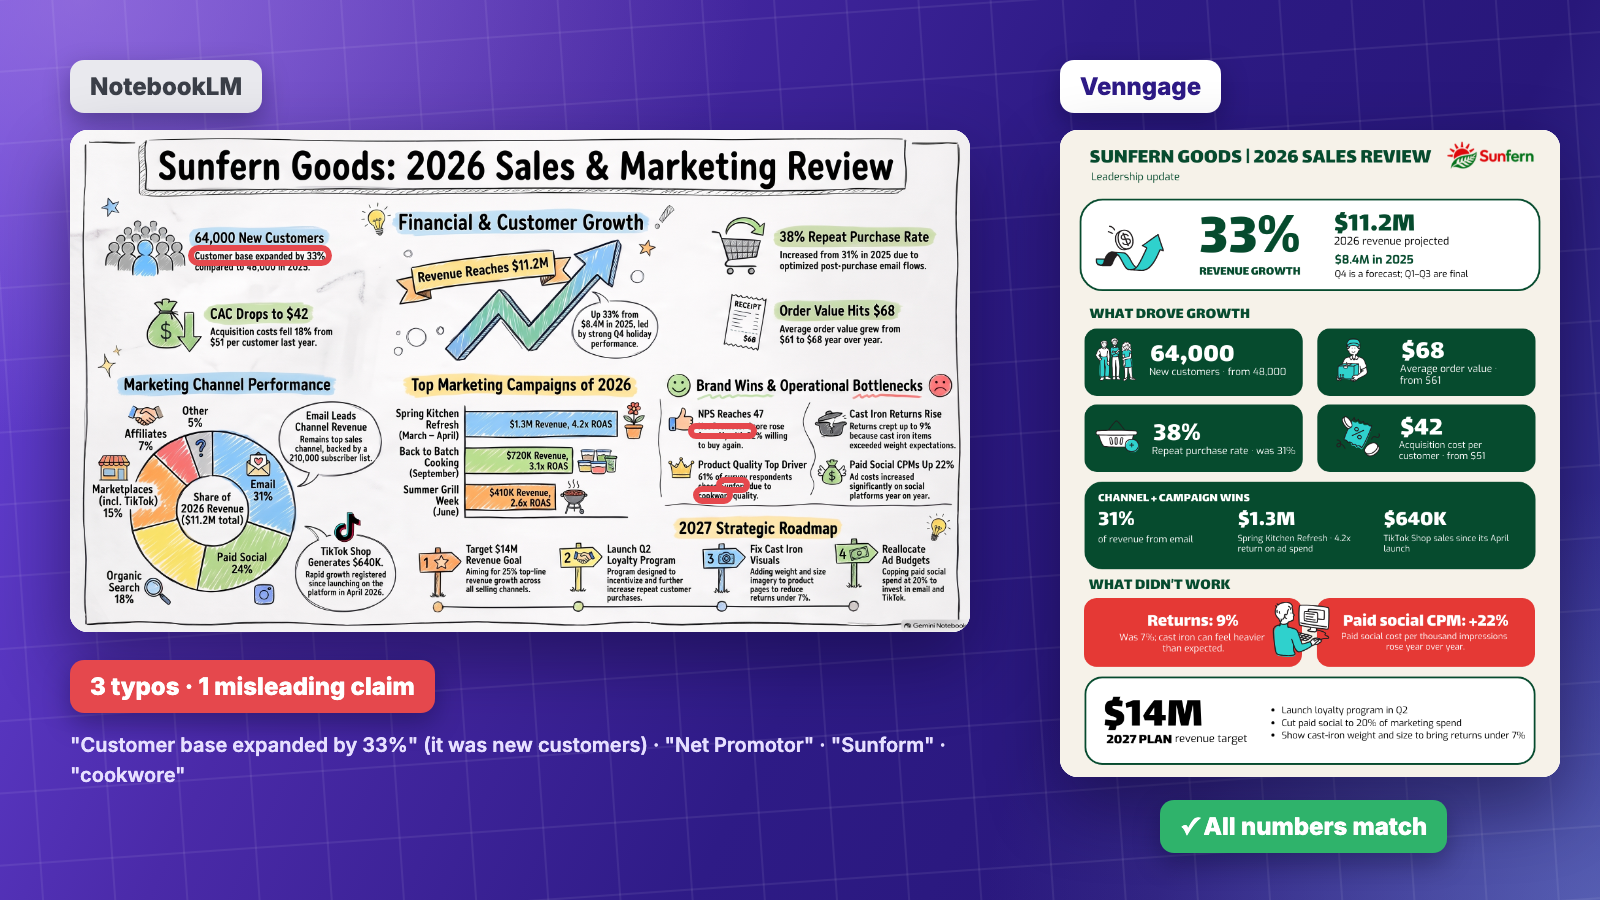
Quick comparison: NotebookLM is a good fit when you want a fast visual summary for yourself and a PNG is enough. An editable generator is the better fit when the infographic goes to a manager, a client or a slide deck, and every word and number has to be right.
Other ways people fix NotebookLM infographics (and their limits)
Uploading and rebuilding aren’t the only fixes you’ll come across. Here’s how the common options compare on the one thing that matters most, which is whether you can edit the text afterwards.
For more tools that give you an editable result, see our roundup of the best AI infographic generators. We also have guides to making infographics with ChatGPT and Claude.
How to get fewer typos in your next NotebookLM infographic
If you’d rather keep the NotebookLM version next time, change a few settings before you generate. Click the pencil icon next to Infographic in the Studio panel to open them.
- Start with Concise or Standard. Google labels the Detailed level as beta, and less text means fewer words that can come out garbled.
- Use the prompt box. Guide the AI with specific instructions about colors, content, and layout. For a cleaner infographic, ask it to shorten labels, reduce the number of sections, and focus on the key information.
- Select fewer sources. In my test, distorted text showed up most often with many sources selected, and a narrower set gives the infographic less to squeeze in.
NotebookLM infographic prompt
Paste this into the prompt box and fill in the brackets:
Create a [type, e.g. one-page summary] infographic about [topic] for [audience, e.g. my team].
Focus on [the 3 to 5 points that matter most].
Use short labels instead of full sentences, and keep each section to one key point.
Make [main number] the largest element on the page.
Use [color palette, e.g. navy and orange] with plenty of white space.
FAQ
Can you edit a NotebookLM infographic?
No, you can’t edit the text or numbers of a NotebookLM (now Gemini Notebook) infographic inside the tool. Google’s help page lists renaming, downloading as a PNG, sharing and deleting as the options, so to change the content, regenerate it, or upload the PNG to a tool like Venngage that recreates it as an editable design.
How do I fix a typo in a NotebookLM infographic?
Download the infographic as a PNG and upload it to Venngage, which recreates it as an editable design so you can click the word and type the correction. If the infographic is crowded or off-brand, rebuild it from your NotebookLM notes in Venngage’s AI Infographic Generator instead, then check every number against your notes.
Can I turn a NotebookLM infographic into PowerPoint or PDF?
No, NotebookLM infographics download only as PNG images. Google added PowerPoint export for NotebookLM slide decks in March 2026, but not for infographics, so you can place the PNG on a slide but can’t edit its text. To edit it, upload the PNG to Venngage, which converts it into a design you can download as PDF or PowerPoint.
AI handles the layout, and you handle the facts
NotebookLM handled the research part well. It found the key points in my sources and pulled out the numbers that mattered. But when those findings became an infographic, three words were misspelled and one number was used to make a claim that wasn’t in my notes.
The real problem isn’t that AI makes mistakes. It’s how much effort it takes to correct them. Regenerating an infographic might fix one error, but it could also change something that was already right. An editable design gives you more control. You can fix a typo, change the colors and fonts to match your brand, and focus on verifying the information without having to start over.
If you’ve got a NotebookLM infographic with a mistake in it right now, paste your notes into Venngage’s AI Infographic Generator and see what comes back.