


Whether you’re presenting to your company or helping a client, financial information gets complicated very quickly.
Finance infographics let you simplify finance concepts, trends, best practices, processes, data and more for anyone who’s not an expert. With the help of icons, visual cues and other aids, a finance infographic conveys big ideas in ways that are manageable.
In this post, you’ll find over fourteen finance infographic templates that you can use for engaging your clients or internal financial reporting.
Not a designer? No problem. Venngage’s free Infographic Maker is meant for non-designers to create stunning visuals.
15 Finance infographic examples with sample templates
- Personal finance infographic template
- Planning finance infographic template
- Red finance infographic template
- White finance terms infographic template
- Modern finance infographic template
- Client finance infographic template
- Client investment finance infographic template
- Investment finance infographic template
- Investment process finance infographic template
- Budgeting finance infographic template
- Buying process finance infographic template
- Student loan finance infographic template
- Statistics finance infographic template
- Corporate finance infographic template
- Comparison finance infographic template
1. Personal finance infographic template

Simple finance infographics help to provide a useful overview of what your finance consultancy does. Rather than paragraphs that your audience needs to sift through, or long-winded explanations, they have a simple summary that they can understand in minutes.
These types of infographics are great marketing assets to have on-hand. They can be used on your website, in social media posts and printed off to distribute at events. They are versatile, and a great way to stand out from competitors.
2. Planning finance infographic template

This planning finance infographic template is a great way to explain multiple steps to a process. The gradient coloration and large icons are eye-catching. The “layers” of icons also encourage the reader’s eyes to make their way down the infographic.
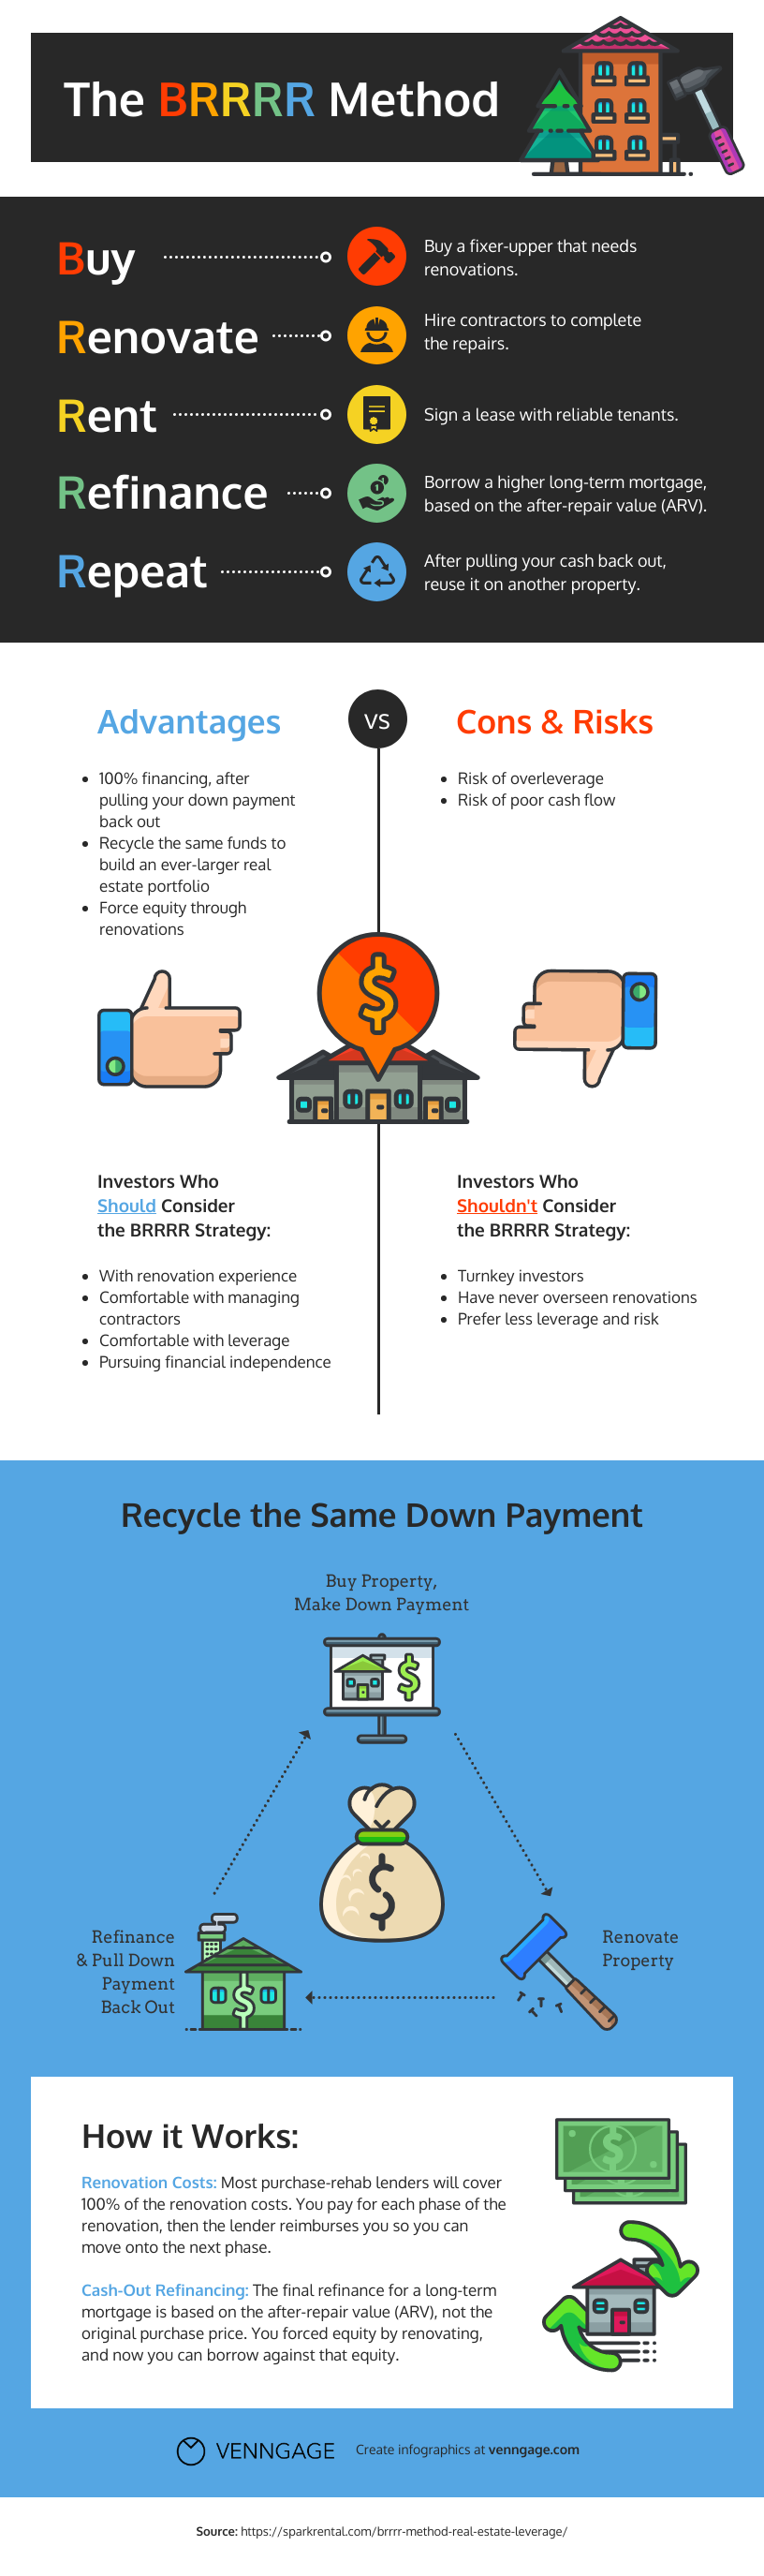
3. Red finance infographic template

Using this template makes something complicated less intimidating to your audience. It communicates helpful ideas about investing in stocks with memorable headings, quick takeaways and icons.
You can use an infographic like this to help explain stock trading, address client concerns, guide decision-making and more. Additionally, for clients interested in active trading, you can include information on trading options on Webull to enhance their understanding of various trading platforms.
Customize this finance infographic completely to communicate concepts most important to your clients. In the Venngage editor, you can swap out the text, apply new icons from the icon library and update the color palette to match your brand.
Related: 20+ Business Infographic Examples
4. White finance terms infographic template

There are many ways to breakdown important terms or concepts when it comes to financial literacy. This finance infographic template is an alternative design that you can customize for your own needs.
What this template does well, is use headings that pop out to convey its core ideas in an instant. This helps people remember what they read, even if they can’t recall the finer details.
5. Modern finance infographic template

It’s helpful to know how to share financial data with your clients. A snapshot of financial expenditures all in one place can help people understand how their money is moving. It is also a way for you to preface any suggestions you want to make when they have the same context as you!
Venngage’s chart widgets and tables are very easy to edit and customize thanks to our online chart creator. Input your data from a spreadsheet to quickly transform your charts. You can also change chart styles, labels and colors with a click.
6. Client finance infographic template

Venngage’s editor grants you access to an impressive icon library with over 12,000 professional icons, graphics and illustrations. With a professional (and diverse) library of icons at your disposal, you can create stunning content without a designer.
Symbolize actions to help your clients visualize each step to a process. Make daunting ventures like major real estate investments easier to approach by customizing a professional finance infographic template like this one.
Related: 12 Real Estate Infographics to Improve Your Business Communications
7. Client investment finance infographic template

It’s always helpful to point to best practices for the team to adopt and to grow your high-performers.
Finance infographics can serve as job aids that help your team approach different tasks strategically. Even finance experts need to have frameworks for solving financial problems. These are also ways to build a brand and culture that clients learn to know and trust.
This template for investing can be easily customized to support your team and their work.
8. Investment finance infographic template

This finance infographic template design was actually made for Mashvisor and can be found on their blog. They found it super helpful to break down a complicated process (purchasing investment properties) into its numerous steps with an infographic.
You can easily adapt this layout for your own content, applying your brand colors and company logo to make it your own.
The lines, colors and icons, help your readers make their way through content without feeling overwhelmed or lost. What makes this infographic effective is that headings broadly capture each step, with subtext that provides more details. This is an approach that helps break up dense content into manageable parts.
9. Investment process finance infographic template
With finance infographics, you can use a number of different layouts and styles in one single design. You can incorporate charts, graphs, diagrams, comparison lists and so much into one visual.
This is especially important for lengthier finance infographics or infographics that cover broad topics. A single design applied all the way through for each section risks appearing repetitive and will lose your reader’s attention.
This template changes its layout to effectively deliver new information as you make your way down. When needed, comparisons and diagrams are included to help each idea come across loud and clear.
As new ideas or steps are introduced in your finance infographic, you can visualize them in the ways that make the most sense.
10. Budgeting finance infographic template

Not all finance infographics need to be elaborate or touch on complicated ideas. Finance infographics are there to just help you communicate content clearly.
Rather than rely on a text-heavy document to provide a finance breakdown, you can use a simple chart that highlights the breakdown. This budgeting finance infographic template keeps things super simple. It sticks to a black and white palette, line icons to represent each item, and leaves a portion at the bottom to provide an explanation.
Whether you are communicating with clients, or higher-ups within the business, getting across important information quickly is a valuable skill to have.
11. Buying process finance infographic template

Remind the right people that you’re an expert. Provide the information that’s most helpful to them in a way that is simple to understand.
When we consider major purchases like a car or house, people may not anticipate the overall expenses, long-term costs, or the process overall. When you can use a finance infographic to guide people through a purchase process, you’ve instantly helped potential clients–that’s something people remember.
12. Student loan finance infographic template

It’s never enough to just provide important information – it needs to be accessible. That means it can be found easily and understood easily by your intended audience.
Navigating loans, student bank accounts, and financial processes is already difficult because for most, because it will be unfamiliar to them. But add to that the fact so many things are competing for our attention, our focus is stretched.
In order to be effective with the information you need to communicate, a visual like this loans finance infographic template is the way to go. A simple layout, with clear headings and engaging visuals, helps make an unfamiliar process easy to grasp.
13. Statistics finance infographic template

When we share data without any creative flair, it’s easy to lose our audience. By comparison, a finance infographic design is a great opportunity to present data in a way that’s engaging and interesting. Your audience can actually enjoy taking in all the data you’ve shared.
This statistics finance infographic template is eye-catching, but very simple in terms of design.
What it does well is organize information effectively. Related statistics are grouped together, color-coded and separated by clear and bold headings. When you customize it, you can include your own data sets, apply icons that represent them, use colors that you prefer, and voila! You’ve got your own finance infographic sharing your finance know-how.
Related: 25+ Statistical Infographic Templates to Help Visualize Your Data
14. Corporate finance infographic template

A quality finance infographic design delivers information in layers.
This corporate finance infographic template answers a question with six terms, and then each term has its own breakdown. This is important because the question is answered instantly. Your client can keep reading for a more in-depth understand but they’ve got their answer already.
Customize this infographic in a jiffy to share your own finance insights today.
15. Comparison finance infographic template

You can never understate the value of using comparisons to communicate ideas. It is easier to understand something with relation to something else.
Using comparison captures the whole picture, but helps you understand the smaller parts at the same time. If you’re helping to guide a decision-making process, presenting finance information using this template is a great start.
Finance infographics FAQ
1. What is a finance infographic?
A finance infographic is a simple infographic that uses icons, charts and diagrams to present financial information to a range of audiences. You can convey financial data, financial processes, financial concepts and plenty more.
2. How do I create a finance infographic?
First, choose a finance infographic template in the Venngage infographic templates library. Customize the color, text and icons to help you visualize your idea in the online editor. Then download it as a PNG or PDF to share with your audience.
3. Why do I need to use a finance infographic?
A finance infographic is a versatile infographic that lets you communicate a range of financial information. Financial infographics are a great way to connect with your broader online audiences, demonstrate your expertise to clients, or communicate important information to the company.
Need to make a finance infographic? Start creating in seconds with our professional templates and simple online editor.


