
Financial CFO Research Comparison Wheel Infographic Template
Compose a modern financial infographic and more by customizing this Financial CFO Research Comparison Wheel Infographic Template

 100% customizable templates
 Millions of photos, icons, charts and graphics
 AI-powered editing features
 Effortlessly share, download, embed and publish
 Easily generate QR codes for your designs
- Design stylemodern
- Colorslight
- SizeTabloid (17 x 11 in)
- File typePNG, PDF, PowerPoint
- Planbusiness
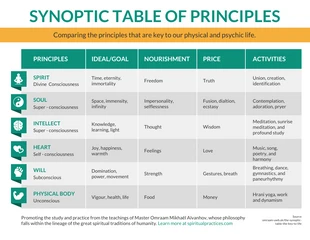
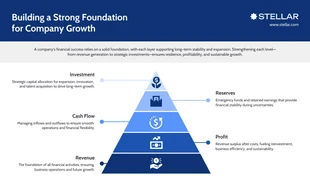
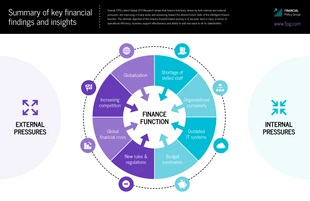
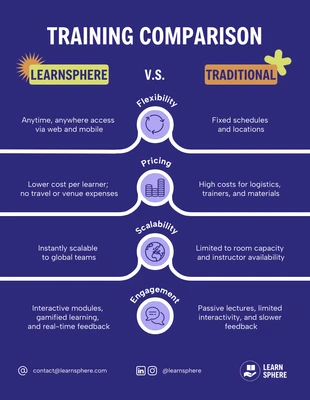
Make a trendy comparison wheel infographic and more with this customizable Financial CFO Research Comparison Wheel Infographic Template. Incorporate icons, add a bright color palette, and insert shapes for a unique infographic! Visually communicate the content of your comparison wheel by using icons. There's thousands of eye-catching icons in the Venngage gallery and you can resize and adjust their colors for more personalization options. Another way to customize the Financial CFO Research Comparison Wheel Infographic Template the way you want is by applying a bright color palette. Bright colors will hold the reader's attention and it's easy to make your own color scheme, or you can apply one of Venngage's automated bright color palettes. Finish your infographic design by adding shapes to not only frame the icons, but in the background as well. Venngage has a wide range of shapes from circles to hexagons, so don't hesitate to try out different shapes until you get the perfect look for your infographic. Begin modifying the comparison infographic now!
Related Infographic Templates
comparison infographics

comparison infographics
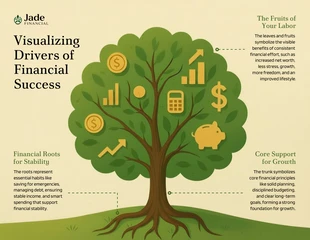
tree infographics
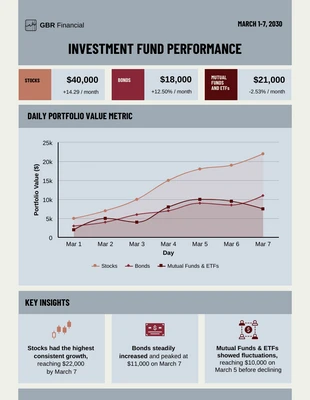
finance infographics
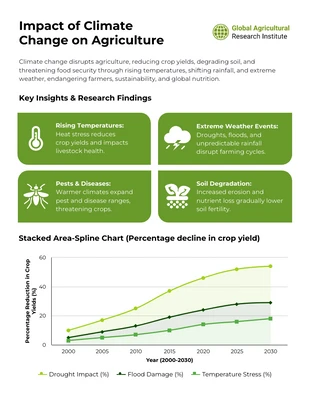
research infographics
finance infographics
finance infographics
research infographics
comparison infographics
comparison infographics
comparison infographics

research infographics