
Colorful Emoji Research Infographic Template
A well-designed research infographic is an excellent way to assist the audience grasp and digest all information. Sign up and customize our template.

 100% customizable templates
 Millions of photos, icons, charts and graphics
 AI-powered editing features
 Effortlessly share, download, embed and publish
 Easily generate QR codes for your designs
- Design stylefun
- Colorsvibrant
- SizeCustom (816 x 2600 px)
- File typePNG, PDF, PowerPoint
- Planbusiness
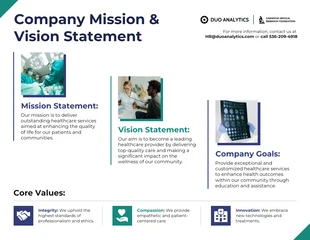
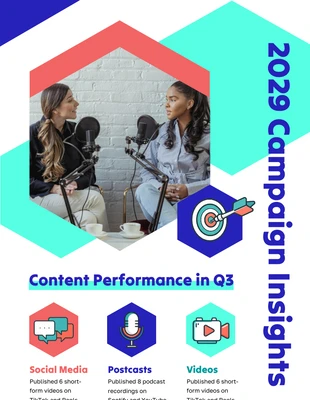
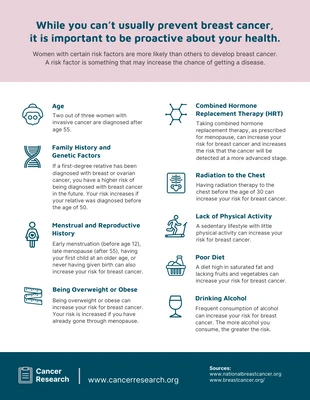
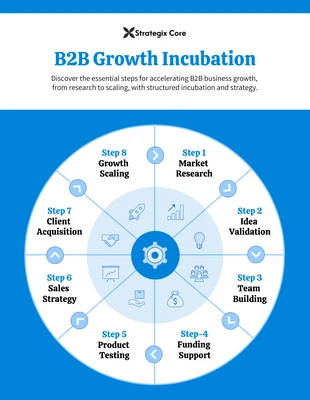
A research infographic is a visual representation of information. It can be used to describe the data, as well as help users understand and interpret it. This kind of infographic is useful for visualizing data and making it easier to digest. They can also help you identify patterns in your data, which can be useful if you're looking for ways to improve your business or organization. Research infographics are great for communicating research results to non-expert audiences because they make complex ideas accessible using visuals that everyone can understand. They're also great for sharing information internally with co-workers and colleagues who may not have time to read long reports or articles; they can quickly get up to speed on what's happening without having to read through lots of text first. Anyone who needs to communicate information about their business or organization—from managers looking for ways to improve performance at work down to front-line employees who need access to important company documents—can use this infographic! Venngage research infographic will guide you through the entire process of creating a visually appealing infographic or data visualization
Related Infographic Templates
human resources infographics
marketing infographics
list infographics
circle infographics
timeline infographics
research infographics

informational infographics
marketing infographics
research infographics
marketing infographics
research infographics
research infographics