


Forms and charts are among the most persistent accessibility challenges for higher education, government, and enterprise teams. A form can look perfectly usable while being nearly impossible to complete with assistive technology. A chart can communicate data clearly to sighted users while offering nothing to someone using a screen reader and the problem usually isn’t discovered until after publication.
Most organizations have accessibility policies, yet backlogs keep growing because accessibility is treated as a remediation problem rather than a creation problem. By the time anyone asks whether a form or chart is accessible, it’s already published, triggering costly PDF tagging, alt text creation, and accessibility audits that could have been avoided entirely.
This guide covers how to create accessible forms and charts from the start, the most common barriers, and how to reduce dependence on remediation altogether.
Why PDF remediation doesn’t scale
Most accessibility workflows today look something like this:
- Create the document.
- Publish the document.
- Send it to an accessibility specialist.
- Remediate accessibility issues.
- Republish the document.
For a small number of documents, this is manageable. For organizations publishing hundreds or thousands of PDFs every year, it breaks down quickly.
Consider the types of documents produced by higher education and government organizations:
- Course materials
- Student handbooks
- Annual reports
- Public notices
- Policy documents
- Community outreach materials
- Budget reports
- Grant applications
- Surveys and forms
Every document introduces potential accessibility issues, and the more content an organization produces, the larger the remediation backlog becomes.
This creates compounding challenges across three areas:
Increased costs
Remediation requires specialized expertise, and organizations often need accessibility consultants, PDF remediation software, and manual quality assurance reviews, with each additional document adding to the overall bill.
Delayed publishing
Accessibility reviews that happen at the end of the process mean teams have to wait for remediation before documents can go out.
Inconsistent results
Even with dedicated remediation teams, outcomes vary depending on document complexity, staff expertise, and available resources. The result is a workflow that’s difficult to sustain at scale, which is why building accessibility into document creation from the start is the more practical path.
What makes a form accessible?
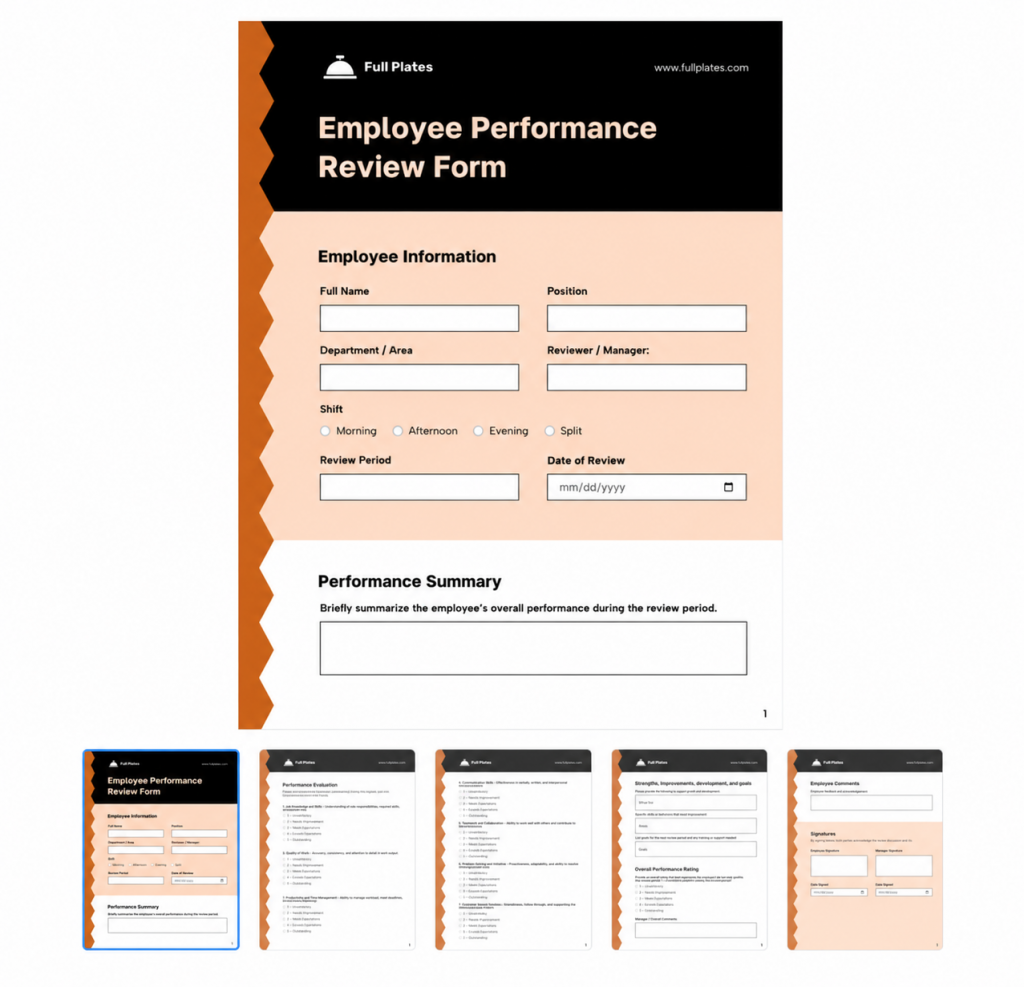
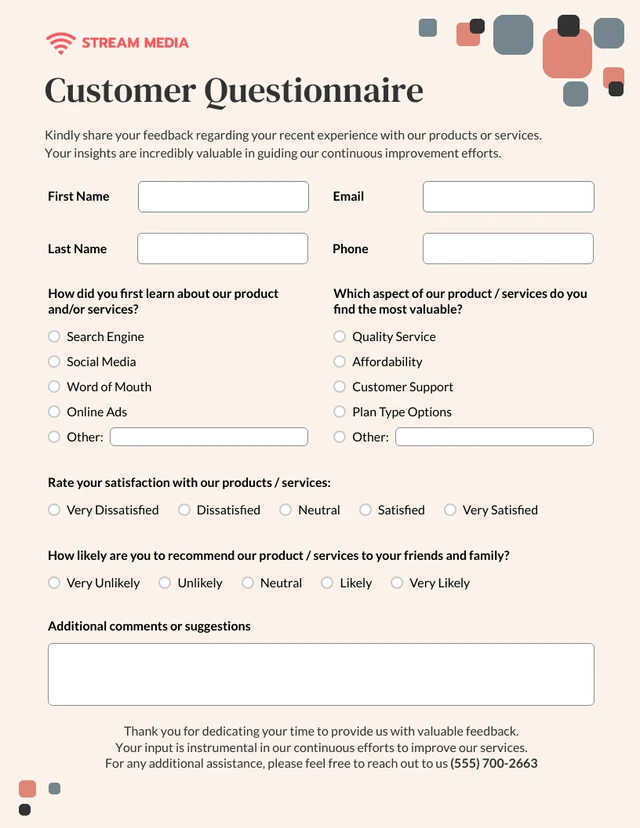
Forms are among the most important documents organizations publish, used for applications, registrations, student services, government services, surveys, and public feedback. They’re also among the most common sources of accessibility failures. A form can look perfectly usable visually while being nearly impossible to complete with assistive technology.
Clear labels
Every form field needs a clear, specific label that tells the user exactly what information is required. A field labeled “Name” leaves room for ambiguity, while “First Name” tells the user precisely what’s expected. For screen reader users, that distinction matters because the label is often the only context they have for a field.
Logical grouping
Related fields should be grouped together so users can understand the relationships between them. For example:
Personal Information
- First Name
- Last Name
- Email Address
Address Information
- Street Address
- City
- State
- Postal Code
Grouping content logically reduces cognitive load and makes forms easier to complete for everyone, including assistive technology users.
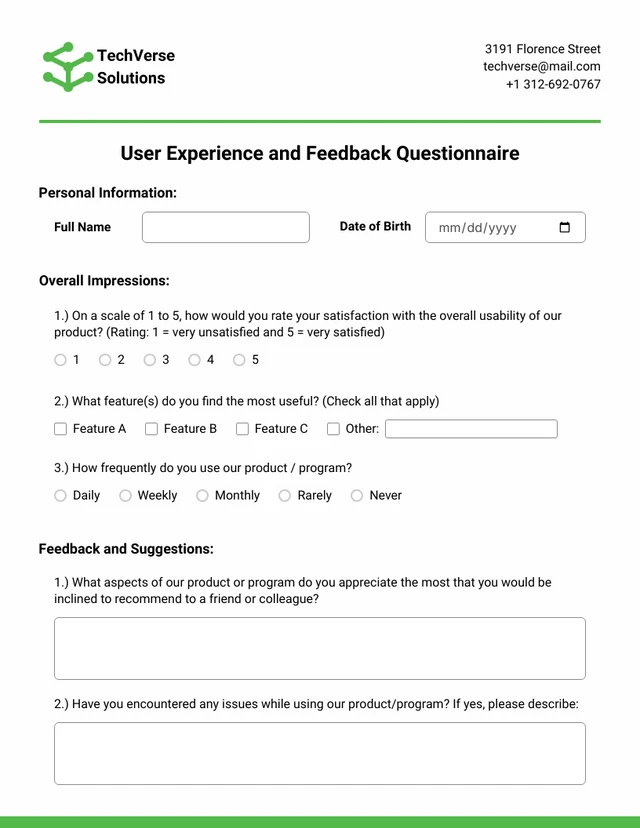
Accessible instructions
Instructions should appear before the relevant form field, not after it. For example, listing password requirements below the password field means users only see them after they’ve already typed something incorrect. Showing those requirements upfront means users know what’s expected before they begin.
Users should be able to complete forms using only a keyboard, with a tab order that follows a logical sequence and matches the visual layout. When tab order and visual layout diverge, keyboard-only users may find themselves jumping between unrelated fields in a sequence that makes the form difficult or impossible to complete.
Sufficient color contrast
Error messages, required field indicators, and instructions all need to meet WCAG color contrast requirements to remain readable. Beyond contrast, many organizations use color as the only indicator of required fields or errors, which creates limitations for users with color vision deficiencies. Accessible forms use text labels alongside color, so the information is conveyed through more than one channel.
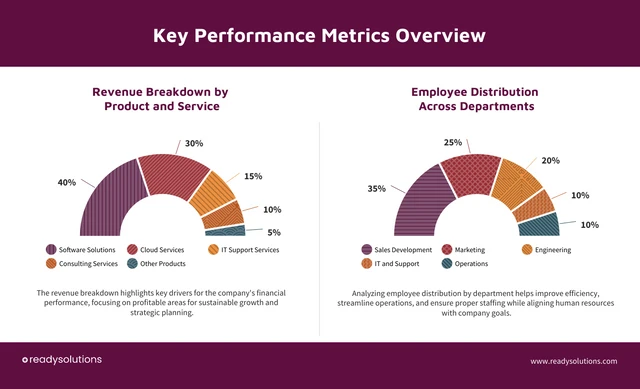
What makes a chart accessible?
Charts present a different kind of accessibility challenge. Unlike forms, charts communicate information visually, and visual information isn’t automatically accessible to screen readers. Organizations need to provide alternative ways for users to understand the data a chart contains.
Alt text for charts
Alt text for charts should explain what the data shows, not just describe what the chart looks like. “Bar chart showing enrollment” tells a screen reader user very little. “Bar chart showing undergraduate enrollment increased from 12,000 students in 2020 to 18,500 students in 2025” gives them the actual information. The goal is to make the data accessible, not just acknowledge that a chart exists.
Chart titles matter
Every chart should have a meaningful title that gives users immediate context. A title like “Chart 1” doesn’t give much information, while “Annual Undergraduate Enrollment Growth (2020–2025)” tells the user exactly what they’re looking at before they engage with the data. The title is often the first thing a screen reader announces, so it carries more weight than it might seem.
Data labels improve accessibility
Charts that rely solely on visual interpretation create barriers for users who can’t perceive spatial positioning, color, or shape differences. Adding data labels directly to chart elements means users can understand values without needing to interpret the visual format, which makes the information accessible regardless of how it’s being accessed.
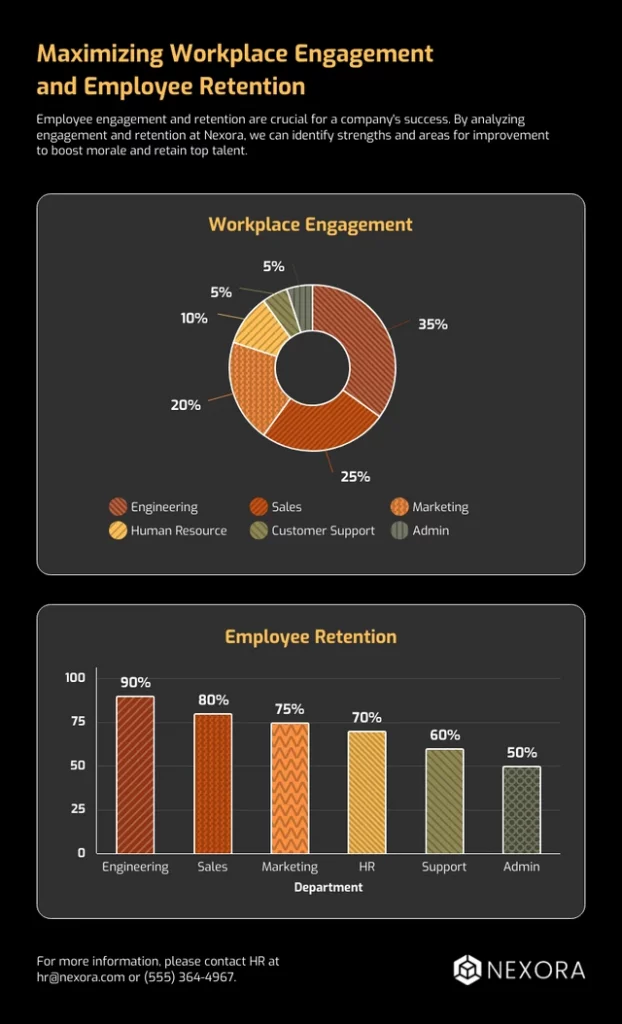
Patterns are better than color alone
One of the most common chart accessibility mistakes is using color as the only way to distinguish categories.
For example:
- Red bar = Category A
- Green bar = Category B
This can create problems for users with color blindness.
Combining color with labels, patterns, and shapes means information is communicated through multiple channels, making it interpretable for a much wider range of users.
Building accessibility in from the start
A form that can’t be completed with a keyboard isn’t a form for everyone. A chart that relies on color to communicate data isn’t a chart for everyone. Accessibility in these document types comes down to a simple question: can every user get the information they need, regardless of how they access it? When the answer is no, the problem rarely lies in the document itself. It lies in a creation process that didn’t account for accessibility from the start. Getting that process right means fewer barriers, less remediation work, and documents that do what they’re supposed to do, reach everyone they were made for.
Watch the recording of the training session: How to Create Accessible Forms and Charts


