Each day, we make hundreds of decisions. What should we eat? What clothes should we wear? Do we really need that ice cream after dinner?
Our instincts guide in these situations, but in project management or business, you need more than intuition to make informed decisions. You need a method to evaluate risks and potential outcomes.
Flowcharts are ideal for this, but they’re hard to make. And although Google Docs does allow you to make flowcharts, it’s not the most efficient method.
In this post, I’ll show you how to make flowcharts in Google Docs and then reveal a better way to make flowcharts using a Flowchart Maker and flowchart templates.
Click to jump ahead:
- How to make a flowchart in Google Docs
- Does Google Docs have flowchart templates?
- How to create a flowchart in Venngage
- Conclusion
To create a flowchart in Google Docs, follow these steps:
- Open a Google Doc
- Select “Insert” > “Drawing” > “New”
- Use the shapes icon to add flowchart shapes
- Use the lines feature to connect flowchart shapes
- Add text to your flowchart
- Customize your flowchart
- Click Save and Close
If you want a detailed step by step guide of this process (with visuals), continue reading.
A step by step explanation to create flowcharts in Google Docs
The benefit of creating a flowchart in Google Docs is that well Google is free and your flowcharts will sync across the entire Google ecosystem.
For example, a flowchart made in Google Docs can easily be recycled in Google Sheets or Google Slides or even PowerPoint without much hassle.
But the downside is that the flowchart creation process in Google Docs manual and unless you have great design skills, you’ll probably be only to make a basic flowchart.
Even then you need time and patience to draw and align shapes (just imagine how difficult this is when you have flowcharts multiple branches and/or paths).
Here’s a step-by-step walkthrough on how to create flowcharts in Google Docs.
Step 1 – Open a Google Doc
To make a flowchart in Google Docs, open a “Blank document“.

If you already have a document open, click on the “File” tab > “New” > “Document” to get a blank canvas.
Step 2 – Open Google’s drawing option
Although Docs is a text-processing software, you can use it to create a flowchart using the in-built Shapes tool.
Open Google’s drawing tool by clicking on “Insert” from the drop down menu and select the “Drawing” option and then “New”.
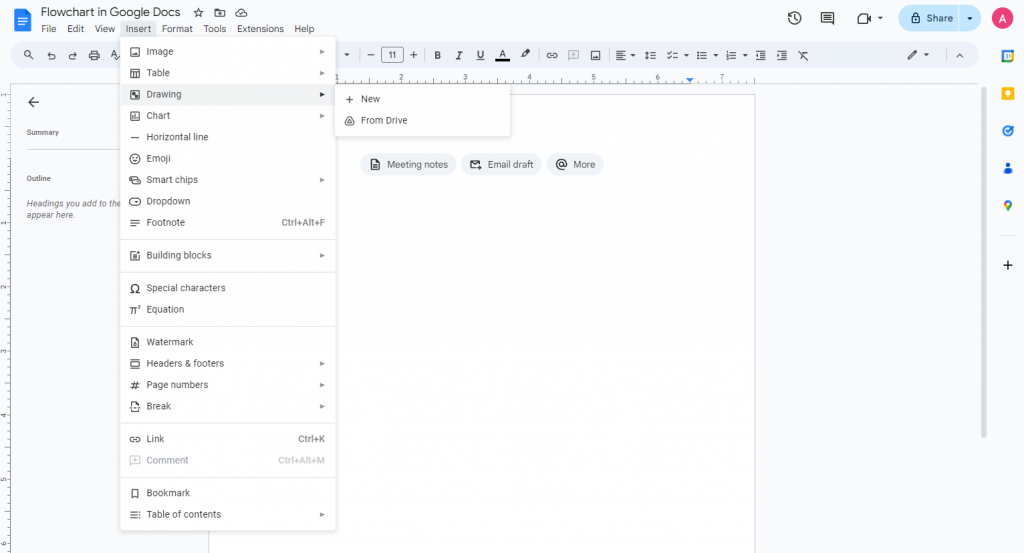
Note: Google Docs does not offer flowchart templates, so you’ll have to create a flowchart manually.
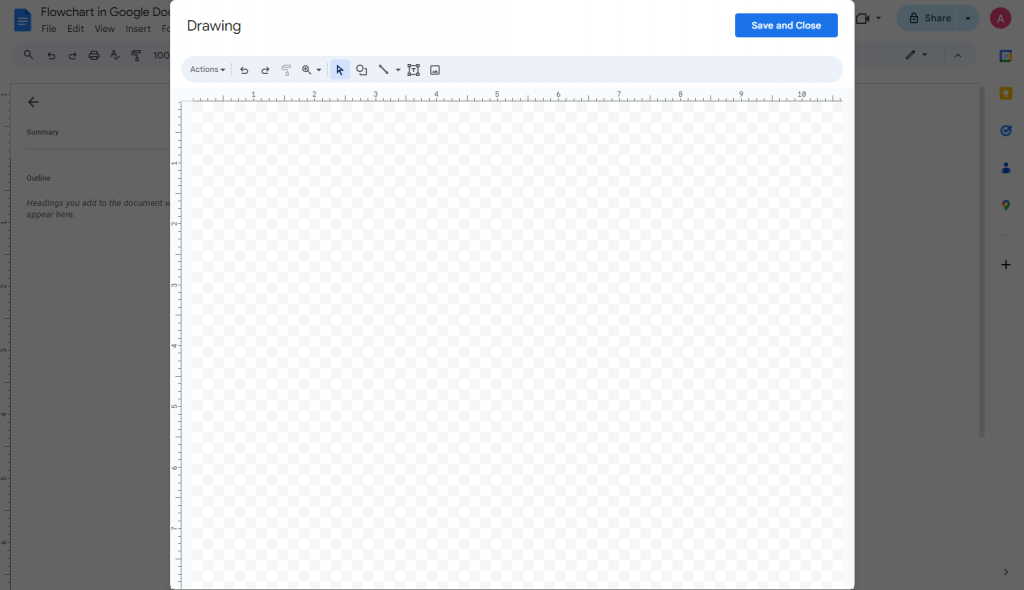
This is the canvas where our flowchart will take shape.
Step 3 – Use the shape option to create flowchart structure
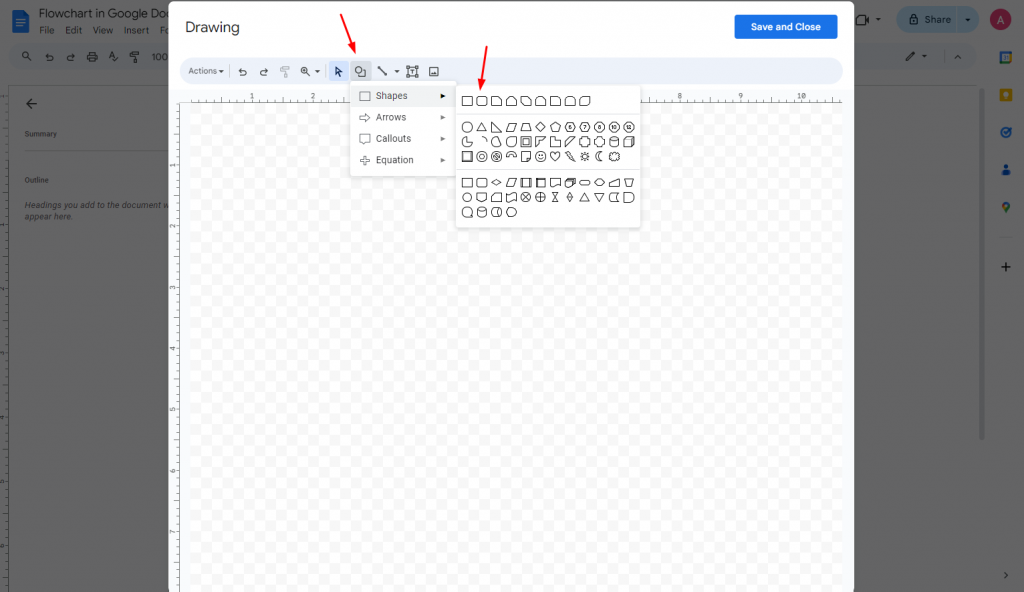
In the drawing panel, find the Shapes option.
A common shape you’ll need is the flowchart terminator or terminal symbol, which is essentially a rounded rectangle. This is used to indicate the start or end of a process in a flowchart.
Other flowchart shapes that Google Docs offers include rectangles, diamonds, squares, triangles and more.
Each flowchart shape has a distinct meaning. Here are five common flowchart shapes and their meaning:
- Oval: This shape represents the start and end points of a flowchart.
- Rectangle: This shape denotes an instruction or action.
- Diamond: The diamond is used to represent a decision point in a process.
- Parallelogram: This shape is used to highlight inputs and outputs.
- Arrows: Arrows are used to show the flow of the process and connect one step to another.
Related: Flowchart Symbols and Meaning: A Complete Guide.
I added a few shapes (oval, rectangles, and diamond) to create the basic structure of my flowchart.
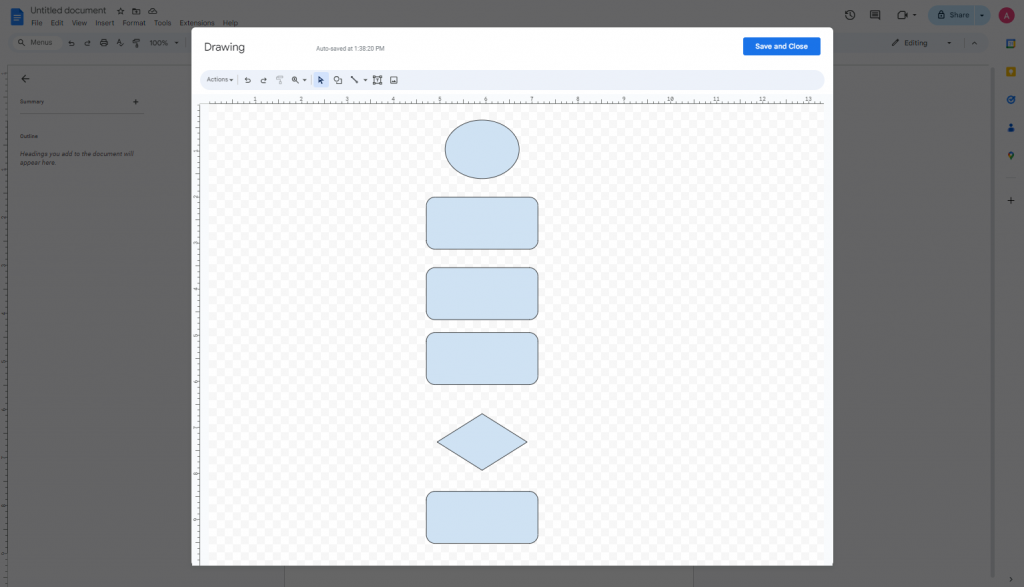
The diagram is beginning to take shape but there’s still a few things I need to add before it’s ready to be shared.
Step 4 – Use lines and arrows to connect your shapes
Arrows or flowlines connect different elements of your flowchart and are a key tool in helping guide readers through a process or flow of information.
Without them, a reader might not be able to tell which step comes first.
To add connector lines, click the “Line” tool in the drawing toolbar and select “Arrow”.
Google Docs will give you a few options such as line, arrow, elbow connector, and more. Choose the appropriate type for your use case.
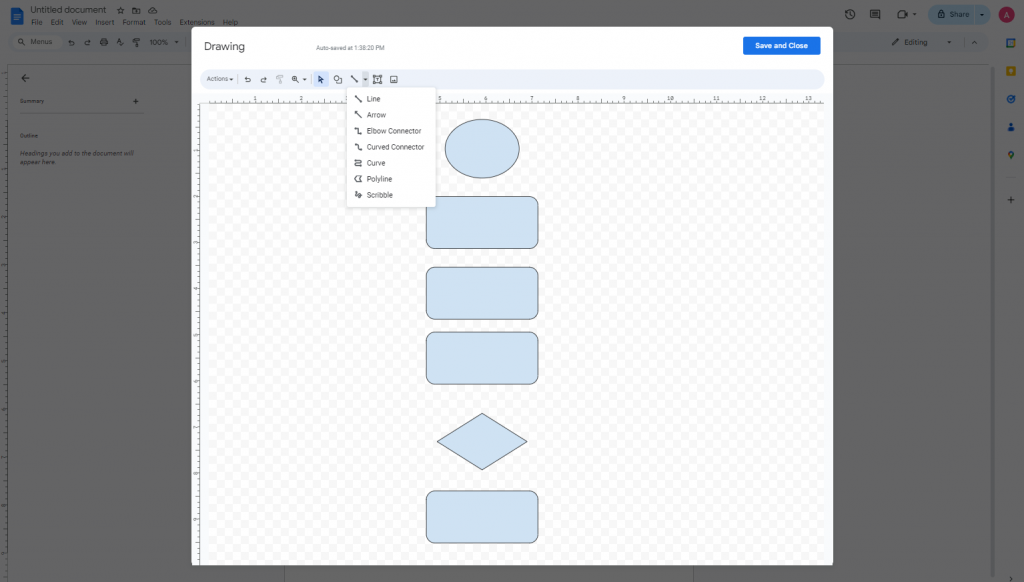
Here’s how my Google Docs flowchart looks after I add lines and arrows.
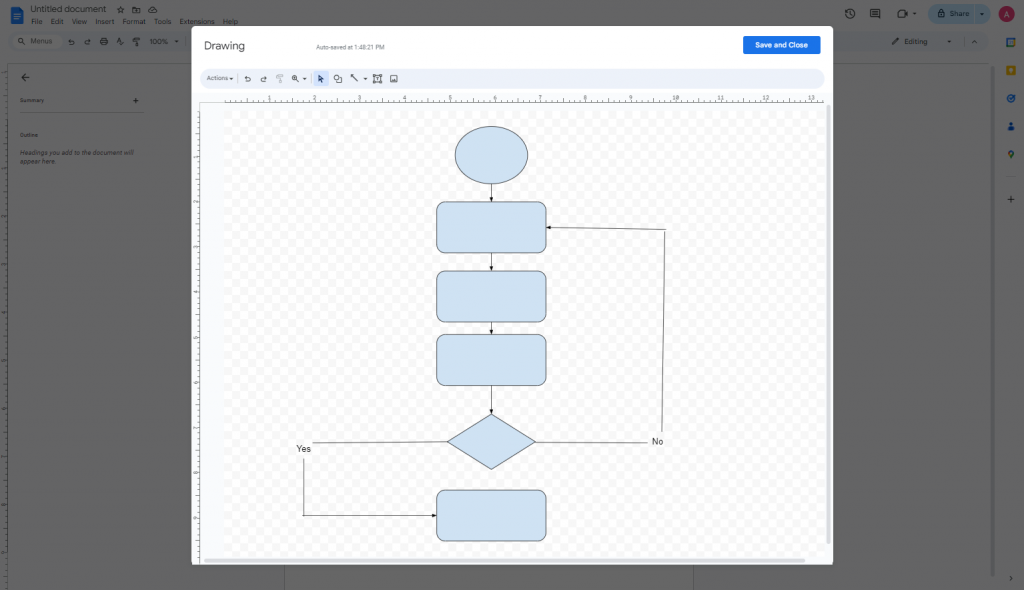
Step 5 – Add text to your flowchart
To complete my flowchart, there’s one more thing I need to do.
I have to add text to explain what each shape represents. The text can be anything from instructions or a description of a process.
To add text to your flowchart in Google Docs, select a shape and then click on the “Text Box” option.
Here’s how my flowchart looks after adding text
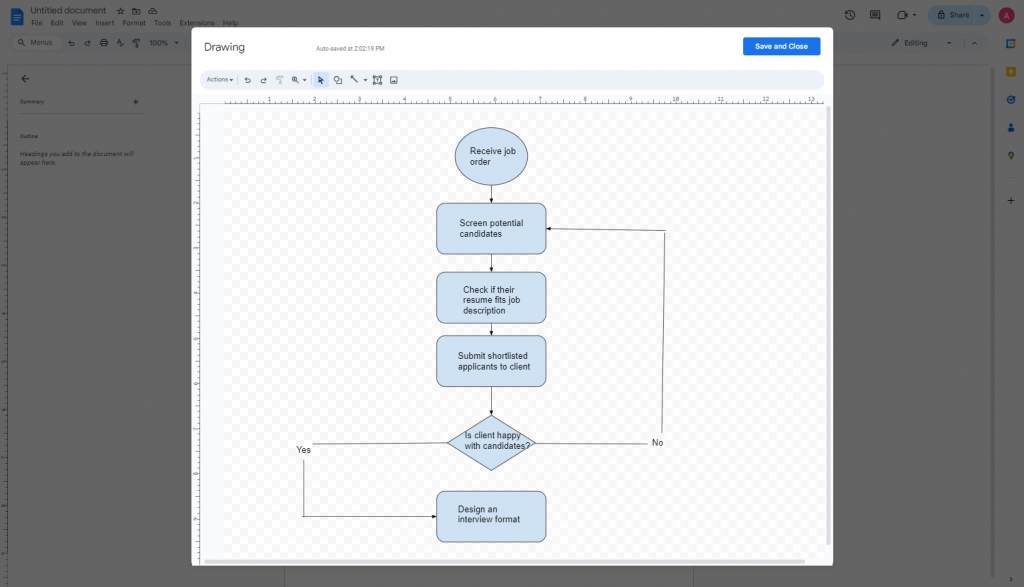
I suggest you copy paste text boxes to keep them the same size and format.
Step 6 – Customize your flowchart
Though there’s nothing wrong with the flowchart I have so far, a little styling never hurt anyone.
In my example, I made the decision point in the process a different color from the rest of the steps and the start point.
This minor customization means readers now have a visual cue they can use to easily pinpoint specific points in a flowchart.
Though this may not seem important in this example, it can make a BIG difference in larger flowcharts.
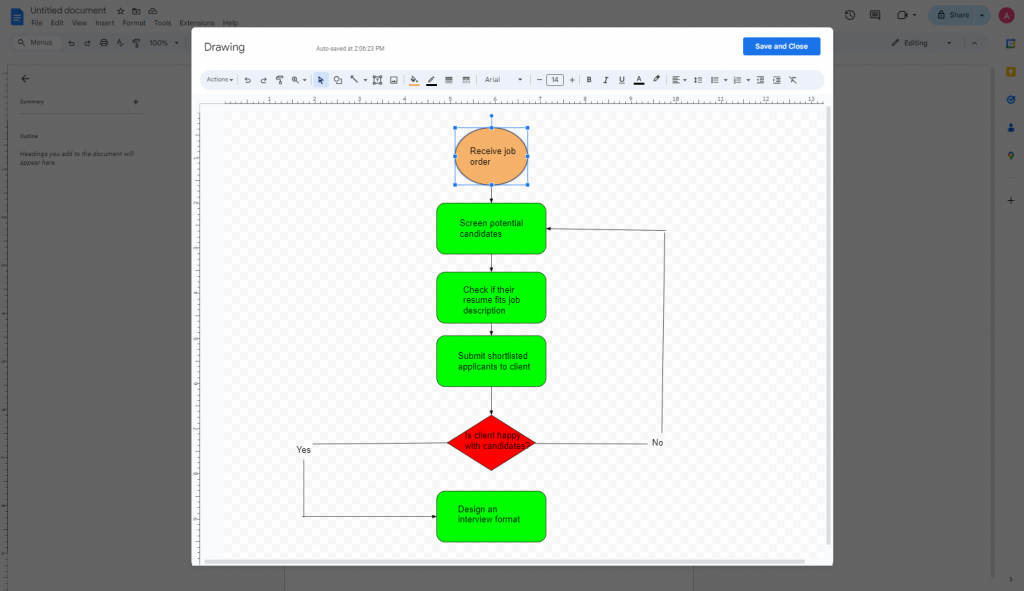
Other customization options include changing the font type, text size, and shape colors of a flowchart to make it more appealing.
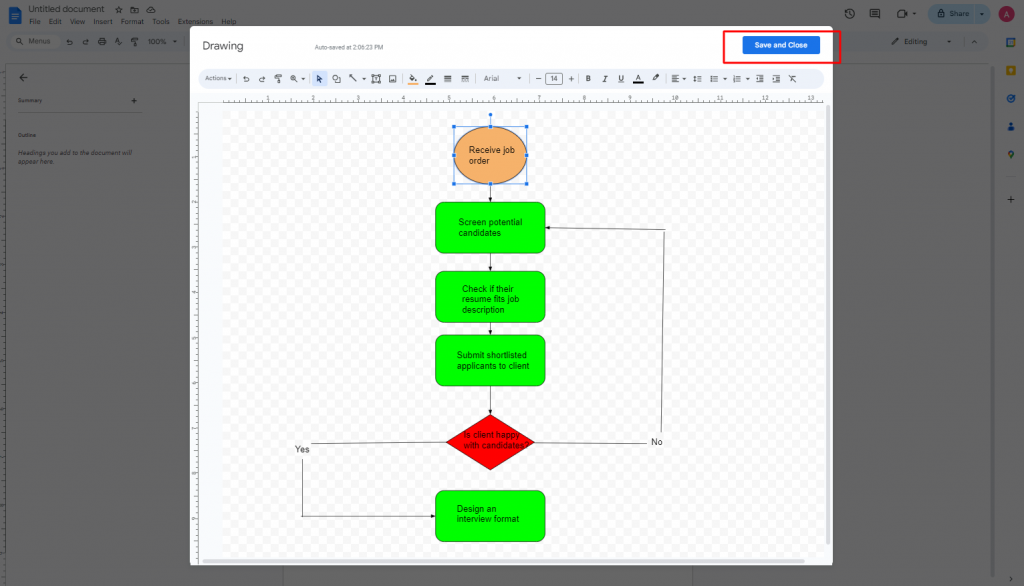
Step 7 – Save and close
To save your Google Docs flowchart, you need to select the “Save and Close” button in the Drawing toolbar.
If you close Google Docs before doing this, you’ll lose your flowchart because Docs won’t actually insert the flowchart into the document.
So make sure you don’t forget to do this!
By the way, the inspiration for my flowchart came from a Venngage flowchart template. Which one do you think is more effective visually?
Want to learn more about flowcharts and other tools you can use to make one? Check out these posts:
Does Google Docs have flowchart templates?
No, Google Docs does not offer flowchart templates. If you want to create a flowchart in Google Docs, you’ll have to create it from scratch.
This might be enough for simple flowcharts, but for complex flowcharts with multiple steps or shapes, Google Docs is a bad option.
I recommend using Venngage instead. It’s a simple and powerful design solution for business communications that’ll help you make better flowcharts faster.
Note: Some of our flowchart templates are free to use and some require a small monthly fee. Sign-up is always free, as is access to Venngage’s online drag-and-drop editor.
How to create a flowchart with Venngage
If you need to make a flowchart, the last thing you want to do is stress about design.
After all, the purpose of flowcharts is to help you optimize a process and/or make important decisions, and not figure out how to become a designer.
And though there’s nothing wrong with using Google Docs to make a flowchart, especially if you need a simple one with little moving parts, you will need some design skills like making sure shapes and lines align.
You’ll also be limited in terms of customization options to make flowcharts more visual and engaging.
Fear not though! Venngage can help you produce professional flowcharts like the one in the example below without any design skills.
Step 1 – Sign up for a Venngage account (it’s free!)
Sign up for a Venngage account using your email, Gmail or Facebook account.
Step 2 – Browse to our “Diagram” category
Our flowchart templates can be found in “Diagram” section of our templates page.
Browse to the “Diagrams” template page and then select the “Flowchart” subcategory.
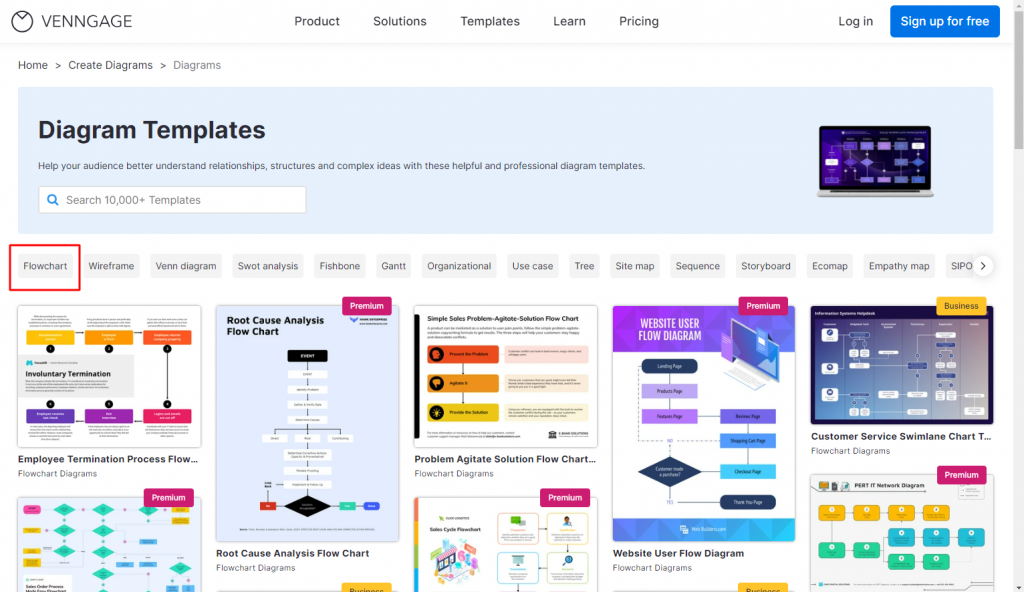
You can find several types of flowcharts on Venngage from process flowcharts to swimlane flowcharts and even workflow flowcharts.
Step 3 – Edit your flowchart
Venngage templates are easy to customize and a better way to create more appealing flowcharts quickly.
I’ll show you how easy it is to edit a Venngage flowchart template in this example.
Want to change the circles to squares? You don’t need to delete, re-insert, and align everything again.
Venngage lets you select a shape and replace it without any design work from your end.
Here’s how it was before:
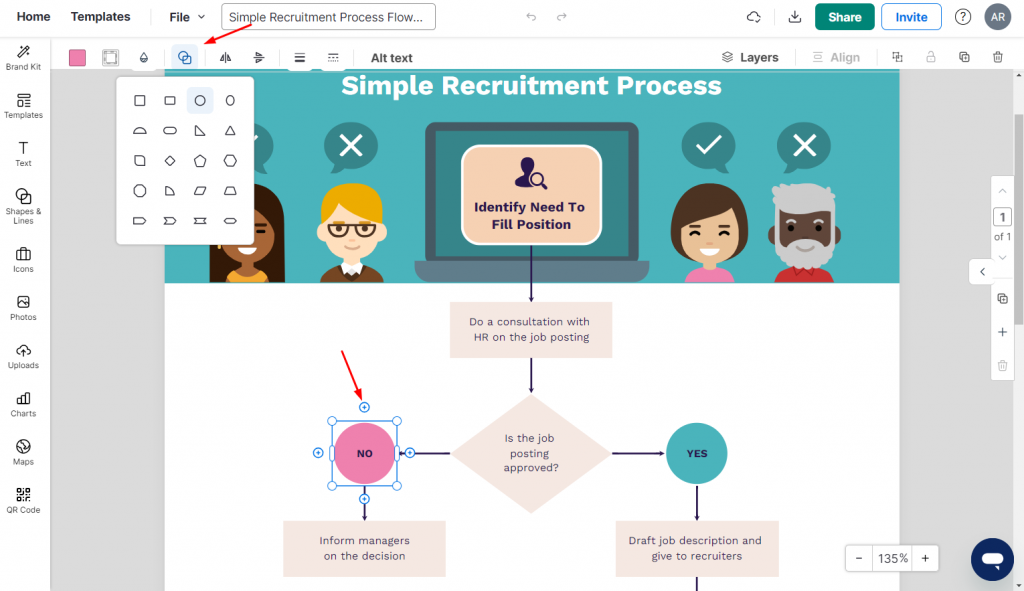
And how the changes reflect in my flowchart:
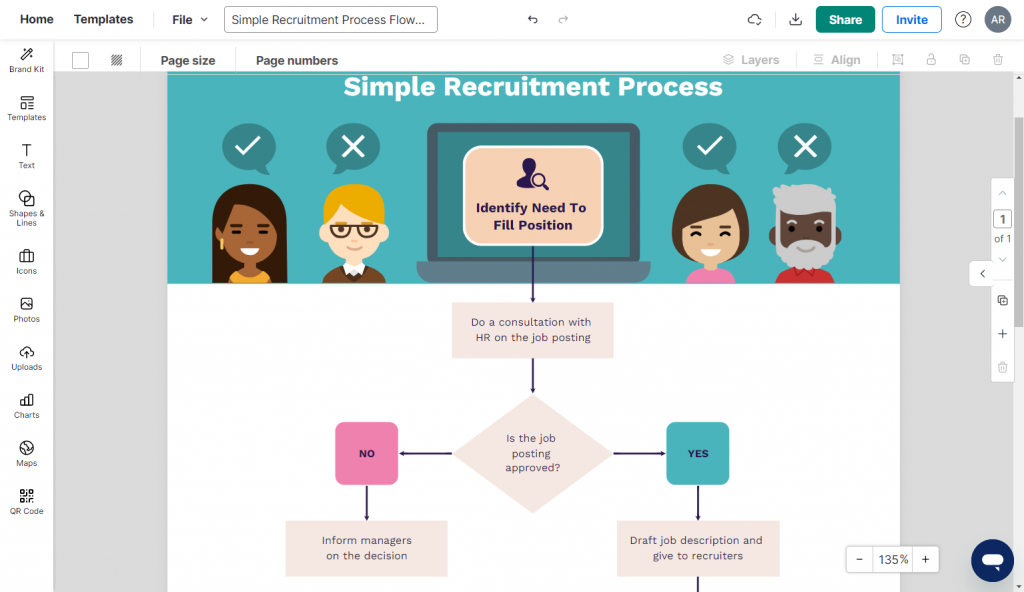
You can apply the same process to replace icons, images, and more.
Our in-editor library has thousands of free, professional stock images, plus diverse images to choose from.
Here are some more flowchart templates you can edit.
This flowchart depicts a a sequence of steps that conclude with a check for solution acceptability. If the solution is not acceptable, the process loops back for re-evaluation.
This flowchart illustrates the stages of a sales cycle and is a great template to edit if you’re a sales manager looking to optimize processes or educate teach new team members on what they need to do.
This flowchart outlines the recruiting process workflow. You can use it as a template to map out your own workflows within a team or department.
By the way, while flowcharts are great for project cycle management and process improvement, they’re also very useful in infographics as an educational tool.
Here’s a process infographic that uses a flowchart to explain the health insurance process.
Another big benefit of creating flowcharts in Venngage is that our editor includes an in-built accessibility checker.
You can test your flowchart for factors like color contrast and more to ensure people living with impairments can understand your designs.
To test your design click on “File” > “Accessibility” to get access to the accessibility checker.
Using the example from earlier, here are the results:
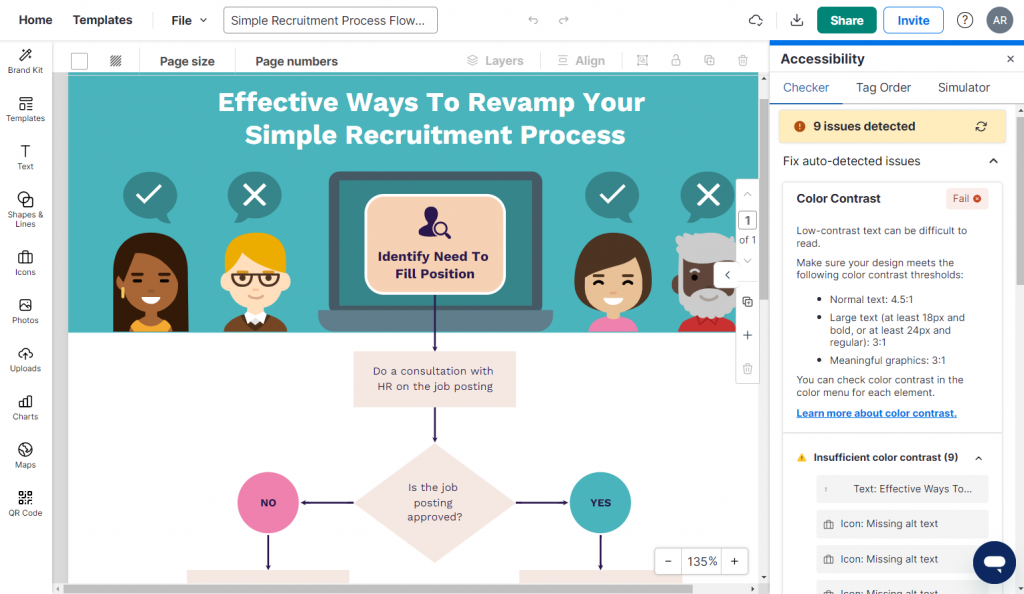
Venngage not only tells you if a design passes/fails, but where the issues are, if any.
Step 4 – Share a link to your flowchart for free or download it
Once you have a flowchart design you’re happy with, it’s time to share it.
If you’re on a free plan, you’ll get a link to share your flowchart. To download the flowchart for offline use, sign up for a Business account.
This gives you the ability to download flowcharts PNG, PDF, or even as PPT.
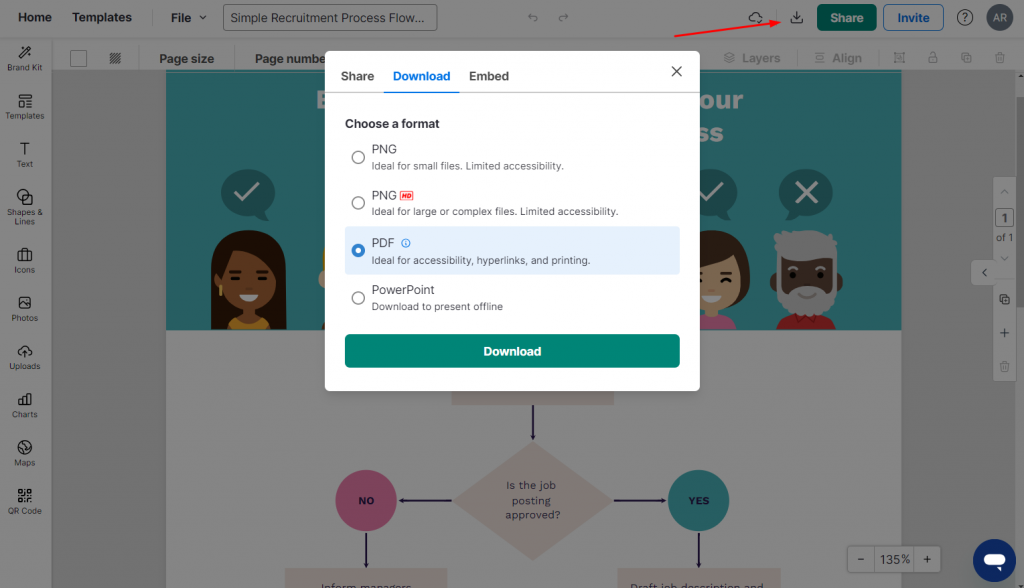
With a Business account, you’ll also get access to My Brand Kit, which lets you apply your brand colors to any template with one click.
Conclusion: Don’t settle for ineffective flowcharts when you can use Venngage to make appealing flowcharts faster
Google Docs can’t handle the complexities of flowcharts for project management or illustrating business processes. Nor does it have any templates for you to work with.
Why waste your time then? Use Venngage templates to create professional flowcharts that’ll enhance communication, elevate project clarity and help you and your team make better decisions.


