


Google Sheets is a powerful spreadsheet tool for organizing data. Besides giving structure to numbers, you can also use it to create charts and graphs to highlight insights and trends.
But what about visualizing workflows and mapping processes…aka creating flowcharts?
Well, it’s possible in Google Sheets and pretty convenient too because the platform can house your data and visualizations in one place.
In this article, I’ll teach you how to make flowcharts in Google Sheets and then show an alternative way with an Online Flowchart Maker and flowchart templates.
To create a flowchart in Google Sheets, follow these steps:
1. Open Google sheets
2. Select “Insert” > “Drawing”
3. Use the “Shapes” and “Lines” tool to draw your flowchart
4. Add text to your flowchart using the “Text Box” feature
5. Customize your flowchart
5. Save your flowchart
I’ll explore each of these steps in detail below with a visual walkthrough, but feel free to skip around!
How to make a flowchart in Google Sheets
Google Sheets is not a specialized tool for creating flowcharts. Instead, what it provides are the basic building blocks to make a flowchart manually.
The good news is that despite being manual, the process is straightforward and easy to follow.
But if you’re short on time or don’t have the patience, creating flowcharts this way can be frustrating and time-consuming, especially if you have a flowchart with multiple steps and/or many branching pathways.
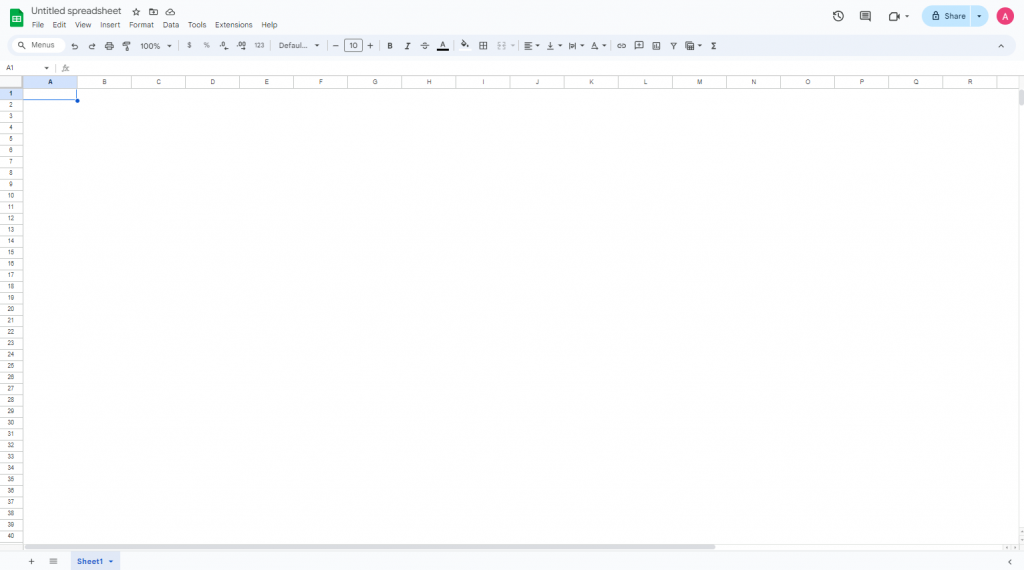
Step 1 – Open Google Sheets
To get started, head over to Google Sheets. When the page loads, you should see an option to create a new spreadsheet.
Click on “Blank Spreadsheet” to load the blank canvas where you’ll create the flowchart.

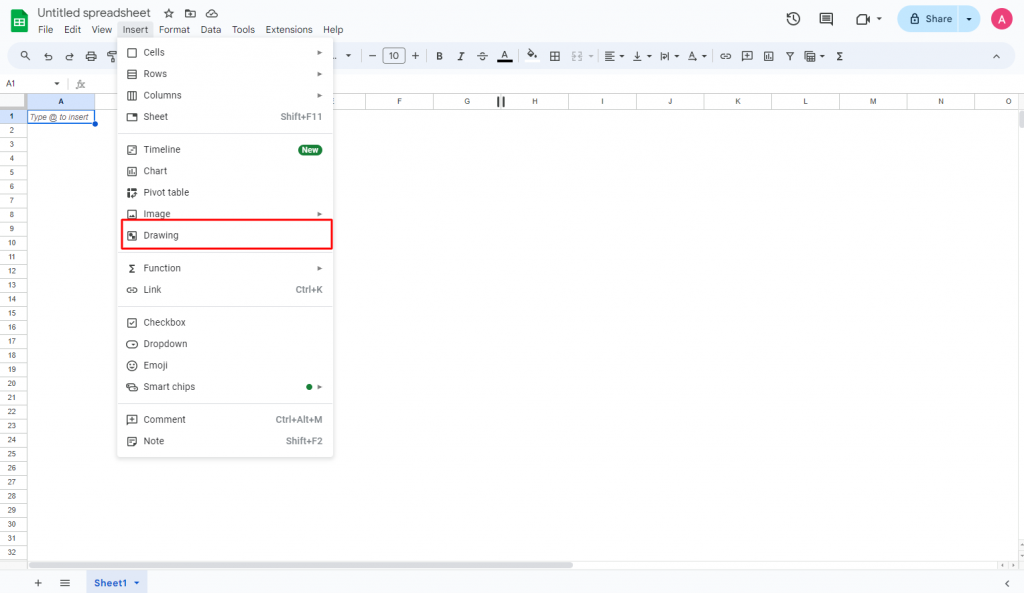
Step 2 – Open Google’s drawing tool option
When your blank canvas loads, it’ll include a page with gridlines because the primary function of Sheets is to help us organize and present data.

Inserting a flowchart on top of gridlines leads to visual clutter and dilutes attention, so it’s good practice to remove the gridlines.
To do this, click on “View” > “Show” and de-select “Show Gridlines”.
Now that our canvas is ready, it’s time to draw our flowchart symbols.
To do this, open Google’s Drawing tool by clicking “Insert” and “Drawing“.
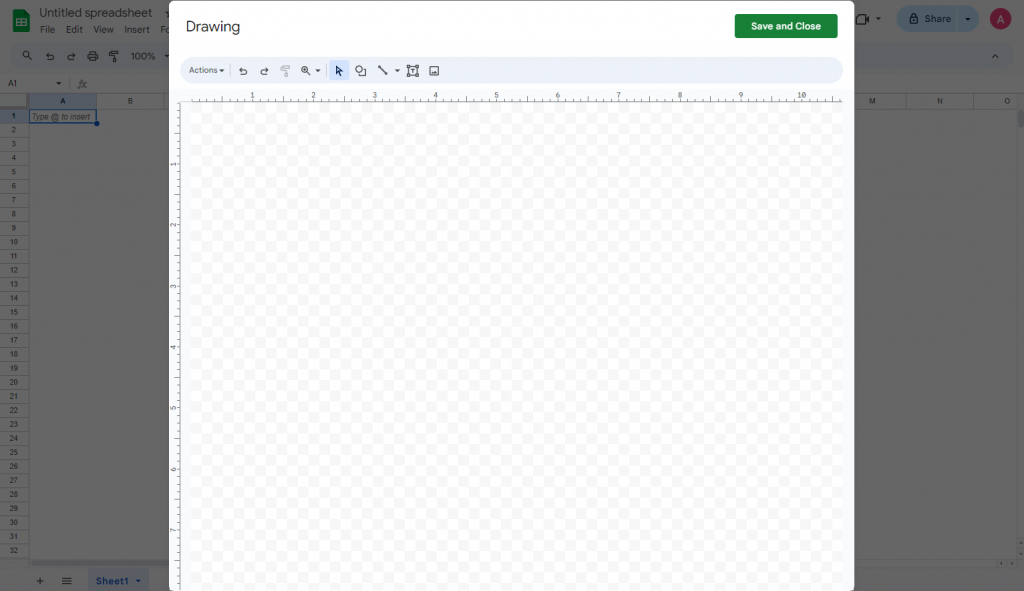
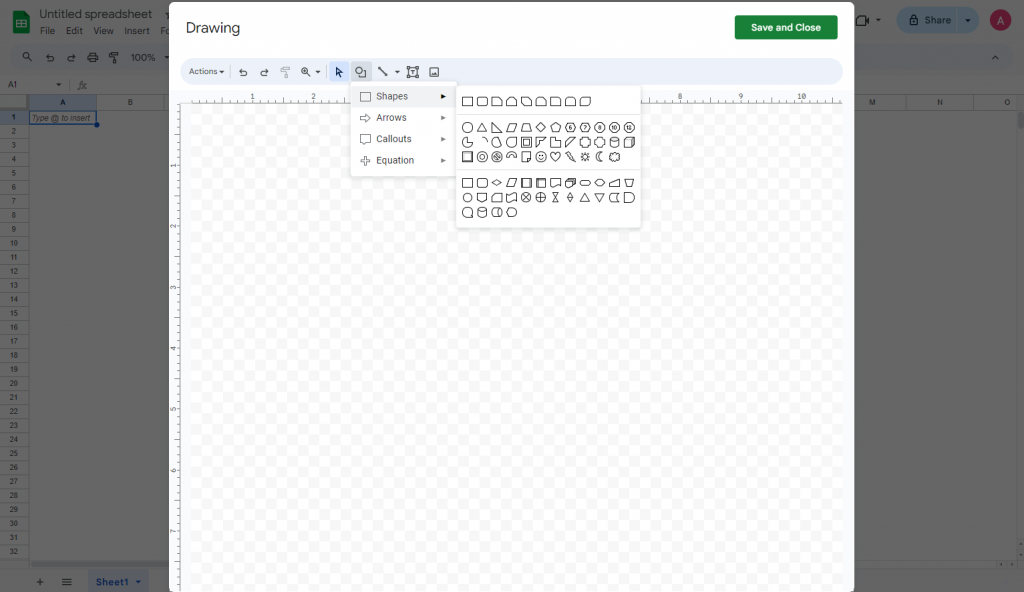
Step 3 – Draw your flowchart structure
Remember that there are no editable flowchart templates in Sheets, so you’ll have to draw a flowchart manually using the provided “Shapes” and “Lines”.
Stressful, right? I know.
Before I continue, let’s recap some common flowchart shapes such as oval, rectangle, arrow, diamond and parallelogram.
- Oval: Used to indicate the start and end of a process.
- Rectangle: Represents a process or action.
- Arrow: Connects shapes and reveals the flow and sequence of steps.
- Diamond: Represents a decision point such as a yes/no scenario.
- Parallelogram: Represents input or output and indicates information entering or leaving a system.
Related: Flowchart Symbols and Meaning: A Complete Guide (2024)
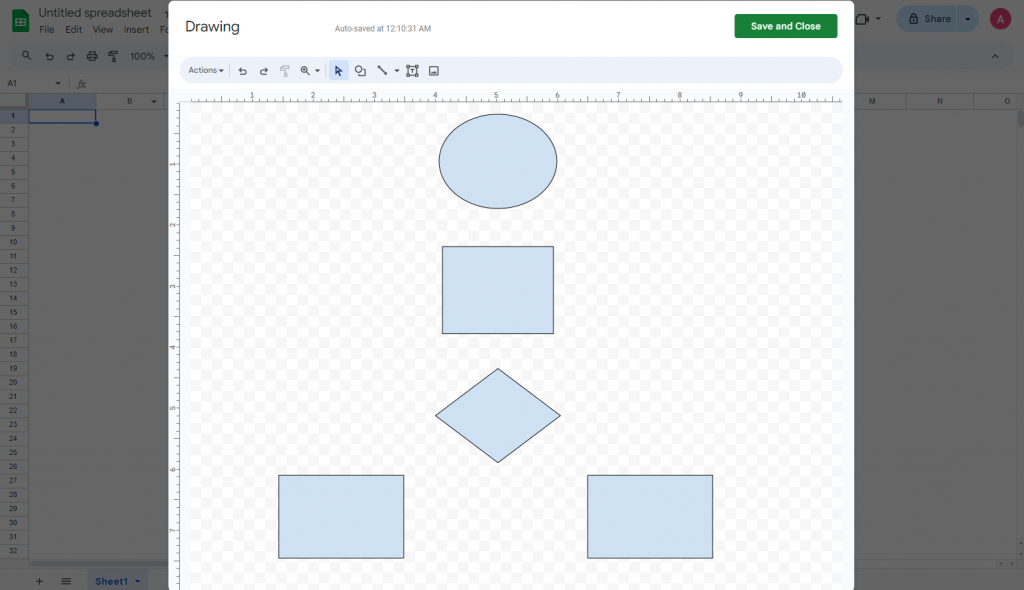
Start by selecting a flowchart shape under the “Shapes” option in the Drawing toolbar.
I chose an Oval, Diamond, and a few rectangles and drew them in.
Note: Google Sheets does help you align each shape into place but it’s pretty rudimentary and not an exact science.
Next, I’ll add arrows and/or lines to connect these shapes. Why are flowchart arrows necessary?
Arrows are a key flowchart component because they guide readers through each step or action. They provide logical flow and ensure people follow the sequence properly.
To add arrows or lines to a flowchart, click on the “Line” option in the toolbar.
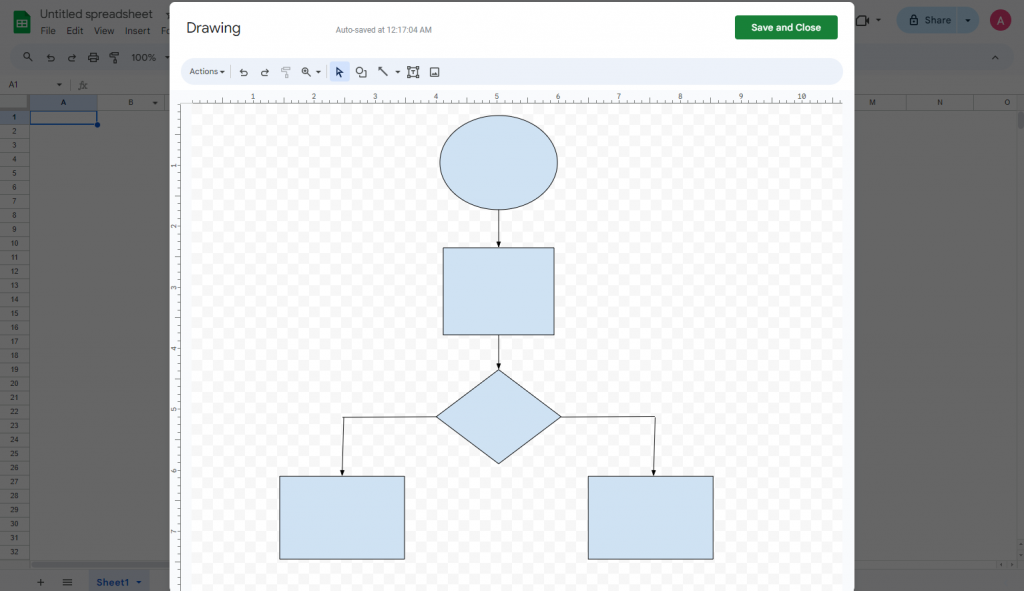
When doing this yourself, you’ll realize how tedious this can get when you have many shapes to connect and align.
Step 4 – Add text your flowchart
Our flowchart is beginning to take shape but it still looks like a bunch of shapes that don’t say much.
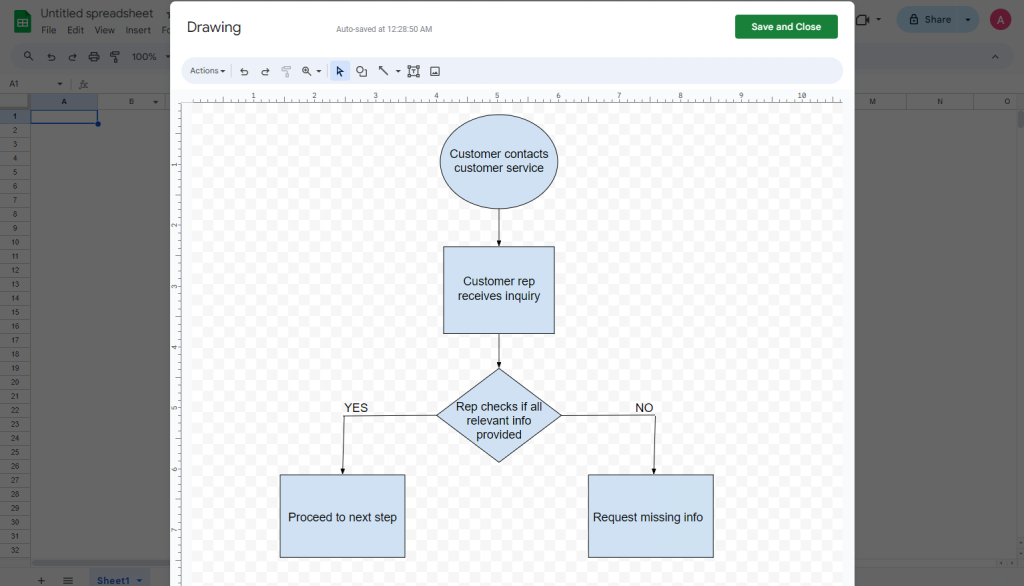
Let’s change that by adding text. To add text, click on a shape and select “Text Box.”
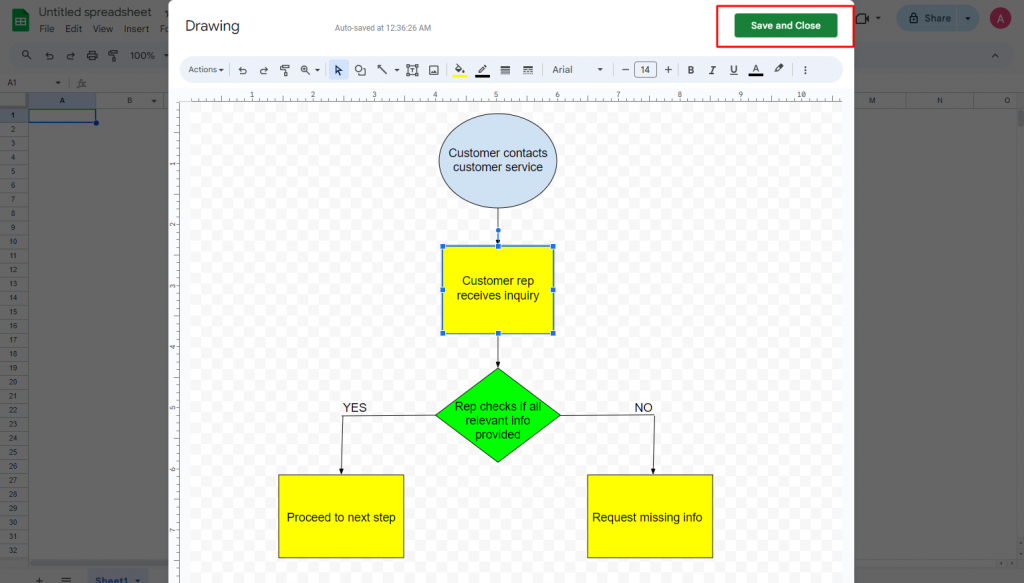
In my example, I mapped out the process a customer representative should follow after receiving a call. Pretty cool, huh?
Step 5 – Customize your flowchart
If you were to hand this flowchart to a customer rep, they’d understand and be able to follow along.
But imagine if you had a flowchart with many more moving parts. If the format was just plain text and each step had the same colors, it’d be hard to get visual clues to identify important sections.
But don’t worry. I’ll show you how to give your Google Sheets flowchart some life and color.
To change the color of a shape in Google Sheets flowchart, select a shape and this should load a toolbar with formatting options like “Select Fill Color“.
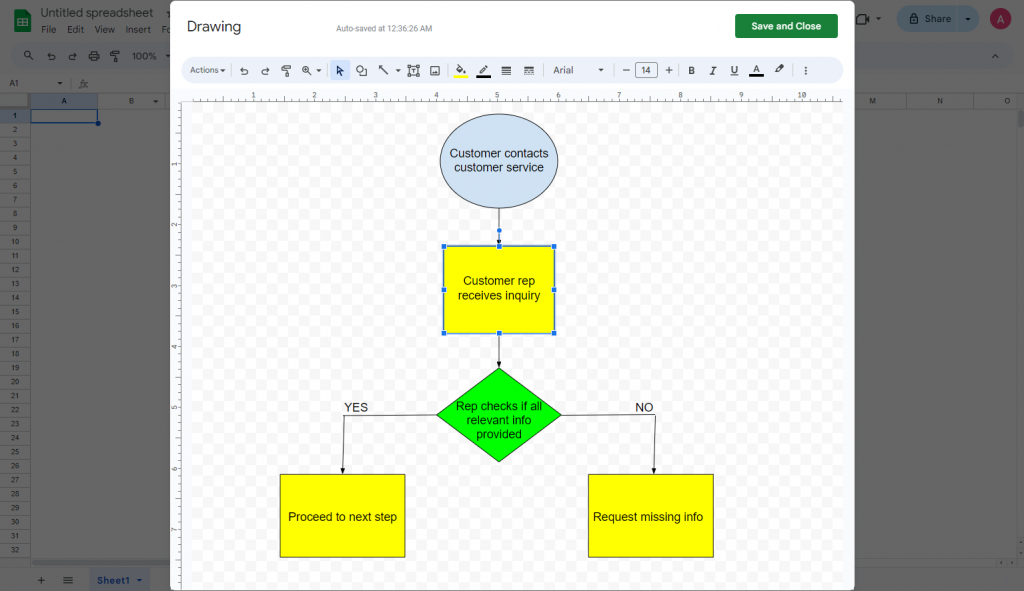
In my flowchart, I used a green to highlight the decision points and yellow for process steps. Other options include ability to change the font, size, color, and style of the text.
Small changes such as these can help differentiate between processes or steps.
Additionally, you can make connecting lines more intuitive by clicking on a line or arrow and using the line color and style options in the toolbar.
Step 6 – Save your flowchart
When you are done designing and customizing your flowchart in the Drawing tool, make sure to click “Save and Close“.
Make sure don’t forget this step!
Google Sheets will autosave your flowchart but until you hit this button, the flowchart isn’t actually in Sheets yet.
Want to learn more about flowcharts and other tools you can use to make one? Check out these posts:
How to create a flowchart with Venngage
If you have time and expertise (and patience!) to create a flowchart from scratch, there’s nothing wrong with Google Sheets.
But I can’t imagine putting together a complicated flowchart this way.
Not only will using Google Sheets be a struggle, but the end product probably won’t be visually appealing due to the lack of customization options.
For example, forget about adding cute graphics to visually communicate or reinforce ideas in Google Sheets flowcharts.
Fortunately, there is a much better way to make flowcharts faster and better with Venngage. Don’t believe me?
Check out this Venngage flowchart template.

Let’s go through the steps on how to create a flowchart like this in Venngage or edit professionally-designed flowchart templates just like this in minutes.
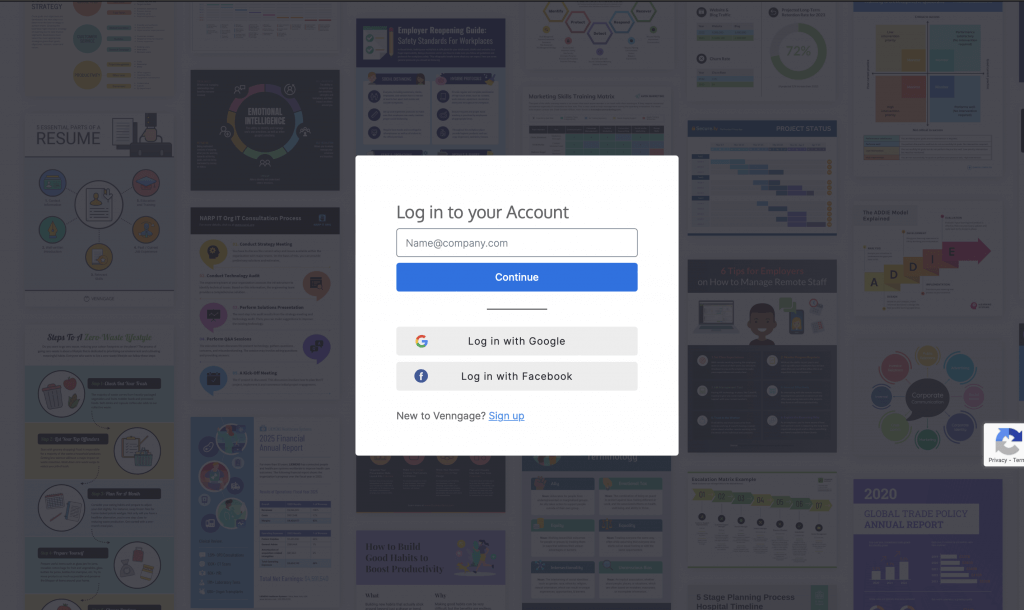
Step 1 – Sign up for a Venngage account (it’s free!)
Sign up for a Venngage account for free. You can use your email, Gmail or Facebook to do this.
Step 2 – Select flowchart templates from our “Diagram” category
On our templates page, find the “Diagram” category, and then select the “Flowchart” subcategory.
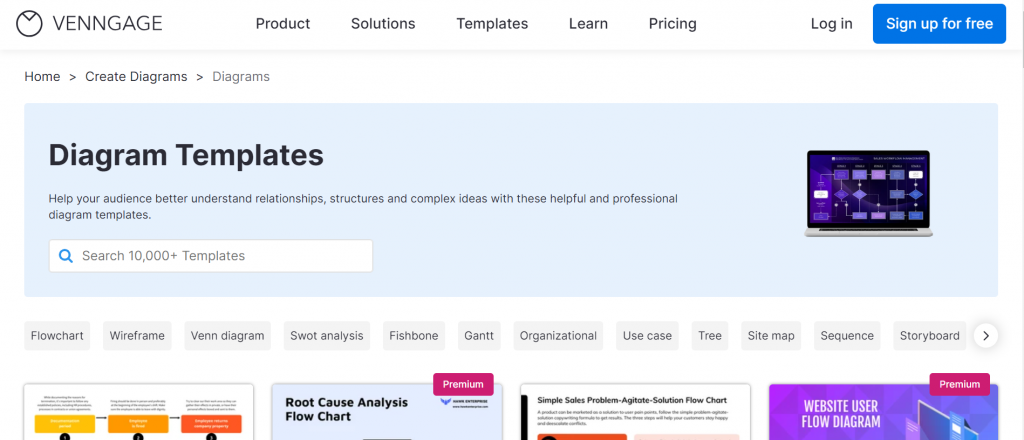
Venngage has several types of flowchart templates for you to edit from process flowcharts to workflow flowcharts.
Note: Some of our flowchart templates are free to use and some require a small monthly fee. Sign-up is always free, as is access to Venngage’s online drag-and-drop editor.
Step 3 – Customize your flowchart
Venngage templates get people’s attention and provide an easy way to differentiate your company’s flowcharts.
While editing flowcharts, you’ll also get access to our in-editor library of thousands of free, professional icons, plus diverse icons to visually reinforce ideas and processes.
And if you’re on a Business plan, you’ll also get team collaboration features like the ability to create a team and invite teammates to edit designs together in real-time.
Let’s walkthrough an example of editing a Venngage flowchart template.
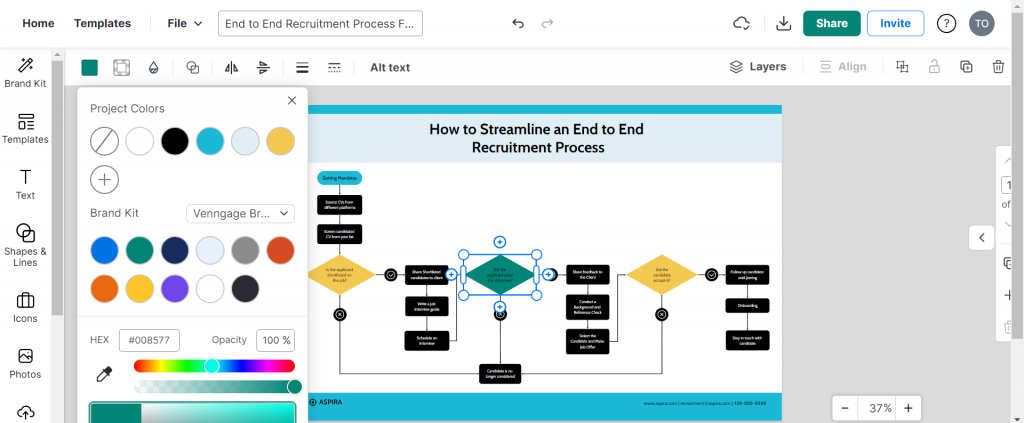
This flowchart shows outlines a streamlined recruiting process, from CV collection to the endpoint of hiring and onboarding a new hire.

Now let’s say you want to change it to reflect your recruiting process but don’t have the design experience to recreate it.
Don’t stress! With Venngage, you can just replace items or colors without having to re-design anything.
For example, let’s say I want to change the colors of the shapes in the original flowchart template.
All I need to do is select the shape and click “Fill color”. This will open a pop-up where you can choose alternative colors or even enter a HEX code.
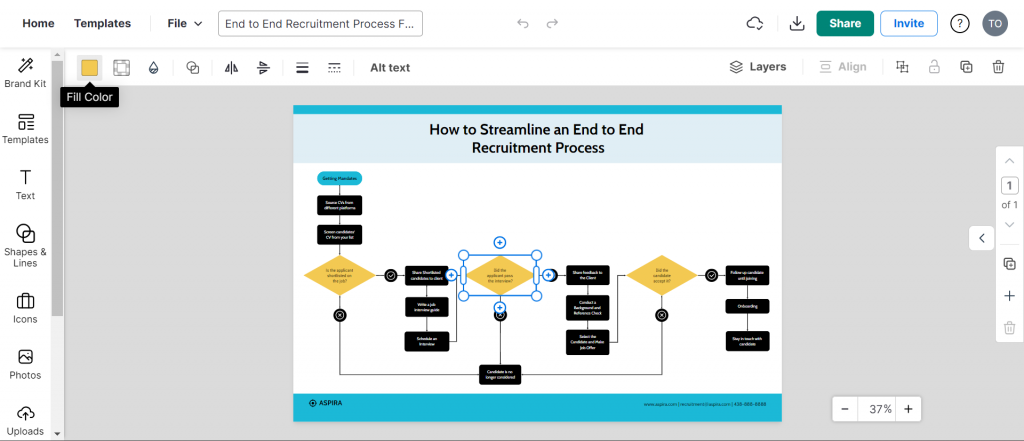
For example, I changed the color of one decision point in the flowchart to green. It took just two clicks!
Besides colors, you can also easily swap text, icons, and graphics in a simple fashion like this.
Venngage also has an inbuilt accessibility checker so you can test your flowchart for things like color contrast to make sure people living with disabilities can also understand your design.
For example, let’s say I wasn’t sure if changing the shape color from yellow to green is a wise move. Well, Venngage can tell me if the contrast ratio is acceptable or not, right in the tool!

This will save you A LOT of time from remediating flowcharts after you’ve made them. Our accessibility tool just doesn’t work with colors but also icons, text, and more.
Here are some more examples of customizable flowchart templates available in Venngage.
This flowchart outline a process for pre-approaching and qualifying leads in a sales or marketing context.

This flowchart is designed to guide a recruiter through the standard steps of recruiting a candidate, from the initial job posting to job offer.
It includes decision points to determine whether to proceed with a candidate or send a rejection.

This flowchart outlines a process for managing emails and might represent educational material a new email marketer might be trained with.

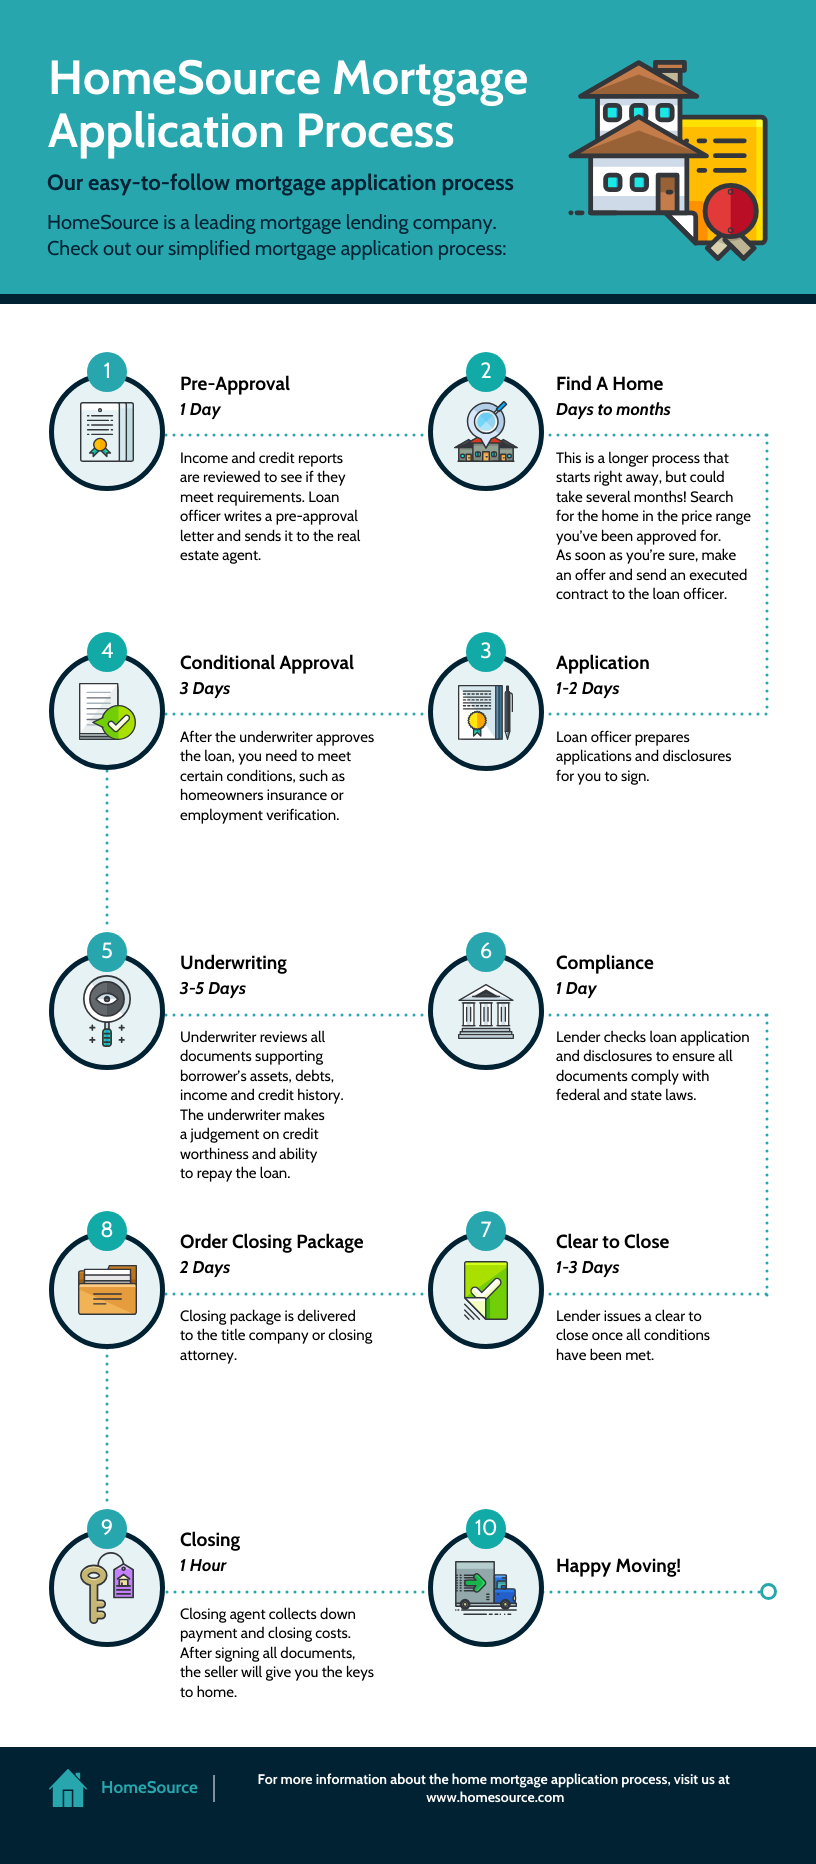
By the way, flowcharts also seamlessly integrate into infographics.
Since infographics communicate information quickly, flowcharts can summarize processes that might otherwise take many paragraphs to describe in text.
Here’s a process infographic that uses a flowchart to explain the mortgage application process.
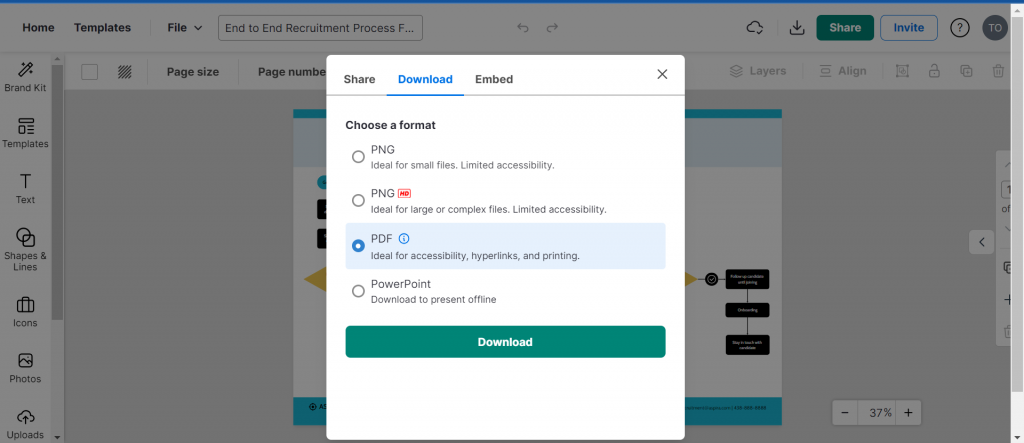
When you are happy with your flowchart, you can share a link to (available to free users).
But if you want to download it in formats like PDF or PNG, you’ll need a Business Plan.
By the way, if you sign up for a Business Plan, you’ll have access to My Brand Kit. With this, you can apply your brand colors to any design with one click.
Conclusion: Don’t limit your creativity with Google. Choose Venngage for flowcharts that make an impression
It’s convenient to use to use Google Sheets to make flowcharts because it has a familiar interface but don’t expect it to give you complex and flowcharts that’ll impress.
If you’re a project manager, HR professional, or anyone that needs to make a flowchart that makes an impact, give Venngage a try. You won’t regret it!


