


Your team is scaling its online presence and needs branded visuals for social media, blog posts, reports and campaigns. Now you are wondering which design tool can handle design volume, maintain brand consistency and fit into your existing workflow?
Piktochart and Canva are two of the most discussed design tools for businesses. Both promise easy design and fast turnaround, but they take different approaches to brand control, collaboration and data visualization.
This breakdown will help you decide which design solution works best for your team and where a third option, like Venngage, offers a stronger fit for brand governance and visual storytelling.
What’s the difference between Piktochart and Canva?
Both Piktochart and Canva have a drag-and-drop editor, customizable templates and branding elements. Let’s see their main use cases and key differences.
Piktochart — Best for creating data-driven visuals
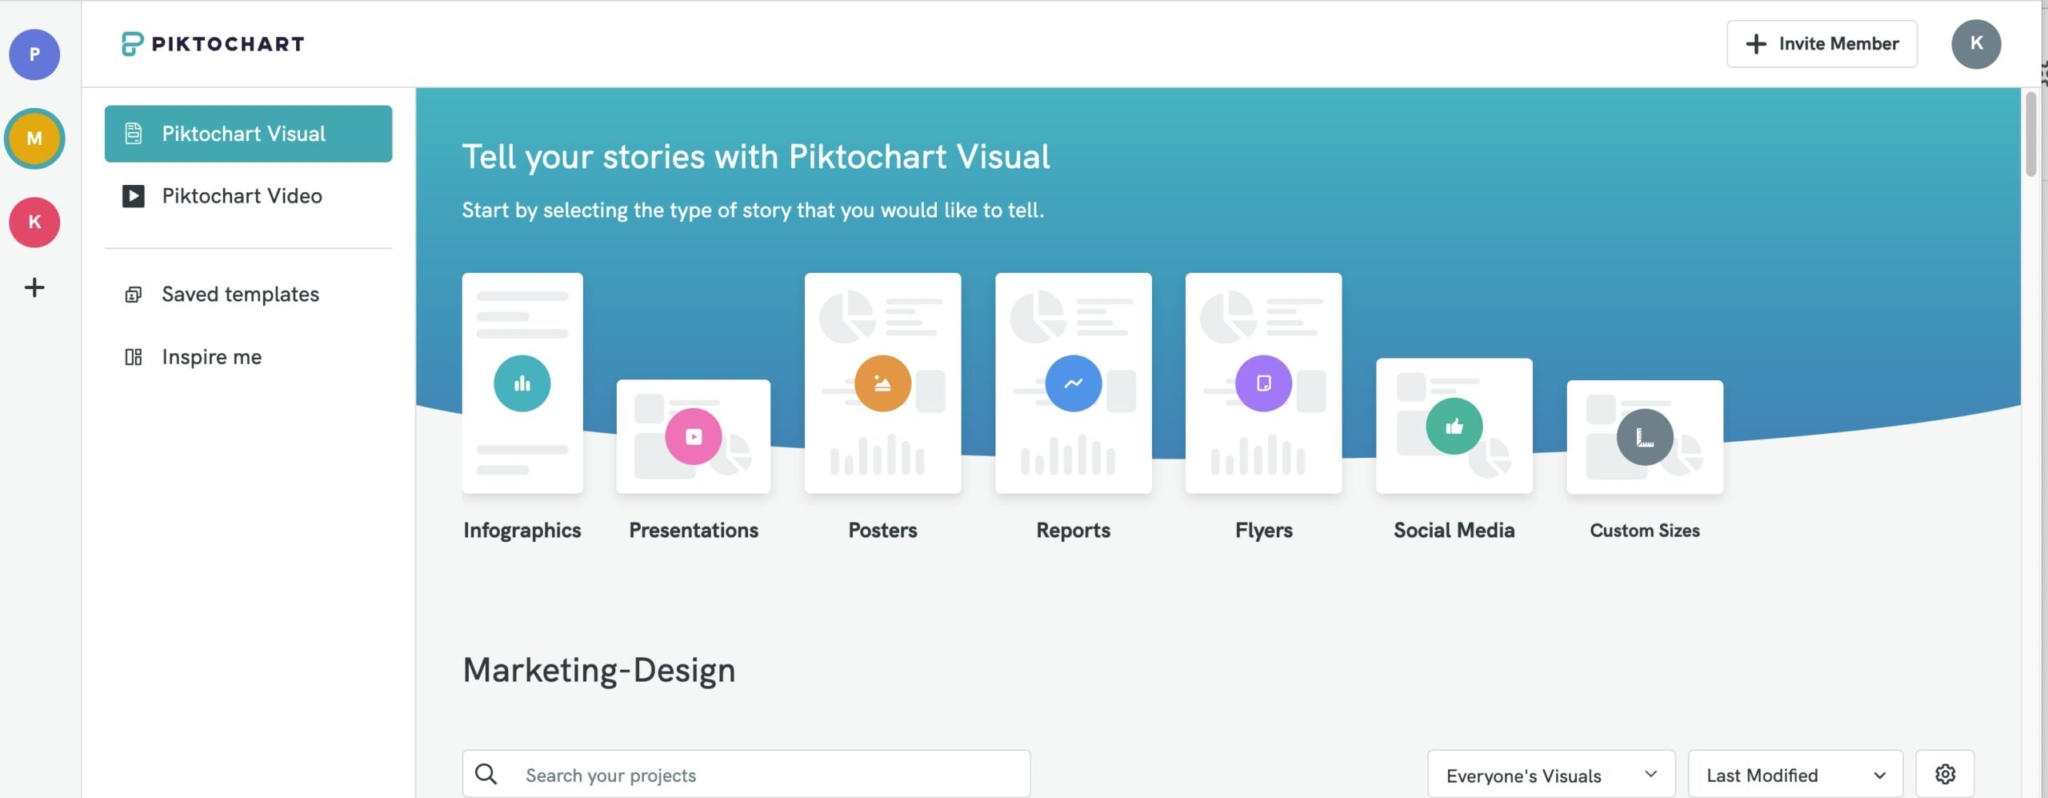
Piktochart specializes in turning data into clear visual narratives. You can import datasets directly from spreadsheets, transform them into charts or maps and create infographics for marketing or educational purposes.
The platform’s AI formatting tools handle layout alignment and element spacing automatically. This comes in handy when you’re working with data tables, comparison charts, or multi-section reports where manual alignment eats up time.
Best for: Data-driven teams that regularly need to present analytics, survey results, or performance metrics in visual formats.
“Piktochart is a solid, user-friendly tool that helps me turn ideas into clean, professional visuals quickly. Features are intuitive and keep improving. Best of all, the support team is remarkably responsive and genuinely helpful.”
TrustPilot Review
Canva — Best for creative, high-volume content

Canva is one of the most popular graphic design tools for both marketers and designers. It excels at speed and variety. The platform supports everything from Instagram carousels to 50-page ebooks, with templates optimized for each format.
Its strength is rapid execution. Magic Design generates layout options from a brief, while Magic Write produces copy directly in your design.
Best for: Marketing teams handling diverse visual needs, such as blog headers, lead magnets and campaign assets, without dedicated designers.
“Canva is super helpful for creating quick, good-looking designs without needing to be a pro. It’s easy to use, has tons of templates and works great for school, work, or social media. The downside is that some of the best tools are locked behind the paid plan and it can feel a bit limited if you want full creative freedom. Still, it’s one of the best options for anyone who wants fast, clean designs.”
G2 review
Comparing Piktochart and Canva feature by feature
Now that you’ve an overview of these graphic design tools, let’s compare how they handle the work your team does most: creating templates, visualizing data and maintaining brand standards.
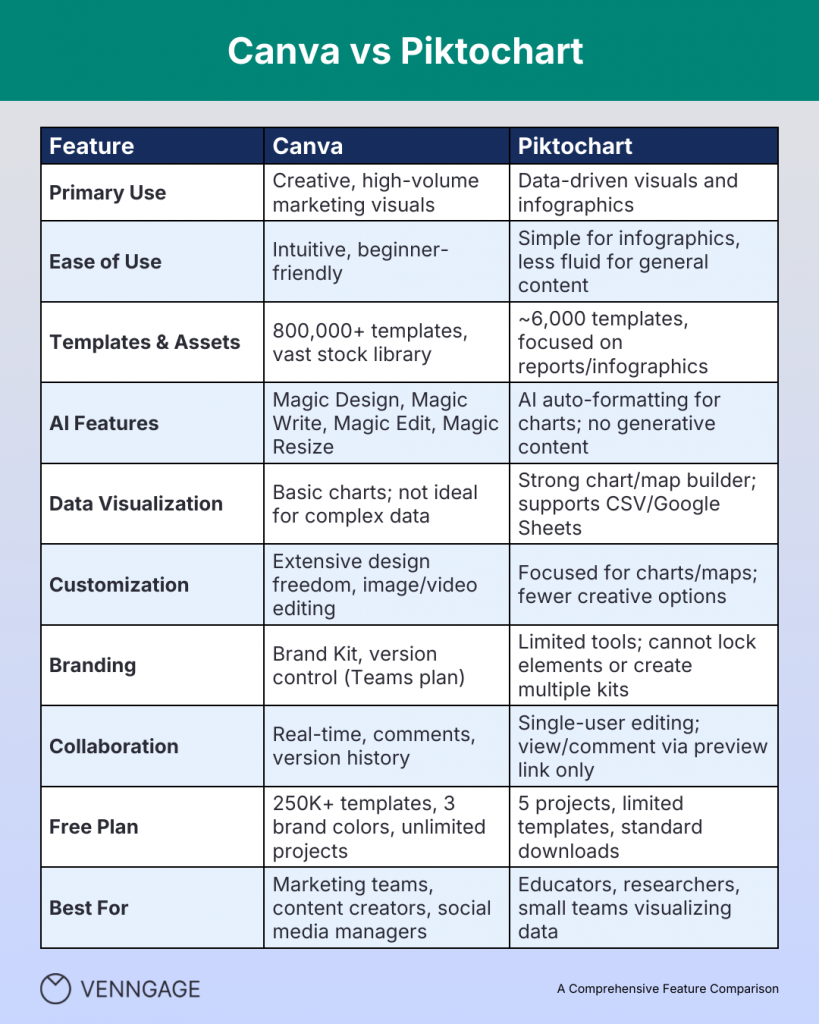
1. Ease of use and interface
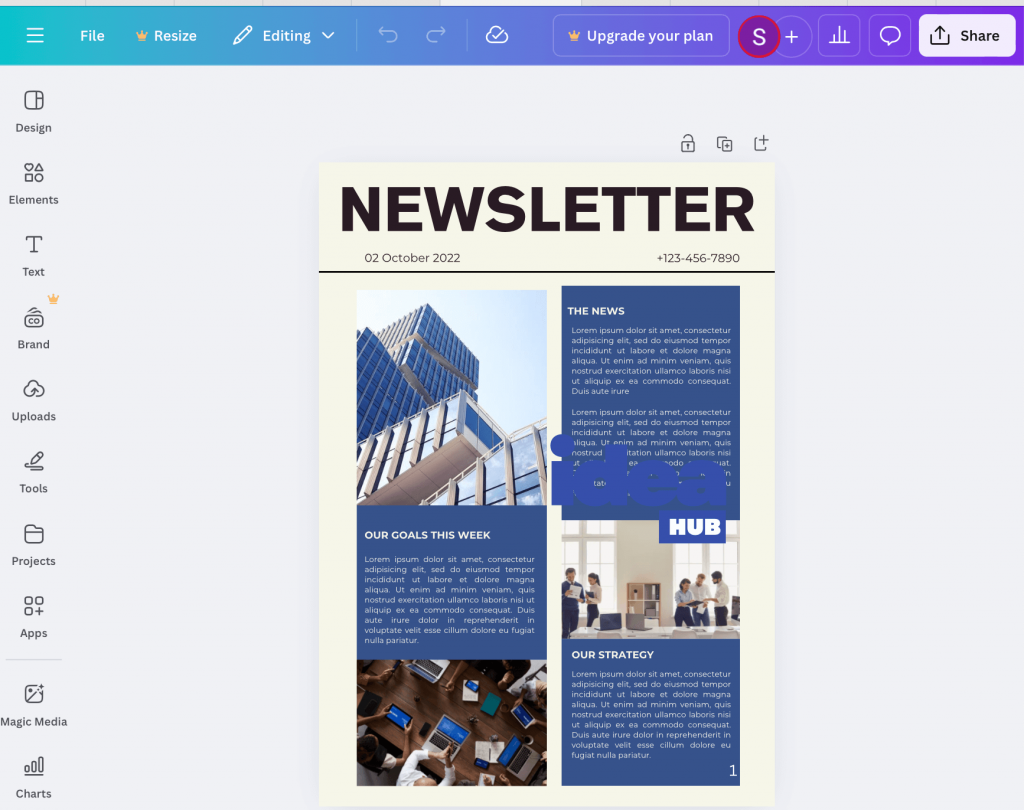
Canva has an intuitive navigation. Its drag-and-drop editor feels familiar and is easy to use. The templates, fonts, color palettes and uploads are arranged intuitively. The platform also has a learning hub (Design School) filled with tutorials, tips and templates, so anyone on your team can pick it up quickly.
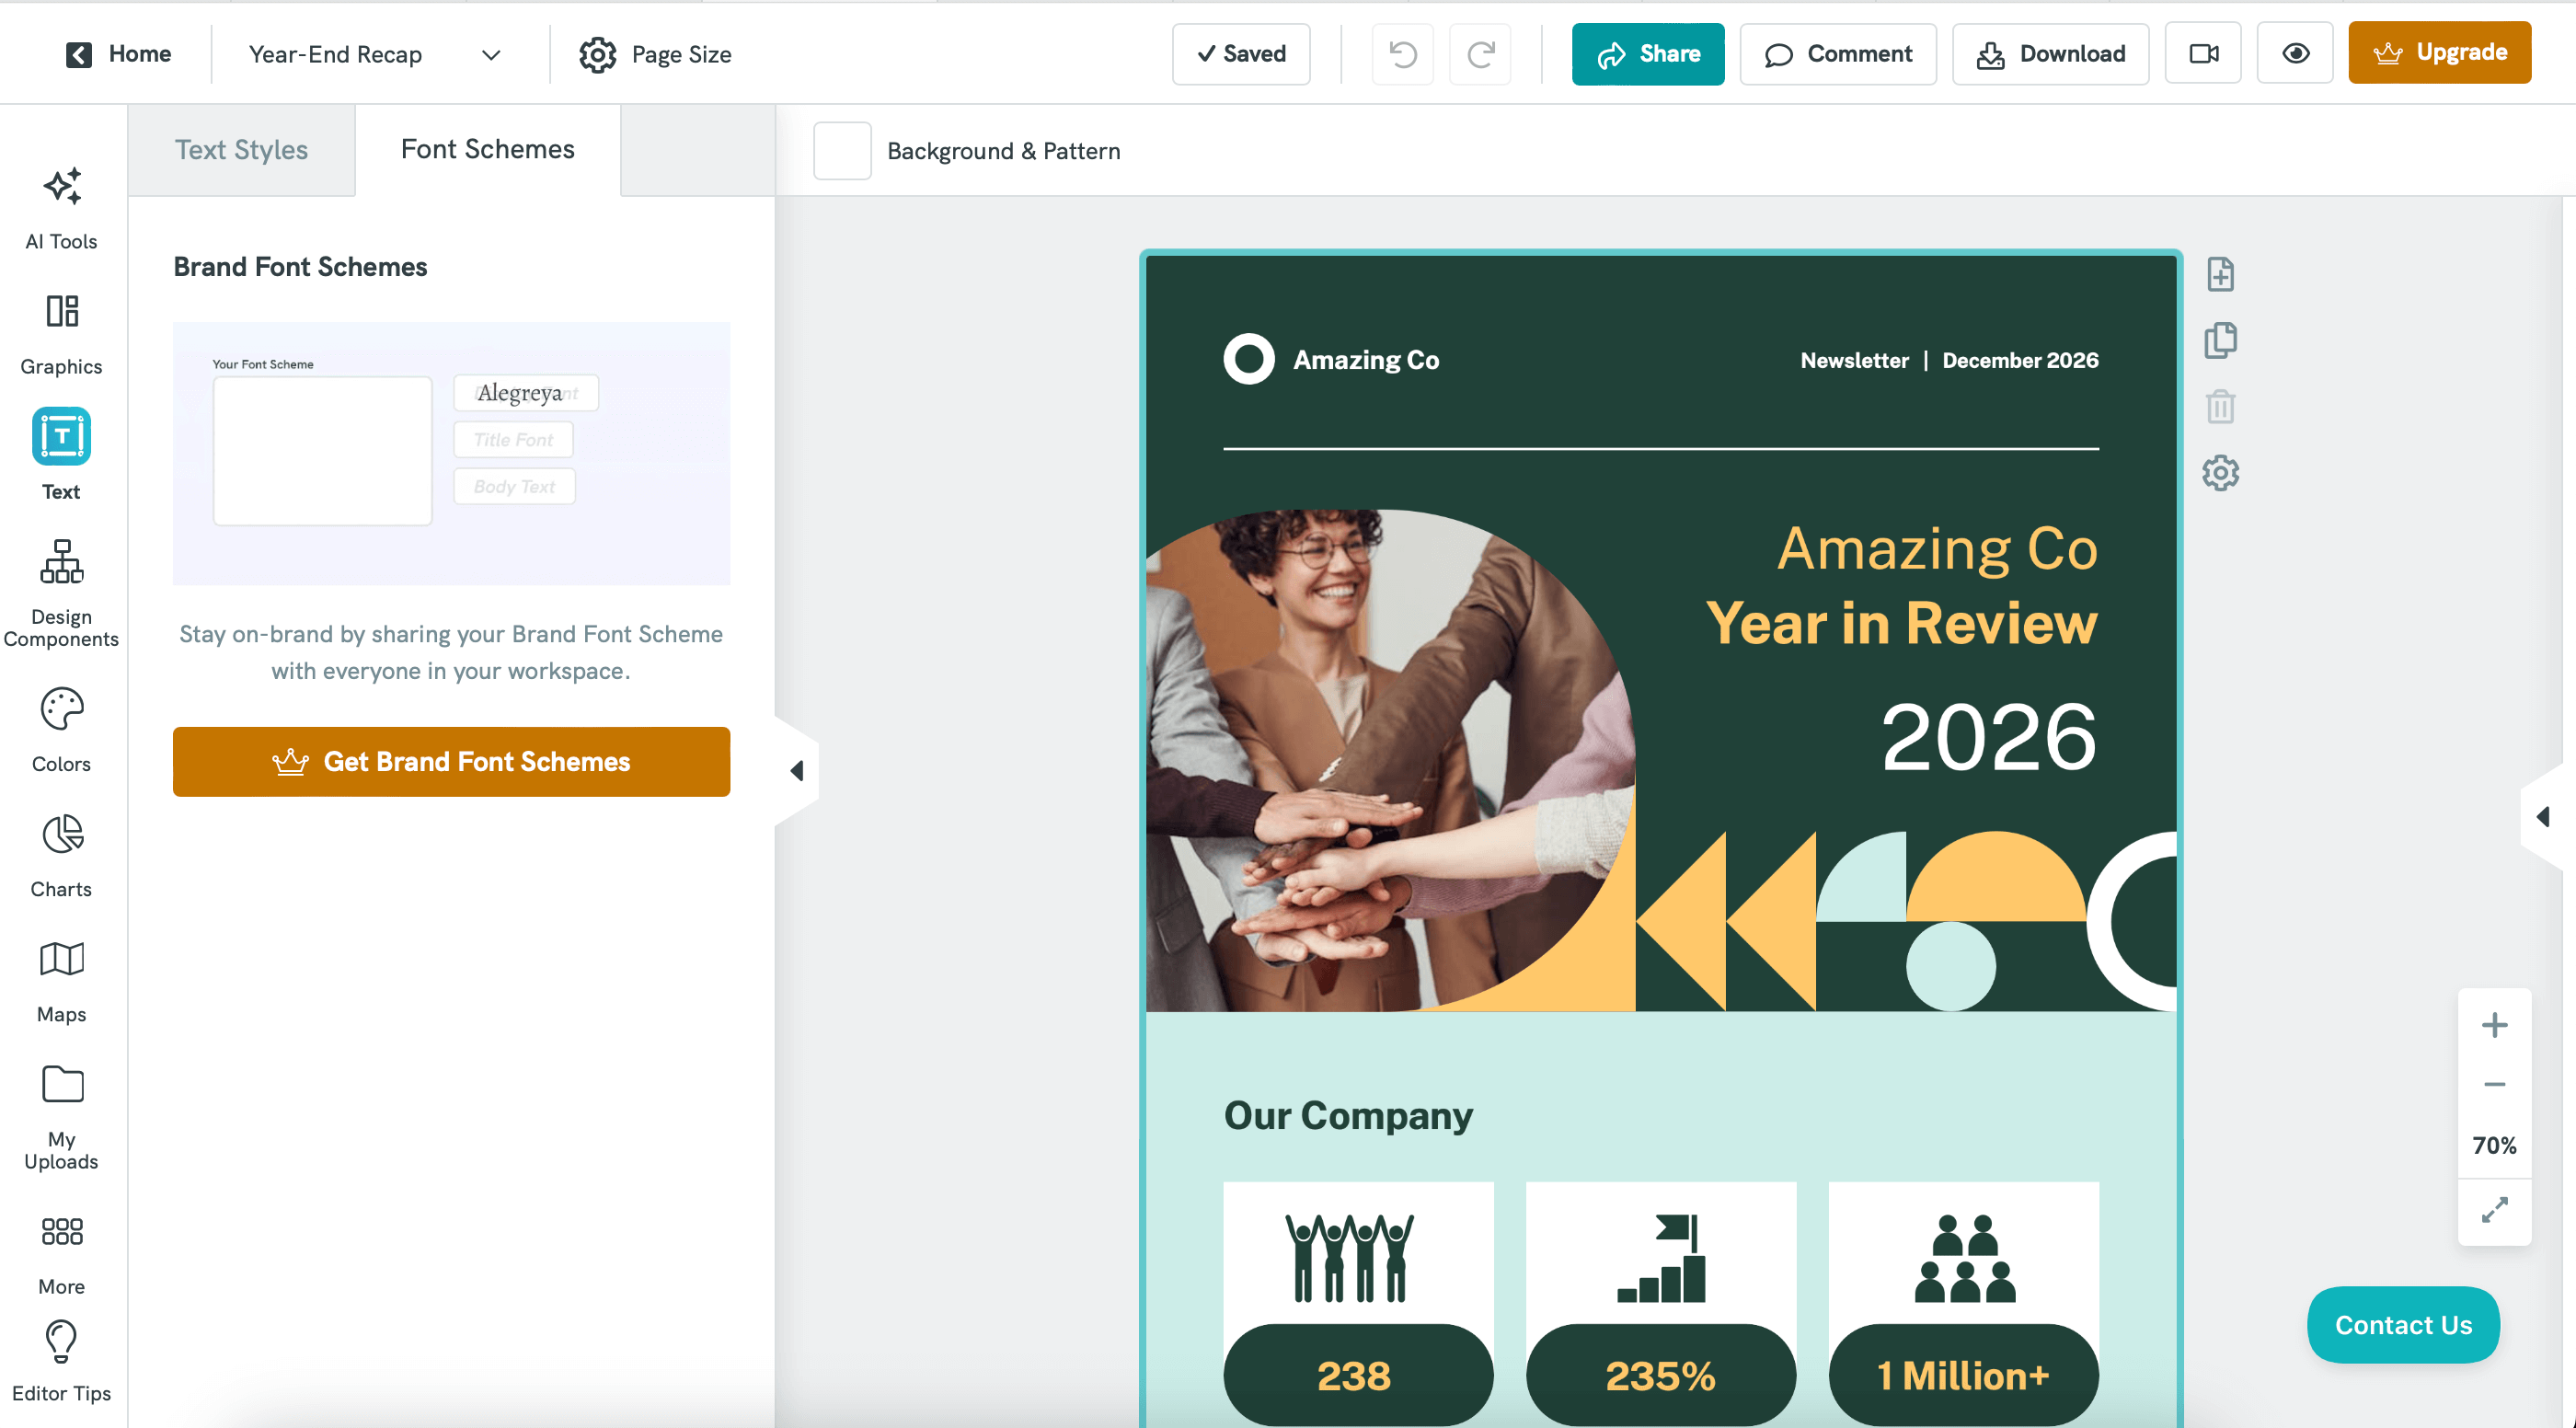
Piktochart’s interface is familiar to Canva. But you need to go through different tabs to apply the branding elements. You can’t save brand colors or fonts in one centralized kit.
It’s easy to use for creating infographics or data reports. The chart builder walks you through data input step by step. Templates preview your actual data before you commit to a layout. But if you need to switch gears and design a video thumbnail or Instagram carousel, you’ll hit friction.
Verdict: Canva is easier for general marketing visuals and team use. Piktochart feels more structured and is better for data, but slower for everyday content creation.
Related: 10+ Pictograph Examples and How To Make Them
2. Templates & asset libraries
Canva has a massive library with over 800,000 templates covering everything from TikTok videos to ebooks. You can explore templates based on platform (Instagram Story, LinkedIn carousel), purpose (product launch, webinar promotion) and theme.
Most of Canva’s free templates have basic designs, and you need to upgrade to Pro to access more professional templates. It also offers millions of stock photos, videos, graphics and audio tracks.
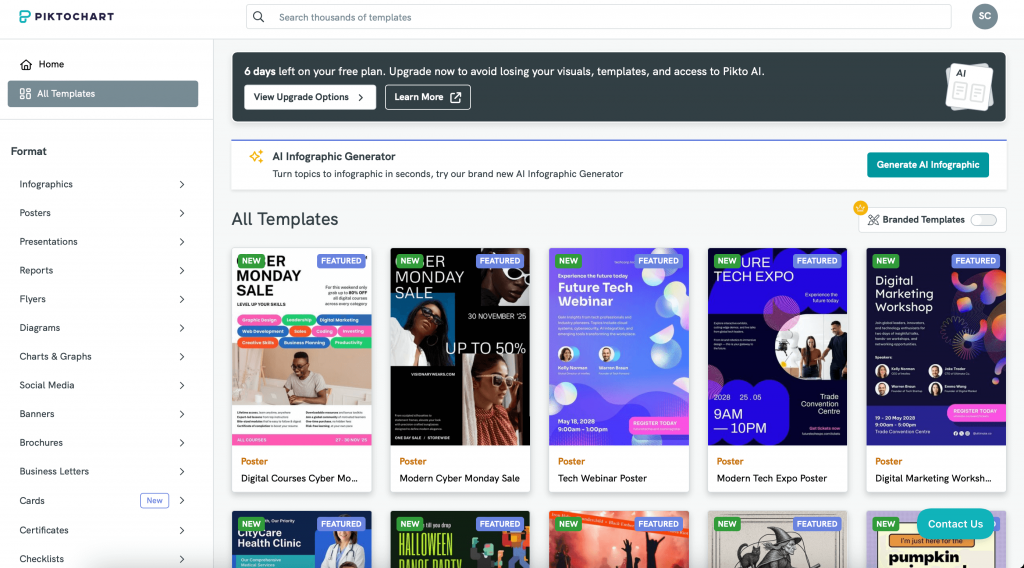
Piktochart’s library is smaller and more specialized, with around 6,000 templates focused on infographics, reports, presentations and posters. If you need a data-heavy one-pager or a process diagram, the templates are purpose-built for clarity and information hierarchy.
But most high-quality templates require a paid plan. The free tier gives you access to basic layouts.
Verdict: Canva wins for creative variety and scale. Piktochart wins when you need polished, data-led templates for reports or infographics.
3. Design & customization features
Canva stands out with its Magic suite. Magic Write generates copy directly in your design. Type a prompt like “write three benefits of remote work” and it produces options. Magic Design creates layout variations from a single prompt or uploaded content. Magic Edit removes backgrounds, expands images, and replaces objects in photos.
The photo editor in Canva is robust and background removal works cleanly. You can crop to custom dimensions, apply blur, adjust shadows, and enhance colors without leaving the editor.
Piktochart’s chart builder is the standout feature. You can create bar charts, line graphs, pie charts, scatter plots and area charts with more customization than Canva offers. Import data from CSV or Google Sheets, and the tool automatically populates your chart. Adjust colors, labels, axes and legends through a dedicated panel.
The map builder handles both regional data (states, countries) and location markers. If you’re visualizing survey responses by geography or showing office locations, this saves hours compared to designing maps manually in Canva.
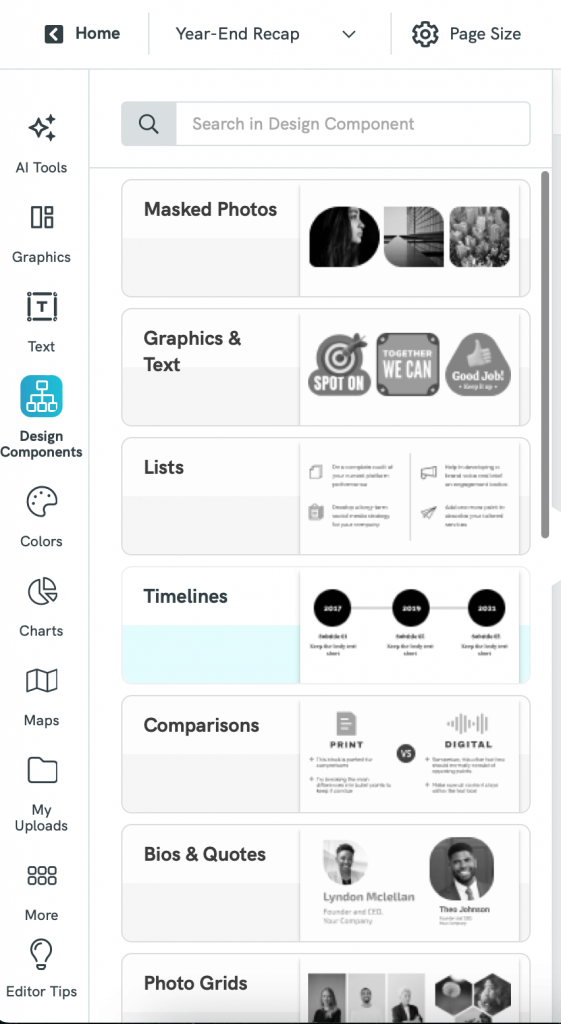
One area where Piktochart shines is the organization of design components. When you need a masked photo, comparison chart, timeline, or badge, you can add them in one click. No hunting through menus or combining multiple elements.
One design feature both platforms handle well is resizing. Canva’s Magic Resize adapts your design to multiple formats instantly. Create an Instagram post and resize it for Facebook, LinkedIn, Twitter and Pinterest in one click. Layouts adjust automatically, though you’ll need to review text placement.
Piktochart offers auto-resize for social media formats but not for print dimensions. If you need to turn an infographic into a poster, you’ll manually input custom dimensions. This takes longer but gives you more control over the final layout.
Verdict: Piktochart is stronger for precise data storytelling. Canva is more versatile for creative marketing visuals across different channels.
4. Collaboration, sharing and export options
Canva handles real-time collaboration smoothly. Multiple team members can edit the same design simultaneously. You can tag teammates in comments, assign tasks, and resolve threads when feedback is addressed. This matters when legal needs to approve copy or leadership wants to tweak messaging before publication.
Admins can restrict access to brand assets or specific folders. Version history lets you roll back changes if someone accidentally breaks a layout. The collaboration experience matches tools like Google Docs or Figma.
Piktochart’s collaboration is more limited. You can share a preview link that lets stakeholders view and comment, but only one person can edit at a time. If your workflow involves multiple designers iterating together, this becomes a bottleneck.
You’ll need to coordinate who’s working on the file to avoid overwriting each other’s changes. For small teams with clear ownership, this works fine. For larger marketing departments, it slows things down.
Both platforms export to PNG, JPG and PDF. Canva adds MP4 for videos and GIF for animations. Piktochart includes HTML export for interactive charts and SVG for vector graphics. Neither platform exports to formats like PSD or AI if you need to continue editing in Adobe tools.
Verdict: Canva is stronger for real-time collaboration and publishing workflows. Piktochart is better suited for individual creators or small teams producing static visuals.
5. Pricing and plans
Piktochart
- Free: $0 (5 projects, limited templates, standard downloads)
- Pro: $14/month for unlimited projects, full template library, high-res downloads
- Business: $24/month with Pro features for up to 5 users, 5 brand kits
Canva
- Free: $0 (unlimited projects, 250K+ templates, 3 brand colors)
- Pro: $120/year for 800K+ templates, 1TB storage, 100 brand kits, Magic Resize
- Teams: $100/user/year with Pro features and unlimited brand kits
Canva vs Piktochart pros and cons summary
Piktochart
Pros:
- Excellent chart and map builder
- Strong templates for infographics and reports
- Easy to turn data into clear visuals
Cons:
- Limited creative templates for marketing use
- Free plan has tight project limits
- Collaboration and export options are basic
Canva
Pros:
- Massive template and asset library
- AI tools, video editing and website builder included
- Real-time team collaboration and brand kits
Cons:
- Not ideal for advanced data visualization
- Team plans can get expensive as users scale
- Occasional lag with large projects
Related: Venngage vs. Canva: Which Infographic Maker is the Best?
Try Venngage: Better alternative to Piktochart and Canva
Piktochart handles data visualization well, but falls short on brand control. Canva offers creative flexibility but lacks data import capabilities. Most teams need both: branded visuals that incorporate real data.
Buying two tools doubles your software costs and splits your team’s workflow. Venngage solves this by combining Piktochart’s data focus with Canva’s brand management in one platform.
AI-powered design tools
Venngage is an AI-powered design platform that offers a variety of AI tools to create customized viuals. For example, Venngage’s AI Infographic Generator builds complete infographics from text prompts or data inputs. Describe your topic or paste your content, and the tool produces structured designs with appropriate charts, icons and hierarchy. You’re not starting from a blank canvas or adapting a template that almost fits.
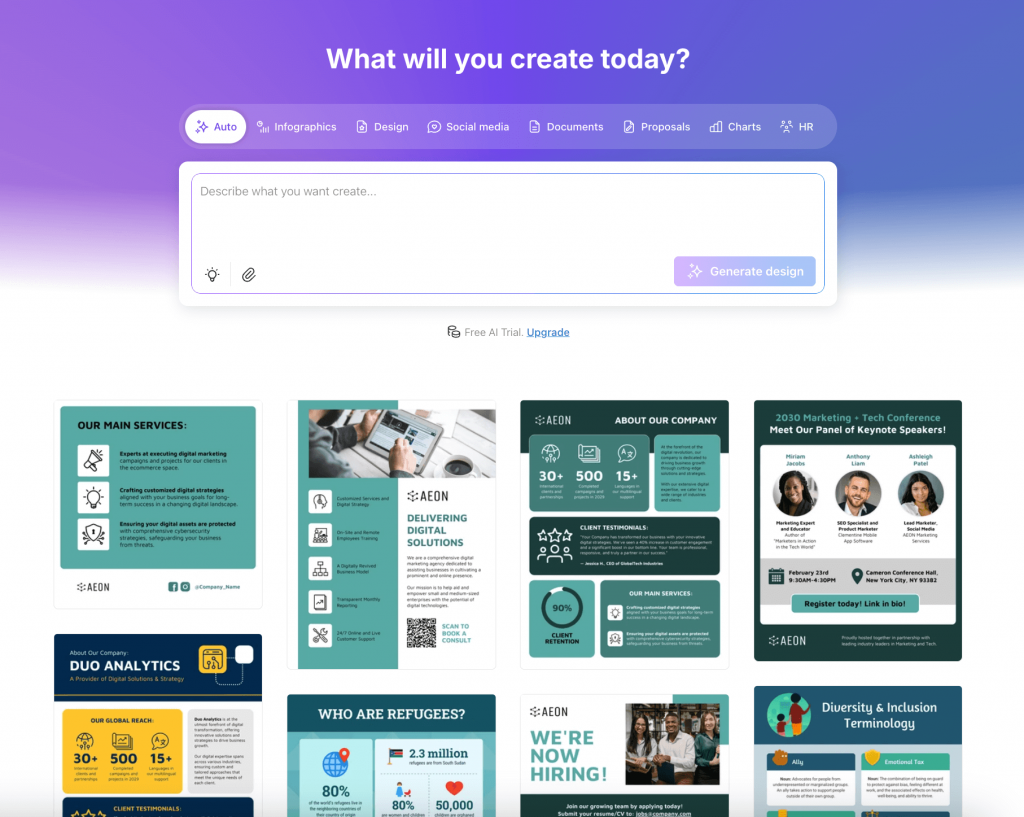
The AI suggests relevant data visualization types based on your content. If you’re comparing quarterly revenue, it recommends bar charts or line graphs instead of pie charts. This saves the back-and-forth of testing different formats to see what communicates best.
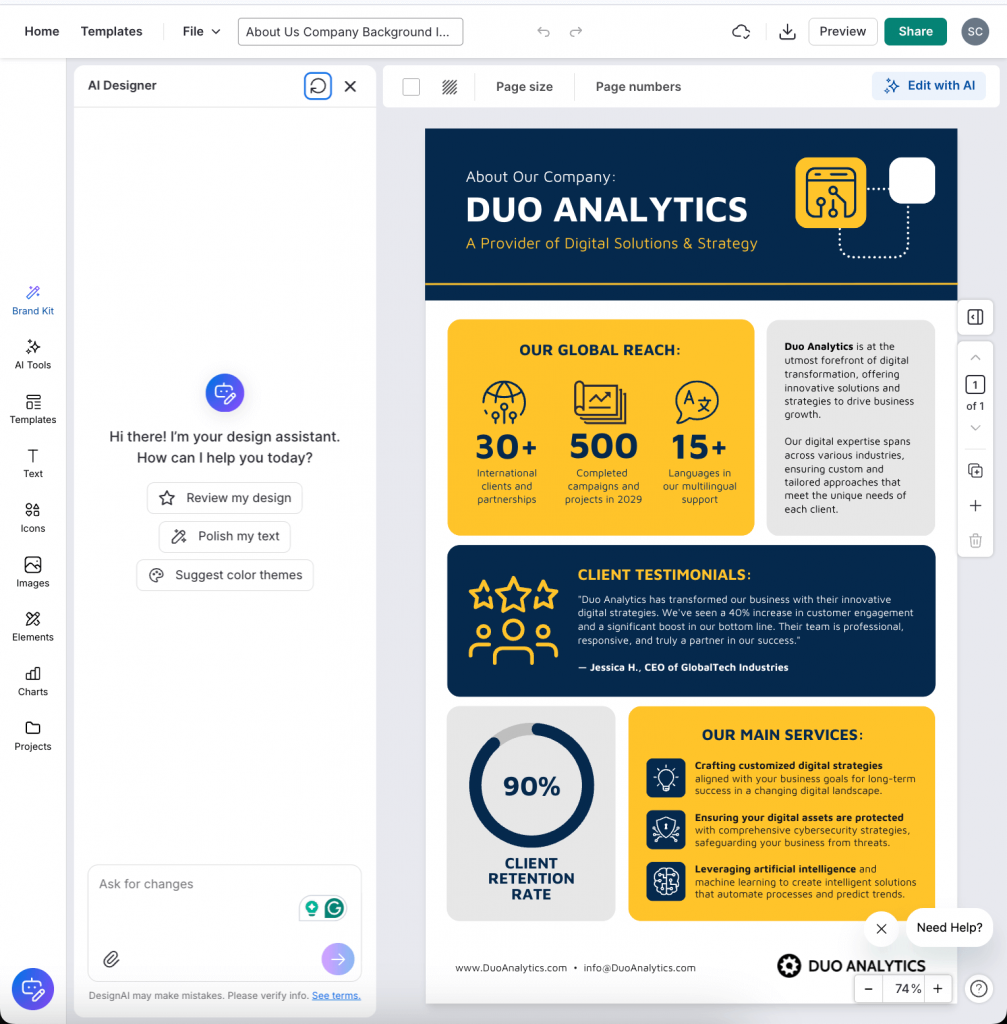
Venngage’s AI Design Assistant also helps polish your text, suggests color themes and improve your design.
Related: Venngage vs. Piktochart: Which Infographic Maker is Better?
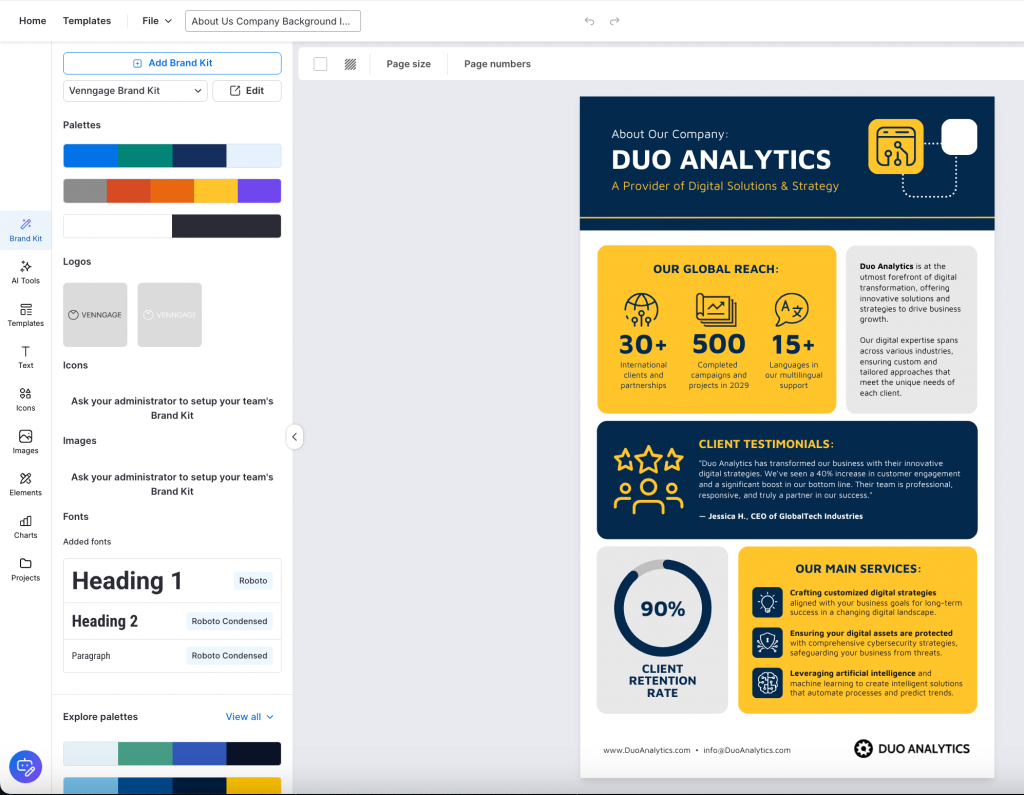
Vast template library
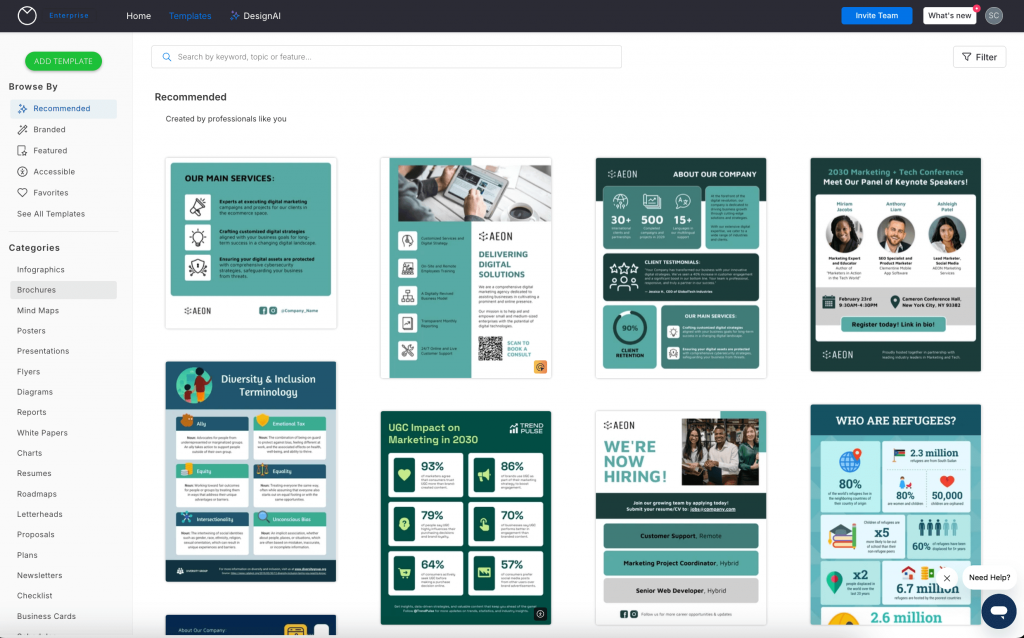
Venngage’s template library focuses on business communication: reports, proposals, case studies, white papers and training materials.
This matters when you’re creating a 20-page customer success report or a technical explainer. Templates are structured with clear sections, consistent typography and space for data callouts. You’re not wrestling with a social media template trying to make it work for long-form content.
The library includes over 40,000 templates. You’ll spend less time sorting through amateur designs.
Easy branding
My Brand Kit feature in Venngage functions like Canva’s brand kit but with tighter governance. Admins can lock brand colors, fonts and logo usage so team members can’t accidentally modify them. Templates can be marked as approved, preventing layout changes that break brand guidelines.
This level of control matters for companies with multiple departments creating customer-facing materials. Regional offices can access templates without risk of producing off-brand content.
Built-in Accessibility Checker
Venngage’s Accessible Design Maker shows how your design appears to people with different types of color vision deficiency. You can adjust your palette before publishing instead of hoping it works.
Contrast checkers flag text that doesn’t meet WCAG accessibility standards. Alt-text fields sit directly in the editor for every image and chart. If your organization serves government clients, healthcare systems, or educational institutions, these features aren’t nice-to-haves. They’re requirements.
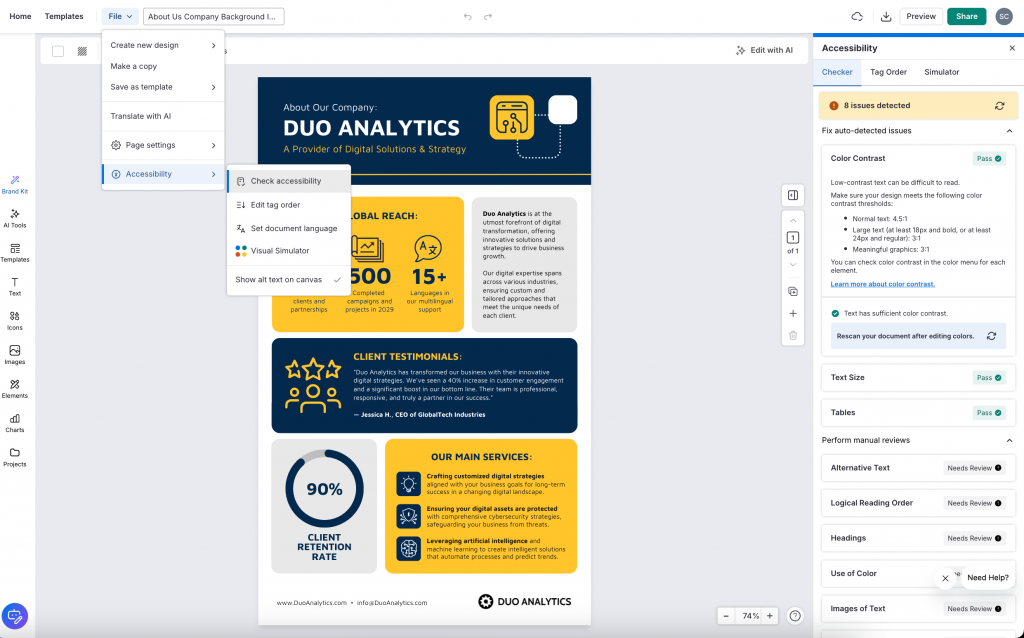
Canva added some accessibility features recently, but they’re scattered across menus. Piktochart offers basic contrast checking but no color-blind simulation.
Easy export options
Venngage exports to high-resolution PNG, PDF and interactive HTML. The PDF export maintains vector quality, so your infographics stay sharp whether viewed on screen or printed at poster size.
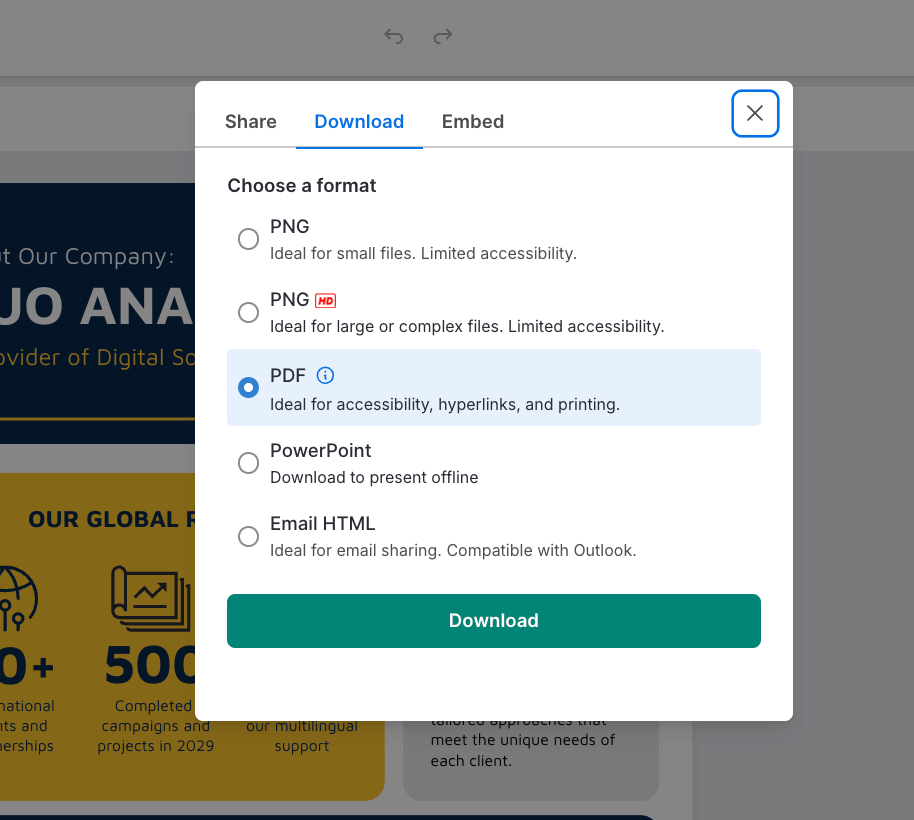
Interactive exports let you embed clickable charts and expandable sections. Useful for digital reports where readers can explore data layers without cluttering the main view.
Piktochart’s standard resolution downloads often look pixelated when scaled up. Canva offers high resolution on paid plans, but doesn’t support interactive elements.
Canva vs Piktochart vs Venngage: Which tool should you choose
Choose Venngage if you:
- Create data-driven content regularly. Product marketers building feature comparison sheets. Customer success teams are producing quarterly business reviews. Internal communications teams are designing training materials or company reports.
- Need accessibility compliance. Government contractors, healthcare organizations and educational institutions that must meet WCAG standards will find Venngage’s built-in tools essential. The color-blind simulator and contrast checker save hours of manual testing.
- Want brand governance. Large marketing teams, franchises, or companies with strict brand guidelines benefit from template locking and controlled asset libraries. Regional offices can create localized content without breaking brand rules.
- Want professional output quality. If your designs end up in client presentations, printed materials, or executive reports, Venngage’s export quality and business-focused templates deliver better results than adapting social media templates.
Choose Canva if:
- You produce high volumes of diverse content. Social media managers are posting daily across multiple platforms. Small marketing teams handling everything from Instagram stories to email headers to event flyers.
- Creative flexibility outweighs data visualization. If you’re designing brand campaigns, promotional materials, or content that prioritizes visual impact over information architecture, Canva’s asset library and Magic tools give you more creative options.
- Budget is tight and you need free access. Canva’s free tier is more generous than competitors. You get unlimited projects and access to hundreds of thousands of templates. Good for bootstrapped startups or solo creators testing whether design software fits their workflow.
- You’re building quick multimedia content. The video editor, website builder and animation features make Canva useful for teams that need multiple content types without jumping between platforms.
Choose Piktochart if:
- Data visualization is your primary need and budget is limited. Educators creating classroom materials with charts and diagrams. Nonprofit teams building impact reports with survey data and statistics.
- You work solo or with very small teams. Piktochart’s collaboration limitations don’t matter if you’re the only designer. The focused feature set means less time navigating options you don’t need.
- Your projects are straightforward. Single-page infographics, simple presentations, or posters that don’t require complex brand management or approval workflows.
Select the best design platform
Most B2B marketing teams will find Venngage hits the sweet spot. It combines Piktochart’s data capabilities with Canva’s brand management and collaboration features. The accessibility tools and professional templates justify the investment if you’re creating client-facing or compliance-sensitive materials.
Canva works better for teams that prioritize speed and creative variety over data accuracy and brand control. The lower learning curve and massive template library make it ideal for content-heavy workflows.
Piktochart serves a niche: users who need strong chart builders but don’t require enterprise features. It’s the most affordable option for data-focused projects, but you’ll outgrow it as your team or requirements expand.
FAQs on Canva vs Piktochart
1. Is Canva a Chinese company?
No. Canva is an Australian company headquartered in Sydney. Piktochart is based in Malaysia. Both companies follow standard data privacy policies and comply with international data protection regulations like GDPR. Your design files and company data are not stored or processed in China.
2. Why don’t professional designers use Canva?
Professional designers typically use Adobe Creative Suite or Figma because they offer advanced features like vector editing, CMYK color modes and print-specific tools. Canva is built for non-designers who need quick results without specialized training. It prioritizes speed over technical depth.
3. Can I use Canva or Piktochart designs commercially?
Yes. Both platforms grant commercial usage rights for designs you create, even on free plans. However, some premium stock photos and graphics have licensing restrictions. Always check the license details for individual assets before using them in client work or paid products.
4. Which tool is better for team collaboration?
Canva offers better collaboration features with real-time editing, comments and version history. Multiple team members can work on the same design simultaneously. Piktochart only allows one editor at a time with preview-only sharing links. For teams larger than three people, Canva or Venngage handle collaboration better.


