


Strong leadership is essential for any organization to grow. But how do you get strong leaders who can build a strong vision and effective strategy? It all depends on how you train your team. This is why leadership training is crucial.
One powerful tool for leadership training is infographics. Leadership infographics not only convey complex leadership concepts in a simple and visually engaging way, but also inspire professionals, drive action and provide clear roadmaps for leadership strategies.
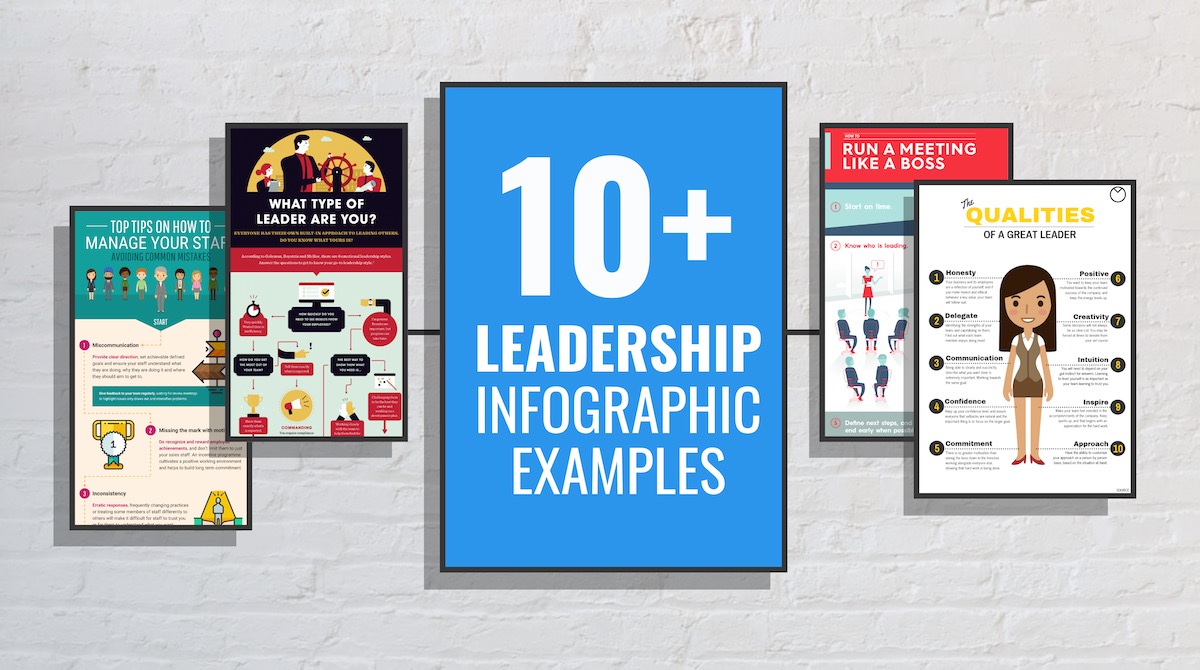
In this blog post, we’ll share engaging 10+ leadership infographics, examples and templates so you can train your team.
Click to jump ahead
- The Qualities of a Great Leader Infographic
- Leadership Qualities That Build Strong Teams Infographic
- 6 Ways To Avoid Common Manager Mistakes Infographic
- Leadership Methods From Around The World Infographic
- 7 Steps To Resolving Conflict At Work Infographic
- How to Run a Meeting Like a Boss Leadership Infographic
- 7 Types of Managers in The Lion King Infographic
- The Difference Between A Boss & A Leader Infographic
- 6 Tips to Manage Remote Staff Leadership Infographic
- What Type Of Leader Are You Infographic
- 4 Ways To Keep Employees From Jumping Ship Infographic
1. The Qualities of a Great Leader Infographic

Let’s start this roundup with a very simple but well-designed leadership infographic.
Just like some great leaders, this infographic is more functional than flashy. Instead of using a ton of images or icons, the text is the main focal point.
They achieved this by using extra bold headers for each section while using a somewhat thin font for the rest of the written content. This approach makes the whole infographic really easy to scan and jump from point to point.
A reader could get a ton of good information just from those headers. Compelling headers make audiences want to read the whole infographic.
So if you’re going to create a minimalistic infographic like this, make sure to pick a bold font to create some eye-catching contrast. A thin font would just blend into the background.
Finally, I really like how compact and shareable this list infographic is. You could easily print this off and hang it up in your office, or share it on social media.
2. Leadership Qualities That Build Strong Teams Infographic

If you haven’t been paying attention to the graphic design trends, you might not have heard that muted colors are extremely popular this year. This shift was mostly caused by the overuse of bright and bold colors for the past few years.
If you don’t know what muted colors are, just take a look at this infographic about the top leadership qualities of strong teams. In the simplest terms, muted colors are the opposite of vivid colors.
Now I didn’t just pick this infographic because of the color palette, although that’s what initially caught my eye.
I was also very impressed with how the designers used the shape of each section to pull your eye down the page. They could have just used rectangles to break up the infographic, but the slanted lines make it easy to jump from one section to the next.
Also, the very quirky data visualization at the bottom fits the theme of the infographic very well.
3. 6 Ways To Avoid Common Manager Mistakes Infographic

Getting someone to read your entire infographic can be tough. Sometimes you need to give them an extra to push down the page, even if your content is amazing!
This creative leadership infographic uses a simple dotted line to connect each point and draw the reader deeper into the content. I like this tactic because it’s subtle.
Additionally, one thing that can quickly distract someone from your content is using mismatched icons.
For example, on this infographic, they use the same style of icons so everything looks consistent. But if the designer would have used a random icon, your eye would focus on that instead of the interesting written content.
4. Leadership Methods From Around The World Infographic

The first thing that caught my eye on this infographic was the simple illustrations of complex leadership models. These visuals make it very easy to compare leadership styles across different countries as well.
Imagine trying to compare each of them if they just used text descriptions! It would be a chore and you would probably give up quickly.
Not only do these break each of the approaches into easily digestible chunks, but the readers will also remember the visual content a lot longer. According to experts, 65% of people are visual learners and people, in general, retain 80% of what they see.
When you compare this to people only remembering 20% of what they read each day, you quickly see how powerful simple graphics like this can be.
Plus as a social media marketer, I also really like that each section could be turned into its own social graphic with a few clicks. Like so:

5. 7 Steps To Resolving Conflict At Work Infographic

Let’s be honest, conflict is going to happen at work, there is no getting around that.
A great leader will take the time to learn how to resolve that conflict. They also will make sure that their colleagues understand how to resolve conflict.
This simple HR infographic actually makes a somewhat uncomfortable topic a little more palatable. Plus, it’s a lot more engaging than another boring text document.
If someone were to receive this in an email, I can almost guarantee they would read the whole thing. I can’t say the same thing about a PDF or document with the exact same information.
It might not dive deep into some conflict resolution tactics, but it outlines the basic process that someone would follow. Even if you were to just read the headers of each section, you would know a lot about the topic.
6. How to Run a Meeting Like a Boss Leadership Infographic

In this leadership infographic there really isn’t a ton of written information, especially when compared to the other examples in this roundup.
But sometimes you don’t have to say a lot for it to be useful. This infographic uses the KISS approach to make sure their tips are very actionable, no matter your background or industry.
Now If you’re going to create a simple infographic like this, make sure your visuals are extremely eye-catching, like above. Otherwise, with no visual contrast, it will just look like another boring graphic.
Additionally, infographics like this are great for social media and mobile because they can be viewed quickly. And they look great on smaller screens, without having to zoom in to read the smaller text. A huge plus when you consider how marketing has evolved to be mobile first!
7. 7 Types of Managers in The Lion King Infographic

While I was doing research for this article, I saw a lot of leadership infographics that were very similar to this example. However, this is probably the most unique one and it makes you think about different types of leadership styles in a fun way.
This is another example that would do very well on social media because it takes a novel approach to a pretty generic topic.
Plus, if you can mix something specific to your industry with an overarching topic or pop culture phenomenon like the Lion King, your audience gets a lot bigger.
This is a tactic that we have used a lot to get our infographics featured in some of the biggest publications and shared by a ton of people. In the early days of Venngage, one infographic got so popular it crashed our site for a day or so!
8. The Difference Between A Boss & A Leader Infographic

I have always been a big fan of OfficeVibe and their comparison infographics. Somehow they are able to keep an extremely strong visual identity across all their content. As someone who has created hundreds of infographics, I can attest to how hard this is!
The instant you see one of their designs, you know it came from them and this leadership infographic is no different.
That said, the most impactful part of this design is how they split each side of the infographic. With the negative side being black, and the positive being colorful. Each of the illustrations also has a lot more positive tone on the colorful side which really helps strengthen their point.
This may not seem like a big deal, but it adds a lot of context to the infographic without directly saying it. Some people might not even notice the distinction but it will still affect how they consume the information.
9. 6 Tips to Manage Remote Staff Leadership Infographic

Sooner or later you’re going to have to manage a remote worker or even a fully distributed team. In 2019, around 54% of U.S. employees work remotely at least once a month and 30% work remotely full time! There’s really no avoiding it anymore.
In fact, I have worked remotely the entire 4 years I have been at Venngage. So I know how difficult it can be to manage and interact with remote workers.
Like the first example, I appreciate that this simple list infographic is about the same size as a piece of paper. This means it could easily be sent out to all the leaders at your company or included in the onboarding materials each manager receives.
10. What Type Of Leader Are You Infographic

This leadership infographic is very similar to the Lion King example above. They both cover roughly the same information but present it in very different ways.
I think this is a good illustration of how there isn’t a “right” way to create an infographic. As long as you present your information in an engaging way, your readers will be happy.
In this infographic, they’ve used a flow chart to create a “quiz”. Now it doesn’t matter where someone views this infographic, they will still get some value from it. You could find this on Pinterest or in another blog post and still be able to take the quiz.
After you figure out what type of leader you are, they explain the pros and cons of each. I really like how the designer presented this information in a different section as it stops the infographic from looking too “messy”.
11. 4 Ways To Keep Employees From Jumping Ship Infographic

We are currently in an era of high employment and there are a ton of open positions that companies can’t fill. That means that for the first time in a while, employees have a lot more power than employers.
So building a working culture where employees don’t randomly jump ship is incredibly important. You might not be able to fill that position as easily as you could have just a few years ago.
This example is a little different from the other leadership infographic examples. Instead of focusing on actionable management tips, they outline a few larger tactics that will affect your whole company.
The designer also used checkmark icons to make navigating each section very easy. Without them, there would be a wall of text under each section header. No one wants to read that! Especially when the infographic topic is so important.
What Should be Included in a Leadership Infographic?
Ready to create your own leadership infographics to train your team? Here’s what you should include:
- Explain core leadership principles, such as setting business strategy and vision.
- Expand on different leadership styles, such as transformational and situational leadership.
- Add diagrams to explain different processes, including decision-making and conflict resolution.
- Show visuals related to team building and enhancing workplace culture.
- Add leadership tips for leaders for time management, boosting productivity and maintaining a healthy work-life balance.
How Do Infographics Help in Leadership Training?
- Understand leadership concepts: Infographics breakdown complex information into simple content, which helps understand difficult leadership concepts, strategies and frameworks.
- Retain leadership strategies: The visuals in leadership infographics help readers retain information better
- Enhance engagement: A blend of text and visuals makes content more engaging. Hence, using leadership infographics in training programs can boost engagement.
Now It’s time to Make Your Own Infographic!
Hopefully, you enjoyed all the leadership infographics in this first edition of our infographic inspiration series. Please let me know what kind of infographics we should cover next.
Now if you need some more help creating an infographic, I would start here:
How to Make an Infographic in 5 Steps
And if you want to learn more about the different types of infographics, check this article out:
What Are the 9 Types of Infographics?
Further Reading:


