


You have the performance data and you know how it compares to the previous month or quarter and how it stacks up against competitors. But turning that data into a benchmark report that clearly answers “How much progress have we made and where do we stand?” is where most people get stuck.
It can be difficult to figure out which metrics actually matter, how to make fair comparisons and how to present everything with proper context. Too often, reports end up packed with data that looks impressive, but does not tell anyone what to do next.
In this article, I’ll share how to create a benchmark report using report templates, structure your analysis and avoid common comparison mistakes.
What is a benchmark report?
A benchmark report is a document that compares your performance against industry averages, competitor results, or internal targets to analyze your strengths or weaknesses. It uses KPIs, such as growth, conversion, cost, or efficiency, compared against trusted reference points.
You can use a benchmark report to:
- Show how the company’s performance compares to industry standards, competitors, or past results.
- Identify strengths and improvement opportunities.
- Provide data-driven insights for setting realistic goals and KPIs.
- Support decisions on strategy, budgets and resource allocation.
- Track progress over time and measure the impact of improvements.
According to The KPI Institute, “Through benchmarking, companies can easily determine which of their procedures would benefit more from improvement strategies and what they should do to become more productive and profitable.”
How is a benchmark report different from benchmarking analysis?
Benchmarking analysis involves deciding which KPIs to measure, gathering internal and external data and analyzing them. Think of it as the work that happens behind the scenes.
Next, you present all the findings from the analysis in a benchmark report. It is the final output with charts, tables and actionable insights for your stakeholders. In short, performance benchmarking analysis is the research and evaluation, while the benchmark report is the document that communicates the results.
For example, the Email Marketing Benchmark Report by Campaign Monitor highlights the open rates, click-through rates, etc., for different industries.
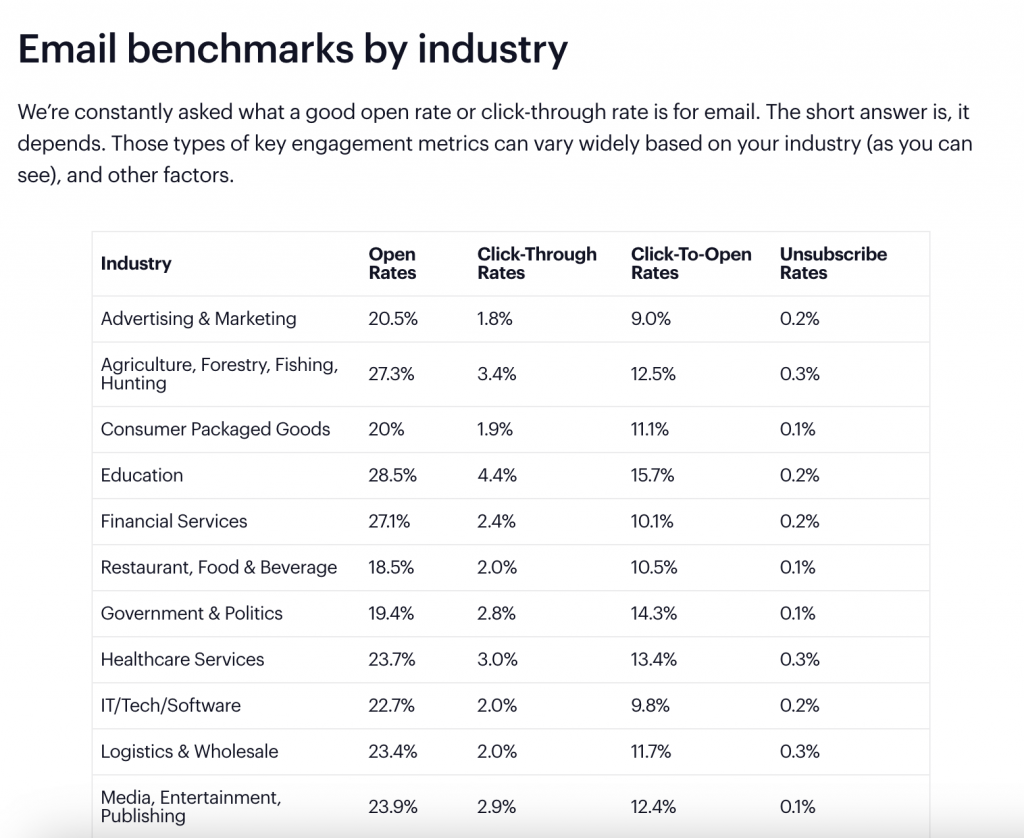
Source: Campaign Monitor
What are the key components of a benchmark report?
Many people make the mistake of just adding external numbers or industry figures into a report without the proper context.
This makes you lose sight of your own strengths and blinds you to potential opportunities. A strong benchmark report should include the right sections so it captures relevant details and shares insights stakeholders can act on.
According to Databox, “Benchmark data can be extremely valuable during monthly or quarterly meetings where you need to showcase your results to clients or company shareholders.”
Research by Databox also suggests that most companies practice and report different types of benchmarking, including internal and external benchmarking. However, more than 46% of companies only report performance benchmarking and do not practice it.
Here’s what to cover in a benchmark report:
- Clear objective or KPI being measured: State exactly what you’re measuring and why it matters. The key is to connect the KPI to your business goals so it’s clear how tracking it impacts performance. For example, a product-led company might focus on adoption rates or feature usage.
- Benchmark data (internal vs. external sources): Combine internal data, such as past performance or team metrics, with external benchmarks like industry averages or competitor results. This gives you context and helps stakeholders see the bigger picture.
- Analysis framework: Explain how you’re comparing the data. It could be month-over-month, year-over-year, or against a competitor group. This helps explain how you found the insights.
- Visual representation (tables, charts, dashboards): Use visuals to make data easier to interpret. Clear charts and tables help stakeholders quickly spot trends, gaps and outliers.
- Insights and recommendations: Close with practical takeaways. Point out where you’re doing well, where there are gaps and what steps to take next. This is where the report shifts from information to action.
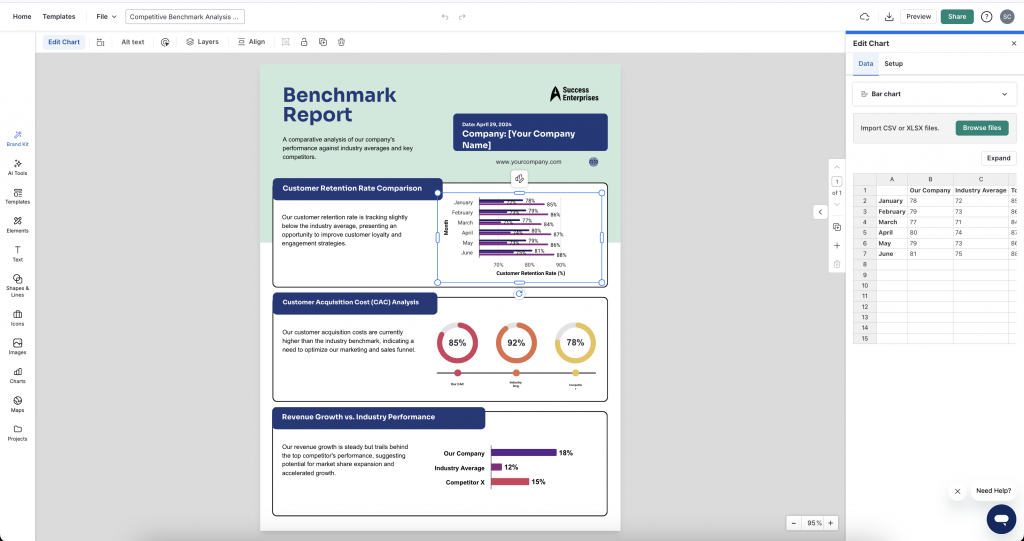
Here’s the Venngage Data Storytelling Benchmarking Report Template you can use to go beyond raw numbers and present a clear comparison of industry benchmarks against your own performance. The template is designed for data storytelling, so instead of overwhelming stakeholders with tables, you can highlight patterns, gaps, and key takeaways through visuals.
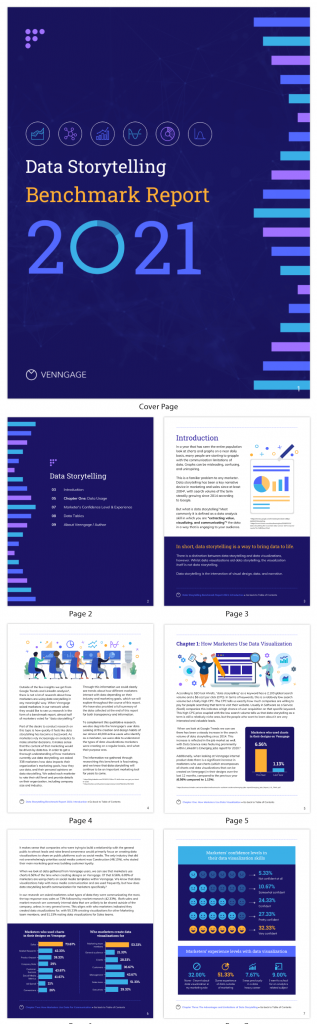
This works especially well for quarterly or annual reviews where you need to show both internal progress and how you stack up against competitors.
Related: How to Create a Market Analysis Report
What are the steps of benchmarking?
Let’s see the step-by-step benchmarking process.
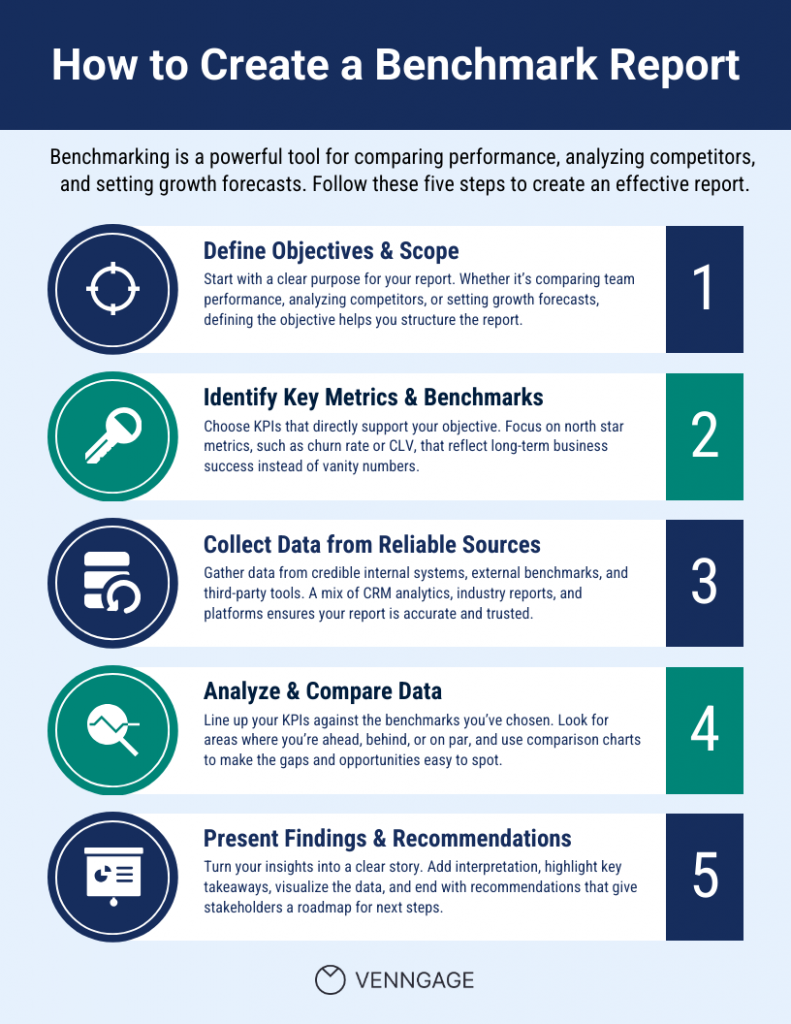
Step 1: Define objectives & scope
There are multiple use cases for a benchmarking report. You can:
- Compare team performance against past results.
- Run a competitor analysis.
- Use benchmarks to set goals and forecast growth.
The first step is to narrow down your objective based on the type of report you want to create.
For example, if your goal is competitor analysis, your report would include external benchmarks like market share, pricing models, or customer acquisition cost (CAC).
Let’s say if you’re doing a comparative analysis of internal performance, the focus shifts to historical data reporting, such as month-over-month sales, retention rates, or feature adoption.
Once you know the purpose, you’ll know whether to pull information from internal systems like your CRM and product analytics, or from external sources like industry reports, market surveys, or competitor filings.
Richard Hanson, Associate General Counsel – Ethics & Compliance at Smiths Group plc, explains the importance of benchmarking. “It is tempting to replicate the measures of others. You will always know where you stand in the pack. But are you asking the questions and gaining the knowledge that is relevant to you? Many industry surveys ask about whistle-blower line awareness. At Smiths, we ask whether people know how to use the whistle-blower line. This is a more challenging question, but it shows how effective our message is. We find that fear of speaking up falls when people understand more about how the system operates.”
Step 2: Identify key metrics & benchmarks
Now, list down the key metrics that tie back to your objective. Each KPI should directly reflect the goal you’ve set in Step 1.
For example, if your goal is to evaluate customer retention, measuring website traffic would be meaningless. Instead, you’ll want to monitor metrics such as churn rate, repeat purchase rate, or average subscription length.
A pro tip here is to focus on north star metrics that best represent long-term success for your business.
Examples of north star metrics:
- SaaS companies: Customer retention rate, churn rate, customer lifetime value (CLV), monthly recurring revenue (MRR)
- Marketing teams: Lead-to-customer conversion rate, cost per acquisition (CPA), marketing-qualified leads (MQLs) to sales-qualified leads (SQLs) ratio
- Product teams: Daily active users (DAU), feature adoption rate, time to first value
- E-commerce: Repeat purchase rate, average order value (AOV), customer retention rate
For example, the State of Content Marketing Report by Semrush compares the key search terms related to content marketing for two consecutive years.
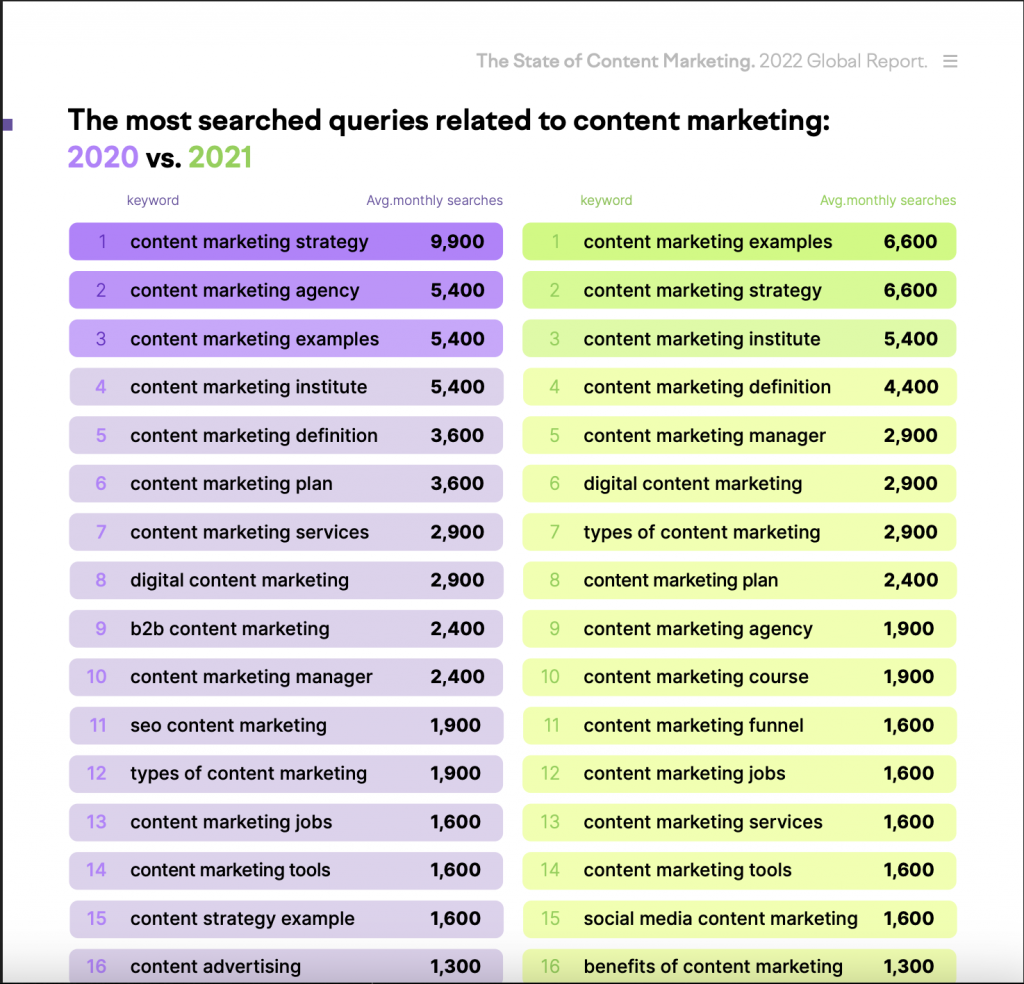
Source: Semrush
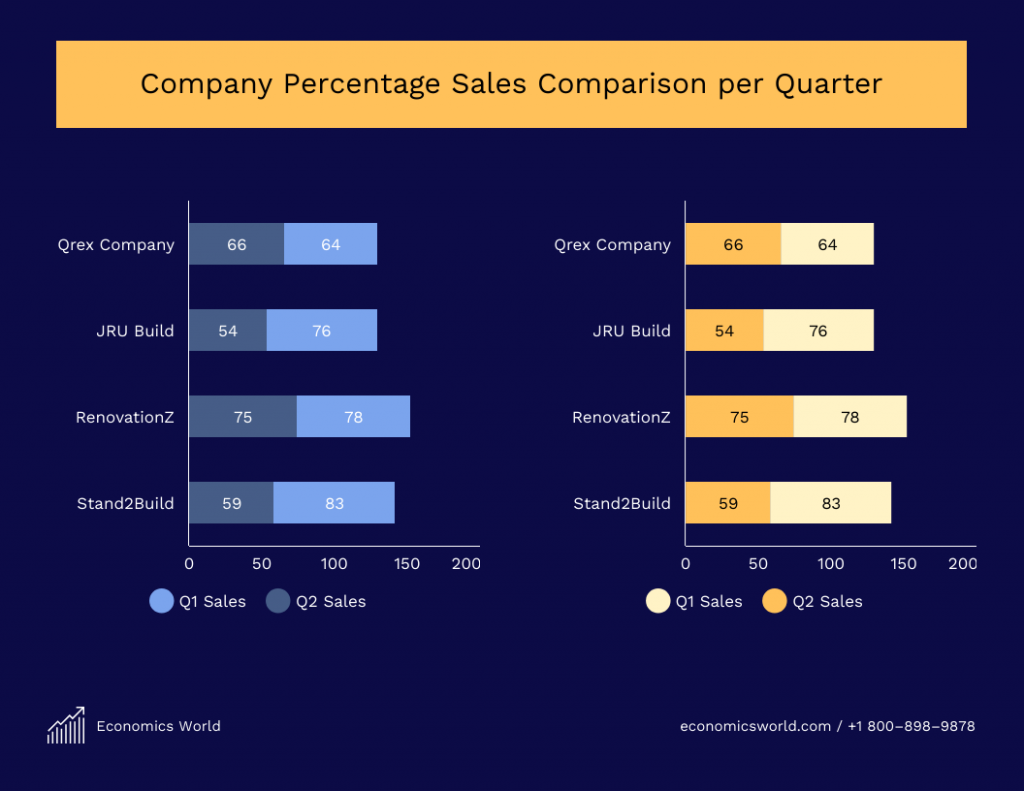
If you want to create a simple benchmark report to show team progress, you can use this stacked bar chart template. This makes it easier to compare past vs. latest performance side-by-side.
Step 3: Collect data from reliable sources
Now, the pre-planning is done and it’s time to collect and analyze benchmark data. Remember to use only credible sources of data based on the metrics you are tracking.
Types of data sources to consider:
1. Internal sources
If you’re comparing internal team performance, rely on your own systems. This could include CRM reports, product usage analytics, sales data, financial records, or employee productivity metrics. Internal sources give you a clear baseline of how your team or business has performed over time.
2. External sources
For growth forecasting and planning, external benchmarks help you set realistic targets. Use industry reports, analyst studies, government databases, or market surveys. These provide a broader view of how your business compares to industry standards.
3. Third-party tools
For competitor analysis, specialized tools and datasets are invaluable. Platforms like Gartner, Forrester, Statista, or SaaS-focused tools such as AgencyAnalytics can provide standardized metrics across competitors and markets.
Step 4: Analyze and compare data
Now, you need to line up your metrics against the benchmarks you’ve chosen. This is where raw numbers start turning into insights.
Look at the KPIs side by side and identify patterns:
- Where are you outperforming?
- Where are you falling behind?
- Which gaps are the most critical to address?
For example, your churn rate may be lower than the industry average, but your customer acquisition cost (CAC) could be significantly higher. That contrast shows you’re retaining customers well but spending too much to acquire them. Benchmarking gives you this context so you can move beyond surface-level performance and see the bigger picture.
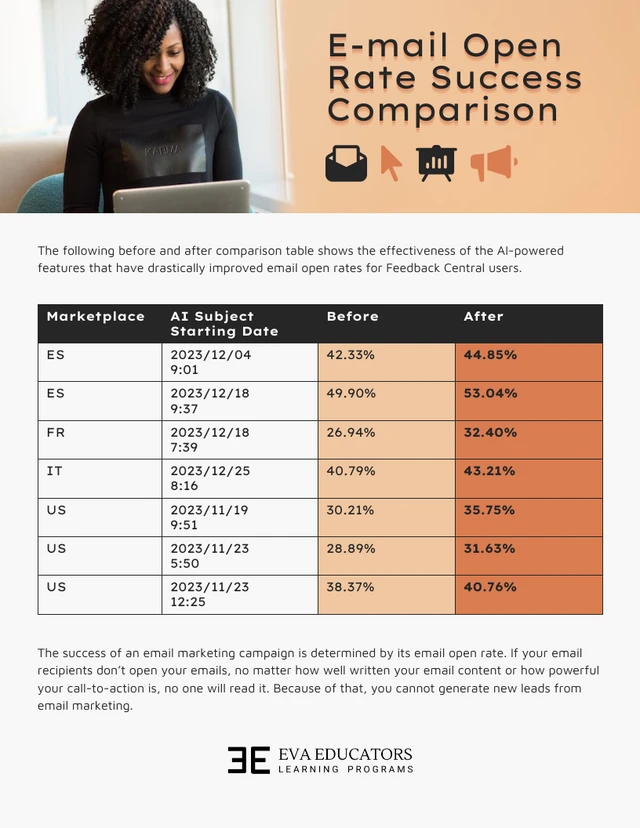
You can use a comparison chart template for this.
According to Zendesk, “Benchmarking pushes you to grade yourself relative to other companies like you, instead of past performance. Holding your organization to the industry standard keeps the focus on being the best among many, not the company’s best version of itself.”
Step 5: Present findings and recommendations
Once you compare all the metrics and have relevant insights, consolidate them to create a benchmark report. This is where you need to build a narrative and help stakeholders make sense of the data.
Here are a few tips to present findings for your benchmarking report:
- Add interpretation: Explain what each number means and why it matters. For example, if CAC is 20% higher than the industry average, explain what that implies for growth or profitability.
- Highlight the key takeaways: Summarize the 3–4 most important insights upfront so stakeholders don’t need to go deep into each page.
- Use AI tools to simplify visualization: Try data visualization tools like Venngage’s AI Report Generator to turn data into charts easily.
- Tailor recommendations to your audience: Investors may want to see financial efficiency ratios, while internal teams may care more about operational improvements. Frame your recommendations in a way that answers their priorities.
- Close with actionable next steps: End the report with clear recommendations: what needs to be improved and how progress will be measured moving forward.
Related: 20 Professional Report Cover Page Examples & Templates
How to create a benchmark report in Venngage?
Here comes the tricky part now: visualizing data to present the findings. Many people still rely on Excel for this, but unless you’re fluent in formulas, it can feel clunky and the visuals don’t always tell the story you need.
Venngage makes this part simple. It offers ready-to-use benchmark report templates to create a professional report without advanced design or data skills.
Here’s how you can create a benchmark report in Venngage in a few simple steps:
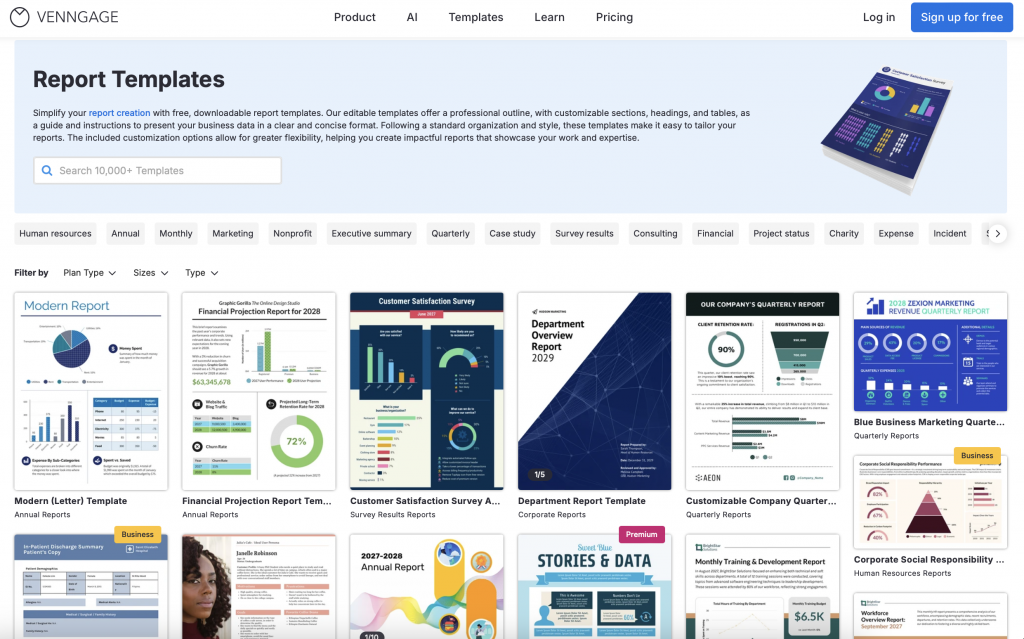
Step 1: Select a template
Venngage has a vast library of report templates with relevant charts and images. Browse through the templates and select a relevant one based on the industry, theme, etc. You can easily edit the text, swap images and add charts.
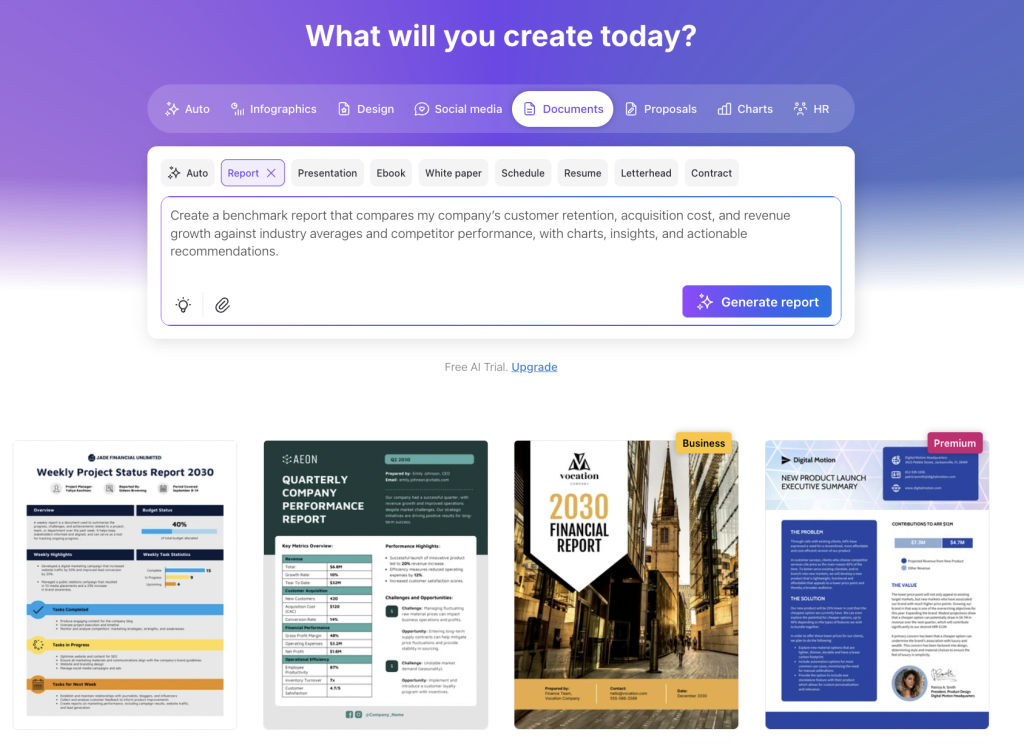
If you want a quick solution, try Venngage’s AI Report Generator to create a benchmarking report from text. This saves you from staring at a blank page and gives you a structure you can build on.
Step 2: Input data or import it directly
Instead of manually building charts, you can upload data from a CSV or connect a Google Sheet. Venngage will populate the visuals automatically.
If you’re working with text-based insights or need to quickly add metrics without reformatting everything, use the AI Autofill option.

Step 3: Customize visuals (charts, tables, brand colors)
Edit chart values directly in the template or select new visual formats from the Charts menu.
You can also use Venngage’s My Brand Kit feature to add your brand color palette, font, etc.
Step 4: Add insights, context and recommendations.
Numbers alone don’t tell the story. Use text boxes, annotations and highlights to explain your findings and outline recommendations. Venngage’s drag-and-drop editor makes it simple to arrange visuals and insights into a cohesive report that stakeholders can act on.
Step 5: Collaborate with team members and export the benchmarking report
You can invite team members to edit, leave comments and refine the design together in real time. This makes the process faster and ensures the final report reflects everyone’s input.
Once the report is ready, you can export it in different formats depending on the audience. Download a PDF for investors, create a PowerPoint version for presentations, or share an interactive link for internal teams who need to explore the data. The flexibility makes it easy to adapt one benchmark report for multiple stakeholders without having to redesign it each time.
Common mistakes in benchmark reporting and how to avoid them
Creating a benchmark report takes real work. You gather data, analyze it and structure everything into a story. But that effort only pays off if the report actually helps you reduce costs, improve quality, or understand why you are falling behind competitors.
Here are a few common mistakes you should avoid while creating a benchmarking report.
Comparing mismatched data
You cannot compare a startup to a multinational corporation and expect useful insights. Many team benchmark themselves against companies that are twice their size or operate in completely different markets. They also mix up basic data, such as putting annual revenue next to quarterly sales, or comparing costs in different currencies without converting them.
Best practice: Make sure your comparison group actually matches your situation in size, market and business model. Then normalize all your data. Convert everything to the same currency, align time periods and confirm you are measuring the same things in the same way.
Presenting raw numbers without showing the gap
Simply placing two numbers side-by-side hides the real performance difference. A churn rate of five percent compared to an industry average of eight percent sounds positive, but the impact becomes clearer when the actual gap is shown.
Best practice: Calculate both the absolute difference and the relative percentage. This makes the performance gap obvious and easier for stakeholders to interpret.
Reporting only averages
When you only benchmark at the company level, you miss what is really happening. Your overall numbers might look fine while one product line is struggling or one region is crushing it.
Best practice: Break your benchmarks down into smaller pieces. Look at different products, regions and customer types. This is where you find the real insights.
Relying on vanity metrics
It is tempting to showcase numbers that look impressive, such as website visits or social media impressions. They add volume to a report but rarely provide strategic value.
Best practice: Focus on meaningful ratios and composite metrics, such as CAC, LTV, retention rate, or weighted indexes to track long-term performance.
Leaving out context
Numbers without context are just numbers. When you say your churn rate is five percent, that means nothing unless people know what is normal and what is good.
According to Bernard Marr, a business and technology specialist, “In most cases, the benchmark data being compared is stripped of its short-term and long-term context, meaning it tells you what a competitor or internal team has achieved, with no information on how they achieved it. This makes it difficult to pinpoint meaningful areas for improvement.”
Best practice: Place results in context. Use rankings or percentiles, such as top ten percent, middle of the pack, or below average, so stakeholders immediately understand where you stand.
Treating the report as a one-time snapshot
A static benchmark report shows where you are today, but not whether you are improving, stagnating, or falling behind. This limits its usefulness.
Best practice: Pair snapshots with trends. Include historical comparisons to show how performance is shifting over time relative to benchmarks.
Ignoring data quality
Outliers can throw off an analysis. A competitor claiming an unusually low churn rate may not be representative, yet including it without review can skew the results.
Best practice: Validate anomalies and clarify whether they are included or excluded. Transparency around data quality builds trust and credibility in your report.
Create a benchmark report with Venngage
A benchmark report should tell the story: where you stand today, how you compare to competitors and what actions will move you forward. That requires clear objectives, the right KPIs, credible data and a format that makes insights easy to understand.
This is where Venngage can help. With templates, AI-powered reports and easy-to-use data visualization, you can turn complex metrics into charts and insights that stakeholders actually care about.
FAQs on benchmark reports
1. What is the purpose of a benchmark report?
A benchmark report helps you compare your performance against industry standards, competitor results, or internal targets. Its purpose is to identify strengths, uncover gaps and guide business decisions with data-backed insights.
2. How do you write a benchmark report?
First, define your objectives and choose the right KPIs. Then gather internal and external data, analyze it against benchmarks and present your findings in a clear, visual format. You should also add context and recommendations to make the report actionable.
3. What should a benchmark report include?
A complete benchmark report includes the objective, KPIs being measured, benchmark data (internal and external), an analysis framework, visual comparisons such as charts and tables and clear recommendations for next steps.
4. What are common mistakes in benchmark reporting?
Common benchmarking mistakes include comparing mismatched data, using vanity metrics, reporting only averages, or leaving out context. Instead, you should normalize data, segment results and focus on meaningful KPIs tied to business goals.
5. How often should benchmark reports be created?
Most teams create benchmark reports quarterly or annually. The frequency depends on your industry and goals. If you are in a fast-moving sector like SaaS, you can create quarterly benchmarks. However, if you want data for long-term strategic planning, you can create annual benchmark reports.


