


To most people, data is incredibly boring. However, it’s also incredibly necessary for the efficient operations of any business. This means that the people who truly understand data, need to find ways of presenting it so that others can understand it, too.
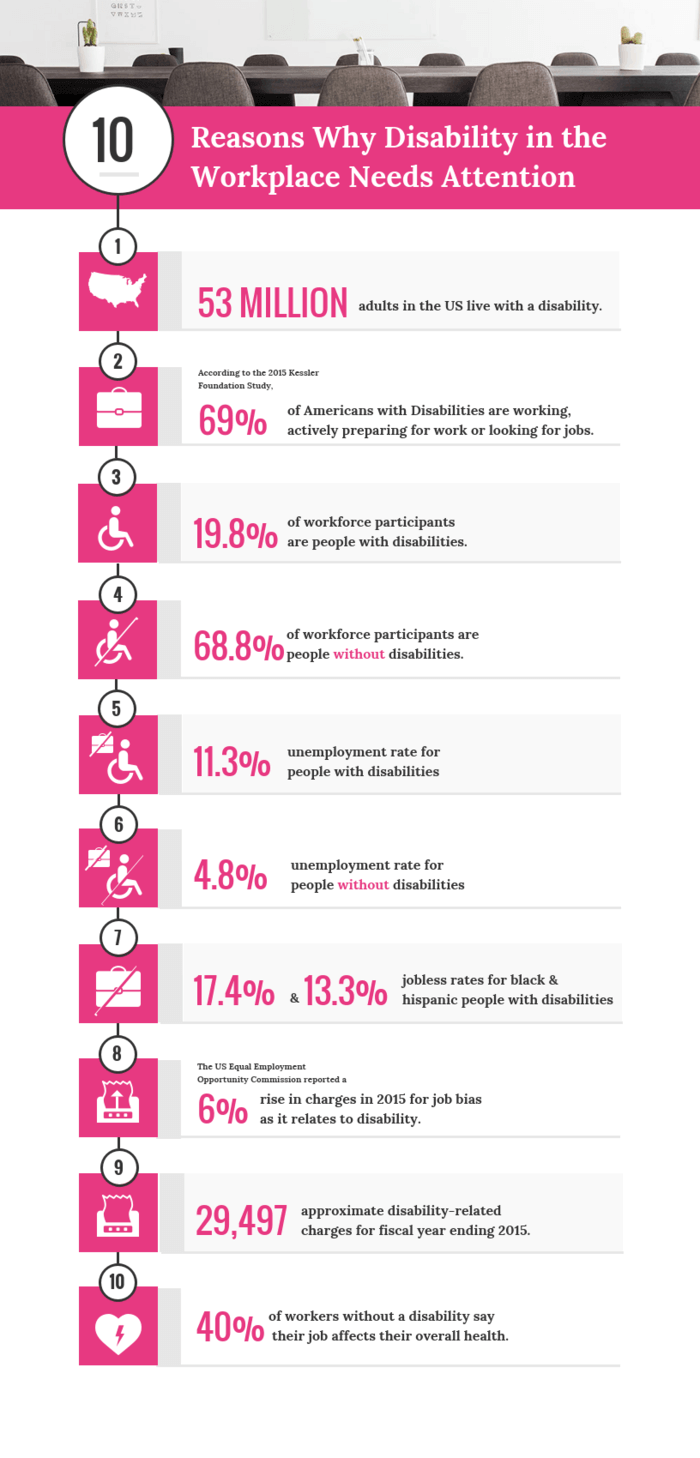
The data in the infographic below could have been presented as a paragraph of text. But as data visualization, it’s more impactful.

If you want to create a high-quality data report you should be able to support your facts and present them in a way that will entice or entertain your audience. Let’s tackle some techniques on how to create an eye-catching data report that reaches your business goals.
Start the report-making process on a positive note with Venngage’s Report Maker. No design experience required!
Click to jump ahead:
What is a data report?
A data report, like the infographic below, is how you present data in a way that is both understandable and actionable. Reports can be presented in a variety of formats that have come a long way from the old-fashioned lists of numbers on a document.

Modern data reports must be visually engaging to help make the data more accessible to all. They may be presented in forms such as graphs, pie charts, infographics, PowerPoint presentations, and more; whatever best suits the data being presented and who it’s being presented to.
What are the basics of data reports?
Purpose of data reports
There are many reasons why data is crucial for how your business operates. It gives you exact information on various aspects of every area of operations so that you can make strategic changes when needed.
It can allow you to accurately forecast demand so you can improve customer satisfaction or present alarming statistics that will stir people to action.
Types of data reports
The data you use, and how you present it, can vary greatly. For example, the data you collect from a warehouse management system may look very different from the data you collect from a POS (point of sale) system. There are two main types of data reports:
- Static
Static reports typically present data from a single source and provide historical data, such as seeing a drop or increase in eBay sales if you own an online store. This type of report is both easy to create and easy for any reader to understand.
- Interactive
Interactive reports are more dynamic and will usually present real-time or current data. Think about the kind of dimensions you can track in Google Analytics, for example. The advantage of interactive reports is that because they show current data, they allow you to look more closely at what’s happening now and take action if and when needed. For instance, with cloud-based POS systems, interactive reports can reflect live sales and inventory updates, allowing for quicker decision-making and immediate response when needed.
Accessibility of data reports
Data reporting needs to be as accessible to your audiences as possible. With the advent of business intelligence (BI) tools, particularly cloud-based ones, you don’t need to be an IT expert to access and create reports.
You can easily use tools such as Google Data Studio to present information, such as the demographic data infographic below.

Different team members can collaborate on reports, giving you a better overview of how your business is performing. With Venngage’s real-time collaboration feature, working with team members becomes much easier.

With such flexible modern tools, it’s not only easier to create good data reports but also to disseminate them via different channels, from automated emails to presenting them via a dashboard report or via a specific app.
How to write a high-quality report
Know the audience for your report
Why are you creating a report and who is it for? These are two essential questions of data reporting that will help to decide what data is used and how you present it.
An annual report may just be an overview of how the business has performed so that relevant stakeholders can see it. Other reports may be created for specific reasons such as presenting financial data.

The ‘who’ is as important as the ‘what’. The report you present to a potential client will probably look very different from a report created for your C-suite requesting the purchase of an on-premise system to improve enterprise planning.
For an external report, you’re more likely to be creative in the use of fonts and graphics than you would be with an internal one.
A branded report is always more impactful. Use Venngage’s My Brand Kit to import branding assets from multiple organizations, including logos, fonts, and colors. Then you can apply the brand to any design with just one click.

Have a detailed plan and choose the appropriate metrics
You need to identify what data matters (or matters most). The first step to doing that is to consider what you want to achieve from the data and the related reports. By doing so, you can eliminate the ‘white noise’ of unnecessary data that may end up hiding the numbers that really matter.

Different reports will, of course, call for different data sets. Generally, your data will come from (and give insights into) one area of your company. For example, if creating a report on customer retention, then a major piece of data is going to be your churn rate. Reports may be created for specific reasons. These can include:
- Recommendations: These could be to encourage some changes to current systems and processes. For example, a manager may want changes to the current task management process, and a data-driven report could highlight flaws in the current process.
- Risk/feasibility: Maybe a significant change is planned to your business model, such as switching production to a whole new line of products. Risk and feasibility reports can help assess any risks involved and the potential success of any new plan.
- R&D (research and development): Many businesses thrive and scale through innovation. Data and reports based on R&D can influence decisions on what direction a business should take.
- Regulation/Compliance: All industries face some sort of regulatory requirements. These can include things such as PCI regulations for merchants who take payments by credit cards. Data in reports can illustrate how well you’re complying with such regulations, as well as highlighting any areas that need improving.
- KPIs and metrics: This data can be like a major health check for your organization. It demonstrates how well you’re performing in the measured areas such as sales statistics. It can also help you see where you may need to implement new processes, such as order management solutions.
Your KPIs will demonstrate how well, or not, your previous planning and strategic decisions are working. They can also influence every major decision regarding your business as you move forward, including scalability, budgeting (in every area), marketing campaigns, and so on. Summary reports can help illustrate your results concisely.

When working with KPI data, there are a few questions you should consider:
- What do you need to know from the metric report or data?
- Will the data presented on your dashboard report actually help inform decisions?
- What insights do the readers need to gain from this report?
- Which KPIs are relevant and should be included in any report?
- Are other KPIs not primarily relevant, but would offer benefits if included?
Easily add charts to your reports with Venngage. Import data from a Google sheet or CSV file and the editor automatically populates the data into your report.

Visualize data in your reports
Effective data visualization can transform boring numbers into something engaging and interesting. There are many ways to visualize data nowadays, from using the report generation capabilities of business intelligence (BI) dashboards or Google Data Studio to utilizing effective report templates like the one below.

Some examples of good templates include:
As with other areas of reporting and analytics, it’s important to consider the reason for the report and who will be viewing it. While you may be more creative with a report designed as a pitch for a new customer, you don’t want to go overboard. Use visuals that effectively communicate what the data says in a concise and understandable format.
You should also consider how people will view the report. While some reports may be presented at a meeting as a slideshow or presentation, other reports may be sent to relevant stakeholders in an email or other formats. This means you have to make sure that any visualizations can be viewed on multiple device types.
Make an actionable data report
Some reports may be purely for informational purposes, but the majority are designed to influence and inform decisions and actions. There’s little point in cramming such a report full of great data and visualizations without some sort of conclusion that can lead to those decisions and actions.
You need to go beyond your report simply showing “how things are” and add in “this is what we need to do to change or improve”. Think of it as being an operational CTA (call to action) that demonstrates what steps and decisions should be made next. You should also be showing why those decisions are needed and the benefits they will bring.
Use the right chart or table

Graphs and tables can be an integral part of a data report, but you don’t want them to be confusing or misleading. Before you create a graph or table, ask yourself the question: “What do I want this to show?” These are visual representations of particular aspects you want to report on, such as increases in conversion rates by season.
Make your report easy to read
Whether presented virtually or as hard copy, you want people to be able to read any report easily. That means carefully considering any use of fonts, themes, colors, and backgrounds. For example, white font on a light background will be difficult to read. It is worth having your report “proofread” by at least two colleagues to ensure readability.

The takeaway
Data, and data reporting, have come a long way in recent years. Gone are the dull lists of figures, to be replaced by reports that can be both visually engaging and also insightful. And though visually engaging is a great thing to be, that insightfulness is the primary aim of any data reporting you do.
Any report needs to be of high quality and must engage the reader well, but it must also inform them as much as possible, especially when the data reporting seeks to influence important strategic or operational decisions. Good data reports can be the fuel that drives your business upwards and forwards.
Need help making a data report? Create one in minutes with Venngage’s easy-to-use drag-and-drop editor.


