
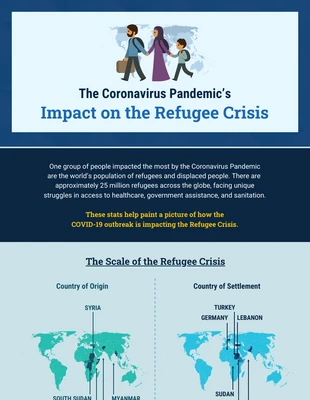
Pandemic Impact On Refugee Statistical Infographic Template
Explain pandemic statistics and more by modifying this Pandemic Impact On Refugee Statistical Infographic Template

 100% customizable templates
 Millions of photos, icons, charts and graphics
 AI-powered editing features
 Effortlessly share, download, embed and publish
 Easily generate QR codes for your designs
- Design stylemodern
- Colorslight
- SizeCustom (816 x 1264 px)
- File typePNG, PDF, PowerPoint
- Planfree
Make a bold pandemic impact infographic and more with this Pandemic Impact On Refugee Statistical Infographic Template. Customize it with images, large headings, and a professional color palette to make it pop off the page. Start off personalizing the Pandemic Impact On Refugee Statistical Infographic Template with images that reflect the statistics. The Venngage gallery is packed with thousands of quality stock images and you can add them where you want and change their size for the perfect statistical infographic. Once you've integrated your own text, add large headings so that each statistic is more prominent. Highlight the headings and pick the point size that works with your pandemic infographic. Tie it all together by choosing a professional color palette that compliments the images. Craft your own color palette, or use one of the pre-generated professional color schemes from Venngage and add it to the infographic. Not sure if it's the right infographic for you? Check out Venngage for more modern statistical infographic templates on Venngage!
Related Infographic Templates
environment infographics
geographic infographics
nutrition infographics
statistical infographics
company infographics
creative infographics
nutrition infographics
water infographics
medical infographics
timeline infographics
tree infographics
covid infographics