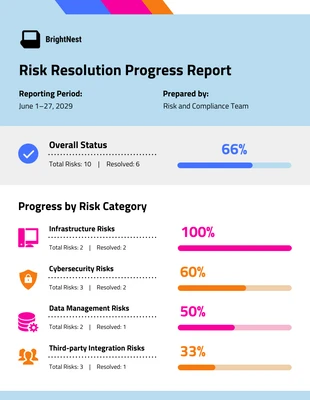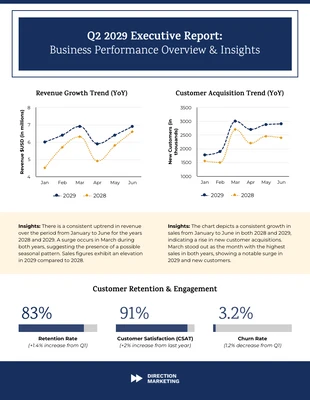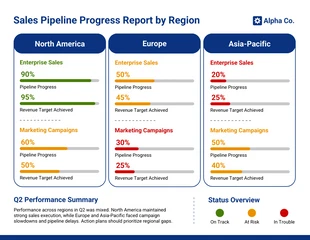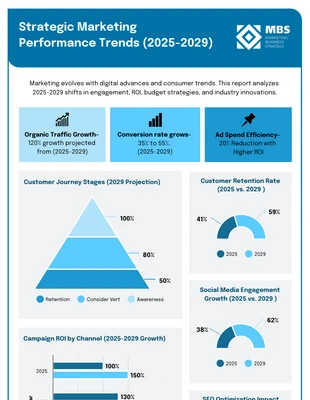
Data Storytelling Benchmarking Report Template
Design a captivating benchmark report and more by editing this Data Storytelling Benchmark Report Template
100% customizable templates
Millions of photos, icons, charts and graphics
AI-powered editing features
Effortlessly share, download, embed and publish
Easily generate QR codes for your designs
- Design stylemodern
- Colorsdark
- SizeLetter (8.5 x 11 in)
- File typePNG, PDF, PowerPoint
- Planpremium
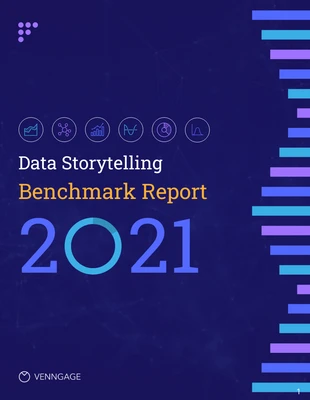
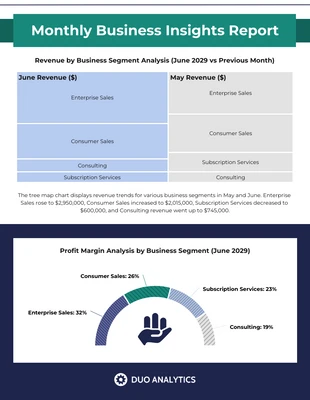
Produce a spectacular benchmark report and more with this Data Storytelling Benchmark Report Template. Incorporate a dramatic color scheme, add images, and insert icons for a creative report design. Make the Data Storytelling Benchmark Report Template your own by applying a dramatic color scheme that will instantly captivate the reader. Use one of Venngage's automated color palettes, or customize a fresh dramatic color scheme with the colors you want for the report. Next, integrate images to break up the report and to make it more interesting to read. Browse through the Venngage gallery for images that correspond to your content and add them to the data storytelling report. Utilize icons to let the reader visualize the data and to break up large amounts of text. Choose from thousands of quality icons in the Venngage gallery and insert them into the Data Storytelling Benchmark Report Template. Not quite the report you were looking for? Search the Venngage library for more innovative marketing report templates!

