The right tool for the right job is a saying worth keeping in mind.
For example, if you want to make a slideshow, everyone knows you’ll need Microsoft PowerPoint. But when making a Venn diagram, is it still the right tool?
Although PowerPoint can be used to make a Venn diagram, whether it’s the best is debatable, especially when there are options like Venngage’s Venn diagram maker.
In this post, I’ll teach you how to make a Venn diagram in PowerPoint, and then show you how to use Venngage. You be the judge to see which of the two is better.
If you don’t want to start creating from scratch, check out our customizable Venn diagram templates instead to create stunning Venn diagrams in no time.
Click to jump ahead:
- What is a Venn diagram used for?
- History of Venn diagrams
- How to make a Venn diagram PowerPoint presentation
- Should you use PowerPoint to make Venn diagrams?
- Why use Venngage when making a Venn?
- How to make a Venn diagram in Venngage
- FAQs about Venn diagrams
What is a Venn diagram used for?
A Venn diagram can be a useful tool for visualizing data, and help you see relationships between different data sets.
For example, if you want to compare different groups of data, a Venn diagram helps you see how they are related. Or, if you want to find the amount of data in each group, a Venn diagram shows you where the data is concentrated.
The overlapping areas of Venn diagrams represent the overlap between the two sets.
In other words, the Venn diagram shows how much each set has in common with the other set.
There are a few different ways to create a Venn diagram. The most common way is to use circles, but you could also use squares or rectangles. You can also create different types of Venn diagrams depending on how you want to show the data.
For example, you can create a Venn diagram that shows all the possible combinations of two sets, or you can create your own Venn diagram that shows how the data is distributed within each set.
History of Venn diagrams
A Venn diagram was first invented by John Venn in 1881. Venn was a mathematician, and he created the diagram to help him with his work. At the time, there were no tools for visualizing data, so Venn came up with the idea of using overlapping circles to represent data.
Venn diagrams were quickly adopted by other mathematicians, and it soon became popular among scientists and researchers. Today, the Venn diagram is used in a variety of fields, including mathematics, statistics, computer science, and marketing.
How to make a Venn diagram PowerPoint
If you want to create a Venn diagram in a Powerpoint, there are a few steps you need to follow:
Create the circles
First, you need to create the basic diagram using circles or squares on the Shapes drop-down menu, which is found in the Insert tab.
Since you’re making a Venn diagram, the circles should have an overlapping area with the one adjacent to them, and another overlapping area with all other circles in the middle. Shapes, however, are opaque by default, so you’ll have to either select Shape Style or right-click the shapes and select Format Shape.
Put labels and data
Next, you need to add labels and data to the diagram using text boxes. Select Text Box on the Insert tab, and then add as many text boxes as you have to.
Do the finishing touches
Finally, merge shapes and format the presentation so that it looks neat and professional. For the header of the page, which is where you’ll put the title of the graph, you can go to the Design tab to make the title more stylish.
Use SmartArt graphics
Alternatively, an easier way to create a Venn diagram in Powerpoint is to use a SmartArt graphic. Simply open it, go to the Relationships tab on the SmartArt graphic dialog box, and choose the kind of Venn diagram you want. Apart from basic Venn, there is also the radial Venn and the linear Venn diagram designs.
Should you use PowerPoint to make Venn diagrams?
As you’ve already learned, it is indeed possible to use PowerPoint to make a Venn diagram. However, there are two reasons why you’re better off making a Venn diagram from other apps.
First, the method involving the Shapes menu for Venn diagrams Powerpoint takes much time and effort. Plus, the circles and overlapping areas in a Venn diagram have to be of the same sizes, which can be difficult to do if you’ll make it manually.
The second reason is that Venn diagrams made through Powerpoint lack much style and color. The difficulty of making equally sized circles and overlapping areas can be avoided by using SmartArt, but both methods produce overly simple Venn diagrams. This is the case even when you exhaust all the formatting options available.
Why use Venngage when making a Venn?
Don’t be content with PowerPoint’s Venn diagram maker! There are many apps out there; use them to make a Venn diagram and then paste it on a Powerpoint slide. However, if you’re looking for a more professional and detailed Venn diagram, we suggest using Venngage. In fact, it’s where we got the name.
Our infographic maker has a wide variety of templates and tools that make will make it easy for you to customize the Venn diagram layout however you like. After all, aside from its usual uses in the corporate setting and academia, the Venn diagram can also be used for simpler, more creative, and more entertaining purposes.
Take this template, for example. Rather than presenting the usual data or grouping items into sets, this template has been used to make simple durian dessert recipes.
Lastly, Venngage is a way simpler tool than PowerPoint. It offers more shapes, fonts, and customization options, so you can create a professional-looking diagram in minutes.
Our platform is easy to use, even for those who are not experienced in design. Plus, our team is always available to help you with any questions or problems you may have.
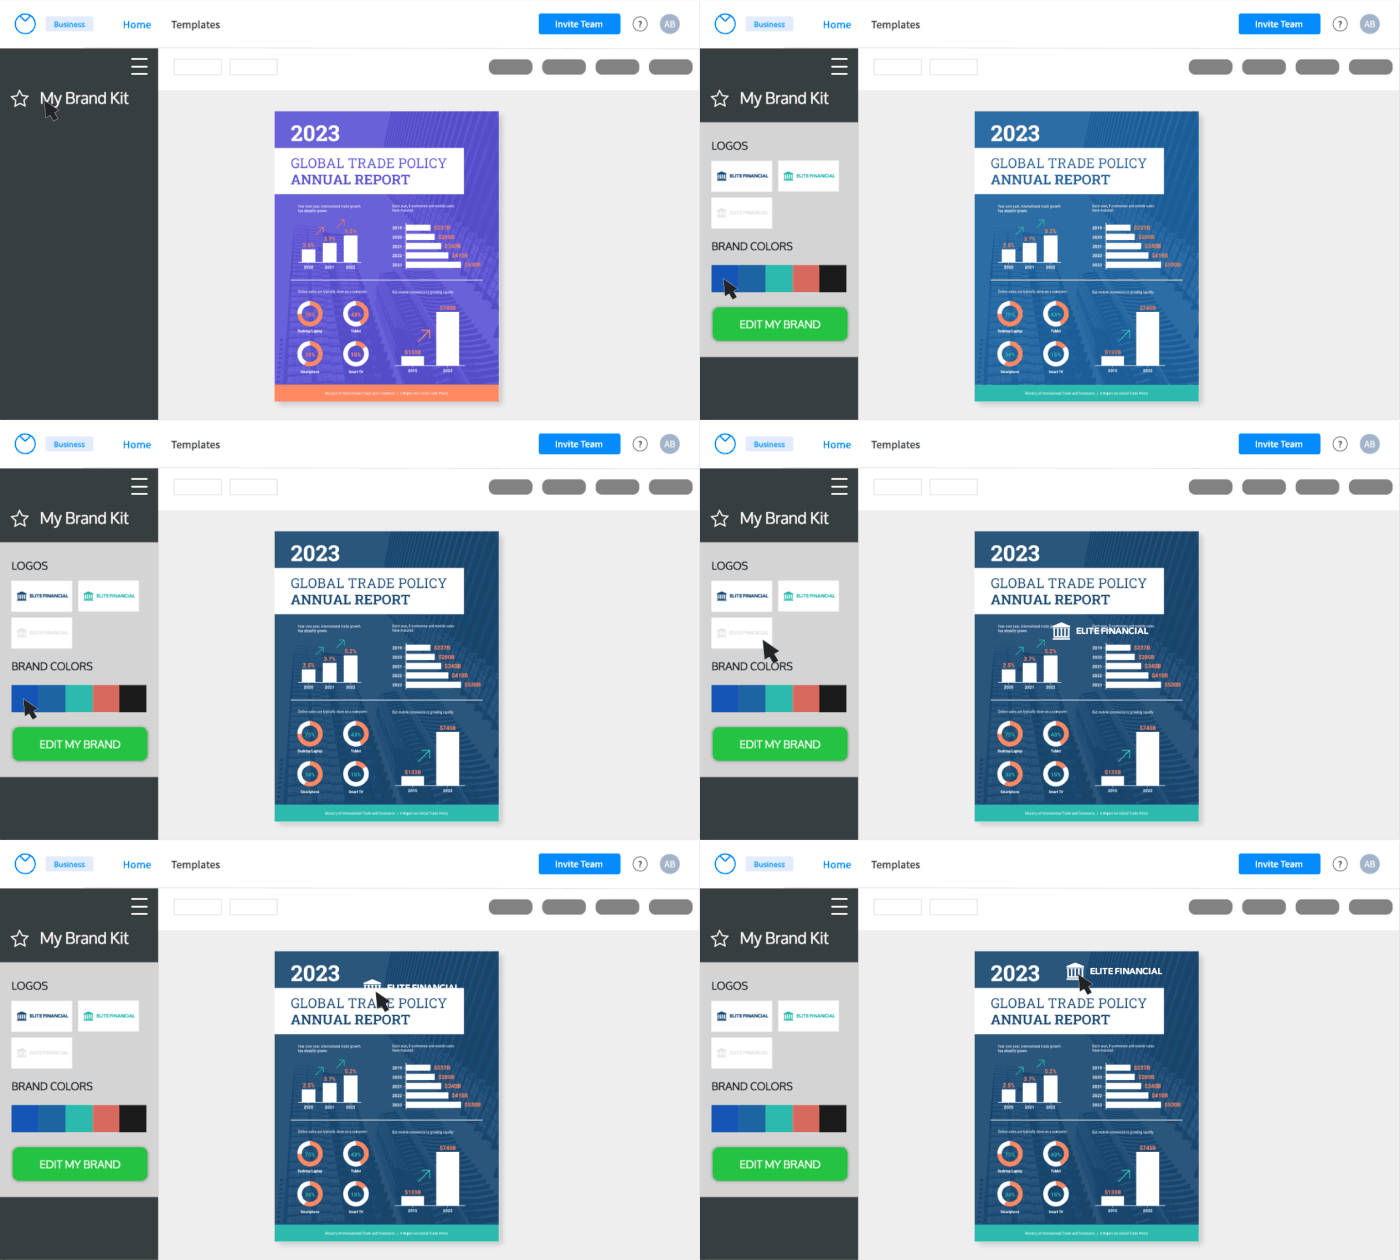
Venngage also has a business feature called My Brand Kit that enables you to add your company’s logo, color palette, and fonts to all your designs with a single click.
For example, you can make your Venn diagram template reflect your brand design by uploading your brand logo, fonts, and color palette using Venngage’s branding feature.
Not only are Venngage templates free to use and professionally designed, but they are also tailored for various use cases and industries to fit your exact needs and requirements.

A business account also includes the real-time collaboration feature, so you can invite members of your team to work simultaneously on a project.
Venngage allows you to share your Venn online as well as download it as a PNG or PDF file. That way, your design will always be presentation-ready.
So if you’re looking for a platform that can help you easily create beautiful Venn diagrams, and other types of compelling visuals, Venngage is the tool for you.
How to make a Venn diagram in Venngage
Creating a Venn diagram in Venngage is easy. All you need to do is select the Venn diagram template and add your data.
- The first step is to add the circles. You can do this by selecting the “Circles” tool on the menu, or you can simply draw them yourself.
- Next, you need to add the data. You can do this by selecting the “Text” tool on the menu and then add your text.
- Finally, you need to format the diagram. You can do this by selecting the “Style” tab on the menu. This will allow you to change the color, font, and size of the text. You can also add borders and shadows to the diagram. Once you’re finished, you can export the diagram as a PDF or JPEG file.
FAQs about Venn diagrams
Can I use Venngage’s Venn as a PowerPoint template?
Absolutely. In fact, this is what is recommended. You don’t have to be stuck with the more rudimentary ways of making a Venn diagram in PowerPoint. Instead, just bring the Venn diagram you made in Venngage to your PowerPoint presentation.
Can you make a Venn diagram on Google?
Yes, you can make a Venn diagram on Google by using the Google Drawings tool. This is a free online tool that allows you to create diagrams, including Venn diagrams. Venngage, however, is still the superior choice.
How do you create overlapping shapes in PowerPoint?
It’s simple: you only have to place a part of a shape on top of one another. Shapes in Microsoft Office apps, however, are opaque by default, so you won’t be able to make an overlapping area unless you adjust their transparency.
To do that, you can either change the Shape Style, or you can right-click the shape, click on Format Shape, and then on the Fill panel, turn the transparency up until the part of the shape beneath it that’s being overlapped has become visible.
Can I add more than three circles in a Venn diagram?
Yes, you can make a Venn diagram with more than three circles. However, it becomes more difficult to create and read as the number of circles increases. Plus, it’s usually recommended that no more than five circles be used in a Venn diagram.
Can I make a Venn diagram without any text?
Yes, you can make a Venn diagram without any text. However, it’s usually recommended that you add at least some text to make the diagram easier to read.
Slideshow? Powerpoint. Venn Diagram? Venngage.
There are many different ways to create a Venn diagram. The easiest way is to use SmartArt in PowerPoint. However, if you’re looking for a more detailed and professional Venn diagram, we suggest using Venngage.
Our infographic maker has a wide variety of templates and tools that make it easy for you to create Venn diagrams however you like. Plus, our team is always available to help you with any questions or problems you may have.


