


You’re trying to create a project timeline in Excel for an upcoming project, but things aren’t going smoothly. Maybe you don’t know where to start, the bars are not aligned, or the tasks are out of order. That’s because Microsoft Excel doesn’t have a built-in timeline feature.
The good news: you can still create a clear project timeline in Excel. In this guide, I’ll show you three ways to do it—using SmartArt, stacked bar charts, and Excel templates. I’ll also cover common formatting issues and share tips to make your timeline presentation-ready.
Bonus: Learn a quicker and easier way to create a project timeline with Venngage’s Free Timeline Maker and free timeline templates.
Prerequisites to creating a project timeline in Excel
Before you start creating the timeline, make sure your data is complete and accurate.
Gather information
Connect with all the project stakeholders and decide the project phases and milestones, such as research, planning, execution, testing, hand-offs, etc. Add these details in a simple table or document before you get started on Excel.
Example milestones for a business plan timeline:
- Project kickoff – 01 Jun
- Requirements finalized – 15 Jun
- Prototype review – 05 Jul
- Beta launch – 20 Aug
- Final release – 30 Sep
Structure data in Excel
Excel requires structured data and accuracy. Here are a few tips to set up your sheet to create a timeline.
- Create three columns: Column A: Task/Phase, Column B: Start Date and Column C: Duration. Place the earliest date at the top and list events in chronological order. Avoid merging cells.

- Use true date values: Type dates as actual date formats and not text, so Excel can sort and chart them accurately. Choose DD-MM-YYYY or any other standard date format and apply it consistently across the sheet.
- Keep descriptions concise: Add one short phrase to describe the task because long sentences will take up a lot of space on charts and can mess up the formatting.
- Add a category column (optional): If you have multiple workstreams, such as design, development and marketing, add a third column for the category. Later, you can color-code milestones by this field for instant clarity.
With this tidy dataset, you’re ready to convert the rows into a visual project timeline in Excel.
According to Microsoft, 81% of businesses use Excel spreadsheets for their day-to-day business operations.
Create a basic timeline
There are three different ways to create a project timeline in Excel: start with a template, insert a bar chart or use SmartArt.
Let’s see each method in detail.
Method 1: Make a project timeline with Excel’s built-in templates
If you want a simple timeline for a small-scale project, Excel’s built-in project timeline templates work great.
Go to the Excel Home page, look for the search bar at the top right side and type Timeline.

You can choose from a variety of project timeline Excel templates based on your project demands.
- Milestone timeline template: If you need to create high-level project roadmaps, milestone infographic templates can be handy. List key dates (kick-off, beta, launch) and keep stakeholders focused on the big picture.
- Gantt chart timeline template: Such templates are Ideal when you need greater control over daily project activities. Gantt chart templates show start and end dates, task lengths and overlaps so you can spot conflicts and adjust resources before they turn into delays.
- Agile sprint tracker template. These templates can be useful if you work in two-week sprints. It combines a burn-down view with milestone markers, giving product owners and developers the same reference point.
Once you select the timeline template, click Create at the bottom of the page and open the template in a new workbook. Customize the timeline by adding your project data.
You can also refer to the Instruction/About tab to learn how to use the template.
Related: How to Create a Timeline in Microsoft Word
Method 2: Create a timeline manually with a bar chart
Using a bar chart gives you a more specific project timeline, but the setup takes more time.
Step 1: Insert a chart
Once you’ve added your project data to the chart:
- Select any empty cell and go to the Excel ribbon (the command bar on the top) and click Insert.
- Move the cursor to the Column menu (the icon representing vertical charts).
- Select a 2-D Stacked Bar chart.
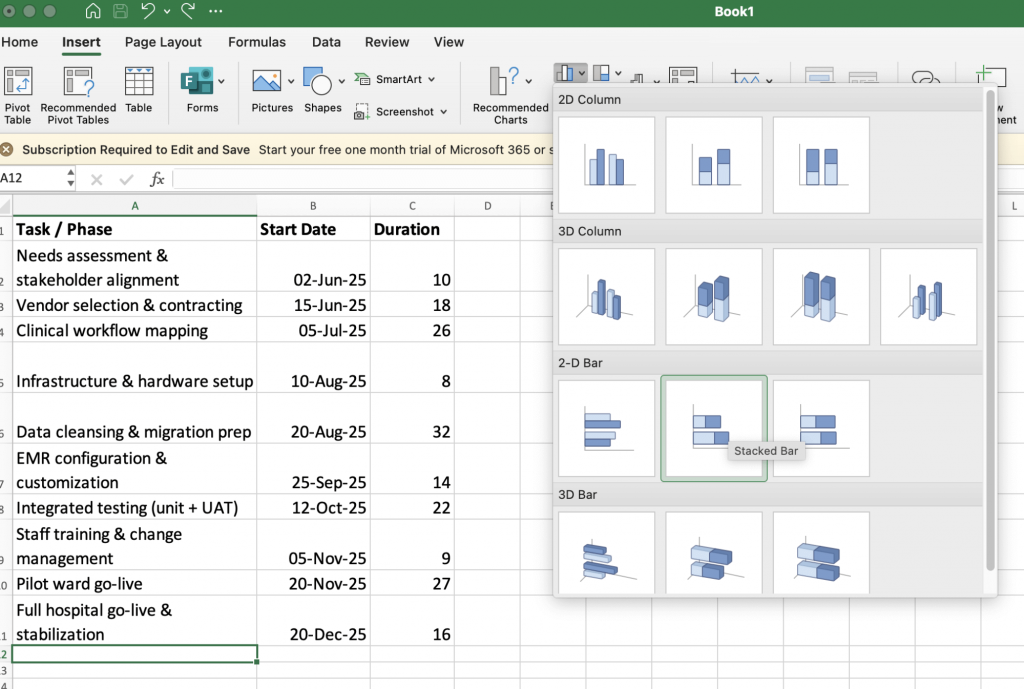
A stacked bar gives you a horizontal layout that’s perfect for a Gantt-style timeline. I will show you how to format it step-by-step, so each bar shows the task’s start date and its duration.
Step 2: Insert start dates to the chart
Once you select the stacked bar, an empty box will appear in the workbook.

Right-click anywhere on the box and click Select Data.

Now, go to the Legend entries (series) box and add + to enter a series. Change the series name to Start Date.

Go to Y values, and click the arrow in the box. Select the cells in the Start Date column by dragging your cursor.

Click OK and the bar chart will appear like this.

Step 3: Insert the duration value to the chart
Next, you need to add the duration value to extend each bar from its start date and convert raw dates into a precise Gantt-style timeline.
It helps compare how long each phase will last, so you can assess scheduling balance and identify potential conflicts or overlaps between different tasks.
To insert duration values:
- Right-click anywhere on the chart and click Select Data.
- Add another series and name it Duration.
- Select the duration cells by dragging your cursor.

Click OK. Here’s what your chart would look like now.

Step 3: Add task names
Now, you have to add task descriptions on the Y axis. Again, click Select Data.
Go to the white box near Horizontal (category) axis labels.

Click OK, and your timeline will be ready.

The tasks will appear in reverse chronological order.
To change it, select the tasks column on the chart and go to Format Axis.

Select Categories in reverse order.

Now, the tasks will appear chronologically, so you know which action item needs to be tackled first. This avoids confusion.
Step 4: Customize the timeline
Once the project timeline in Excel is final, you can customize it by adding visual elements and changing the layout.
1. Change it to Gantt chart-style
Hide the blue bars to get a proper Gantt chart-style project timeline.
- Click the blue bars and go to the Color Fill icon in the ribbon.
- Select No Fill.

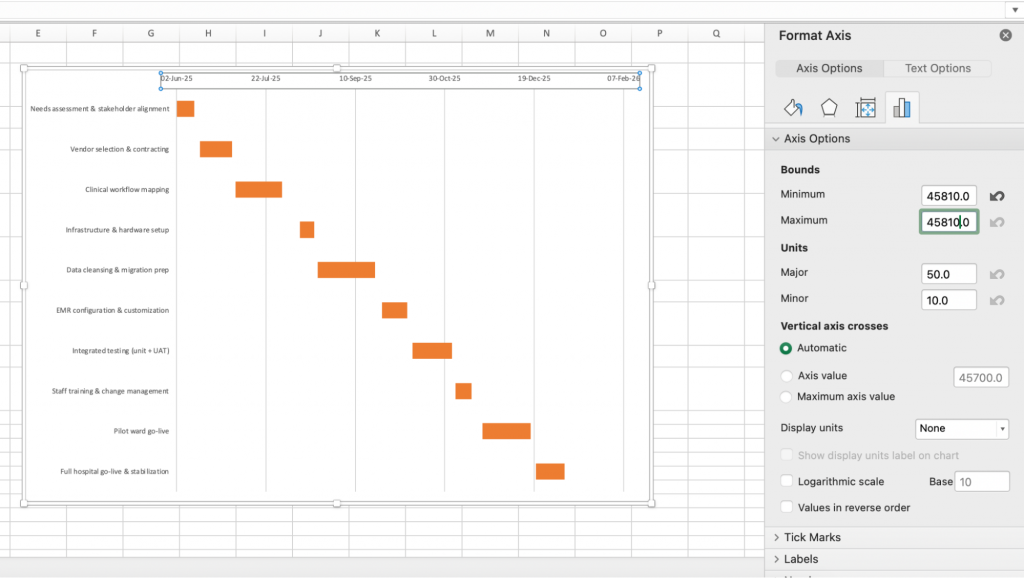
- Right-click the second cell in the Start Date column and select Format Cell.
- Go to General and note the number. For me it’s showing 45810.
- Select the date bar on the top of the chart and go to Format Axis.

- Add the General number you noted in the Minimum and Maximum fields.
- Click OK and you’ll get a Gantt chart-style timeline.
To reduce the gap between the horizontal bars, right-click and go to Format Data Series. Increase the gap width to make your timeline look more polished.

2. Add chart elements
If you want to further customize the chart, Excel offers chart elements. Go to Chart Design and select Add Chart Element.
It offers various options, such as adding chart titles, axis labels, error bars, gridlines, etc.

According to Wellingtone’s State of Project Management Report, 48% of project management professionals baseline their project schedules to measure progress or adjust project timelines.
Method 3: Use Excel’s SmartArt tool to create a project timeline
If you want a simple, quick method to create a timeline, you can even use the SmartArt tool in Excel.
Click Insert > SmartArt > Process.
Choose the Basic Timeline illustration.

Add text to the left box. Click the + sign to add more tasks based on your project schedule.

If you want to change the timeline design, go to SmartArt Design and try different layouts and colors.

However, this method just lists tasks in equal intervals. It doesn’t show the duration or start date or end date of each task, making it difficult to track the project timeline.
Related: How to Make a Timeline in PowerPoint
Export the project timeline
Once your timeline is finalized, export it and share it with the stakeholders. Here’s how you can do it:
- Save as PDF: File > Save As > PDF. This helps lock the layout and fonts on any device. You can share the PDF with other team members and clients so everyone is aware of the timeline.
- Save as image: Right-click the chart > Save as Picture > PNG or JPEG. This format works best for slides, chats, or email. You can share it during project kickoffs.
- Keep as XLSX: File > Save As > Excel Workbook. Use this format when collaborators need to tweak dates or add comments.
Tips and best practices to create a timeline in Excel
Here are a few tips to keep in mind while making a project timeline in Excel.
- Apply distinct, accessible colors: Use a neutral tone for the hidden offset series and a single brand color for task bars. If you need categories, vary hues but keep sufficient contrast for accessibility.
- Label selectively: Show task names beside longer bars; for short tasks, data labels can clutter the view. Hide unnecessary gridlines and legend entries to keep the timeline clean.
- Use conditional formatting for status: Add a Status column (e.g., Not Started, In Progress, Complete) and apply conditional colors or icon sets to the data table. Viewers can scan progress without extra charts.
- Create a refresh routine: Schedule a quick check—weekly works for most teams—to update dates, confirm formulas, and review axis limits. Consistent maintenance keeps the timeline trustworthy.
- Save a template version: When the timeline layout is final, store a blank copy with only formulas and formatting. Starting from this template shortens setup time on the next project and maintains style consistency.
According to the State of Project Management Report 2025, 14% of project management professionals still use Microsoft Excel for project planning.
Limitations of creating a project timeline in Excel
I am not a fan of Excel. Even though there are multiple options to create a timeline, none of them work effectively. You either need to spend a lot of time adding and formatting the data, or you get a simple timeline with limited project information.
Here are some of the common challenges of creating timelines in Excel:
- Chart type workarounds: Excel does not have a native Gantt view, so you have to repurpose stacked-bar or scatter charts and tweak settings to imitate one.
- Axis scaling headaches: Very short or very long tasks distort the timeline unless you lock the time axis minimum, maximum, and major units.
- Label misalignment: Task names often overlap or drift when bars sit close together, requiring manual nudging or increased row height.
- Styling constraints: Adjusting bar width, colors, and gridlines takes far more clicks than in purpose-built timeline tools.
- Error ripple effect: A single typo in a date or duration cascades through offset formulas and shifts every bar on the chart.
- Maintenance burden: Any schedule change means recalculating offsets, refreshing the chart, and sometimes resetting axis limits.
- SmartArt limitations: SmartArt timelines fix milestones at equal spacing, so real date gaps are misrepresented and long projects require multiple graphics.
- Collaboration friction: When several people edit the sheet, formulas and formatting are easily overwritten, leading to version conflicts.
- Limited progress tracking: Displaying percent-complete bars or status shading demands extra columns and conditional rules, adding complexity to the file.
Related: How to Make a Timeline in Google Docs
Top Excel alternatives for project timelines
Managing projects can be stressful as it is; you don’t need the extra burden of creating a perfect project timeline from scratch.
Simple designing solutions like Venngage make the process so much easier. Venngage offers a variety of tools to help you create a project timeline in just a few simple steps.
Venngage’s Free Timeline Maker
I don’t like spending time tweaking data and labels in bar charts, so I use Venngage’s Free Timeline Maker instead. It offers a wide range of customizable templates, letting me build polished timelines in minutes.
Here’s a simple project timeline template you can use:

With this template, you can:
- Edit the text to add relevant steps included in your project.
- Change weeks to actual dates.
- Add detailed pointers for each task/phase based on project requirements.
- Adjust the length of each horizontal bar to adjust the duration of your tasks.
The best part is that Venngage offers easy customization of the project timeline — simply add your brand logo and color palette using the My Brand Kit feature. Need feedback from stakeholders? Share the timeline link with them in just a few clicks and adjust it easily.

Venngage’s AI Timeline Generator
If you want to further simplify the process of creating timelines, Venngage’s AI Timeline Generator has you covered. Just add a detailed prompt including the project details and type of timeline (infographic, comparison, etc.) and you’ll get a sample timeline in seconds.
Here’s an example of how it works.

Venngage’s Free Gantt Chart Maker
If you prefer Gantt chart-style templates, try Venngage’s Free Gantt Chart Maker. Explore the project timelines templates and customize them as per your requirements.

Create project timelines with Venngage
You have three main ways to build a project timeline in Excel: templates, stacked-bar (Gantt) charts, and SmartArt. Reach for a template when you want plenty of room for detailed task notes, switch to a stacked-bar if you need full control over colors and spacing, and settle on SmartArt when a simple phase-by-phase snapshot is enough.
The catch is time. Entering dates, sizing bars, and nudging labels in Excel can feel like its own mini-project. If you’d rather spend those minutes elsewhere, try Venngage’s free Timeline Maker — drop in your data, choose a layout, and export a polished timeline in just a few clicks.
FAQs for creating a project timeline in Excel
1. What’s the easiest way to make a timeline in Excel?
The quickest option is SmartArt. For a more detailed timeline with durations and dependencies, use a stacked bar chart. If you’re short on time, start with a free Excel template.
2. Why are my bars not aligned in Excel?
This usually happens when your dates aren’t in the correct format. Make sure your start dates are recognized as actual dates in Excel (not text), and set your axis minimum/maximum to match your project range.
3. How do I fix tasks showing in reverse order?
Right-click on the vertical axis, select Format Axis, and check “Categories in reverse order.” This flips the task list so it flows top-down.
4. Can I export an Excel timeline for a presentation?
Yes. You can copy the chart into PowerPoint or Word, or save it directly as a PDF or image. Keep in mind that formatting sometimes shifts when you export.
5. What are the limitations of using Excel for timelines?
Excel timelines can take time to set up, are difficult to update for large projects, and lack design flexibility. They’re fine for small projects but clunky for ongoing collaboration.


