


Do you want to learn how to reference infographics in APA, MLA or Chicago citation styles? When you’re creating research-based infographics, it’s important to cite your sources. Citations establish transparency and build credibility.
In this blog, we’ll show you how to cite an infographic in APA, MLA and Chicago styles. Once you’re through, you can use Venngage to choose from over 10,000 infographic templates, create infographics and add citations to your design.
How to cite an infographic
Infographics are often reused in blogs, reports and marketing content—whether as a guestographic or across different types of infographics for campaigns, research or education. Proper citation helps build credibility and shows where your information came from.
For academic writing, business reports or formal publications, a citation usually includes:
- Infographic title
- Creator or publisher
- Date published
- Date accessed (if required)
- URL or source link
The exact format depends on the citation style you’re using, but these details cover the essentials.
How to cite an infographic in APA
American Psychological Association (APA) guidelines are widely used in academic writing, especially in social and behavioral sciences research.
The APA outlines a simple list for referencing an infographic or any other source in your work:
- Author
- Publication date
- Title [infographic]
- Source website name
- URL
In APA style, you should italicize the titles of standalone works and periodicals. APA style doesn’t have specific guidance for infographics. For example, you don’t need a placeholder in your citation if your data source doesn’t list an author. However, APA requires a placeholder for publication dates.

This infographic would appear in an APA bibliography like this because there’s no author or publication date listed:
(n.d.) How To Clean & Disinfect Your Home [infographic]. Venngage.com. https://venngage.com/templates/infographics/how-to-clean-and-disinfect-your-home-infographic-0cafe393-0830-4394-a58a-ca5f77f48376
In-text infographic citations in APA style usually use narrative citations. This makes the information flow more naturally and is easier to read, especially when author names or dates are missing.
How to cite an infographic in MLA
The Modern Language Association (MLA) Handbook is the gold standard for citations in academic writing, literature and research. The correct order of information for an MLA citation is:
- Author
- Title of source
- Title of container
- Other contributors
- Version
- Number
- Publisher
- Publication date
- Location
It may seem like a lot more than we’ve covered so far. And it is. Other citation guides don’t require you to include this much information.
Here’s the basic structure for citing an infographic, according to the MLA:
Last Name, First Name. “Infographic Title.” Company Name. Publication Date. URL.
MLA also requires you put the infographic title in quotation marks. Italicize the name if the company is a publication.
But what about when you don’t have an author or a publication date, like in this example?

You can skip those and your citation will look like this:
“Flexible Work From Home Jobs.” Venngage. https://venngage.com/templates/infographics/work-from-home-jobs-infographic-9fb8fe52-b10d-4266-a0a3-f776d21b6998
MLA advises against using placeholders for missing information, like the author or date. However, your academic or corporate style might prefer including the date you accessed the infographic.
In-text citations for infographics in MLA are tricky because most infographics don’t include an author. But if you’re using a company as the author or one is named, your text could look something like this:
“Some of the best work-from-home options include online data entry, transcription and virtual call centers (Venngage).”
How to cite an infographic in Chicago style
The Chicago Manual of Style is widely used in publishing, particularly by history researchers. It also serves as the basis for the style used by many companies, including Apple.
Here’s the basic structure of an infographic citation in Chicago style:
- Author
- Title
- Date of publication
- URL
Let’s take this infographic as an example:

In this example, we’d consider Maplewood Clinic as the author based on the logo in the top right. However, it’s also valid to view this infographic as having no author.
Maplewood Clinic. “Key Risk Documentation Principles.” (n.d.) https://venngage.com/templates/infographics/key-medical-risk-principles-decision-table-9c35611c-0090-4249-bf6d-b34aea6f3cde
In Chicago style, in-text citations for infographics typically describe the infographic and the information being referenced. Using our previous example, that could look like this:
Maplewood Clinic’s infographic established four levels of risk …
How to cite sources on an infographic
There’s no single way to cite sources for your infographic. In the next section, we’ll look at how different style guides suggest citing infographics. These methods should also apply to citing sources within your infographic, but the advice may vary depending on the guide.
By norm, include a URL for specific information, especially statistics or online data. Place the URL at the bottom of your infographic in the “Source” section.

In some cases, like the one above, the information comes from a single source. Longer, more complex infographics typically include more than one source, like the one below.

How do you do in-text citations on an infographic?
It’s common to list all sources at the bottom of an infographic or below a chart. However, in some cases, you may want to reference the source directly in the text.
This could be because the information is novel or you want to make it easy for readers to find the source right away. It’s like telling them, “Don’t take it from me, take it from this expert.”
Let’s take a look at this infographic:

As this segment of the infographic shows, in-text citations can be very simple. In this case, the infographic doesn’t include a URL because the advice comes directly from CDC, a well-known public health agency.

Use your judgment on how to reference the source with in-text citations. If your audience knows who the organization or individual is, you don’t need to explain much.
It’s a good idea to do both, depending on the topic. This infographic references the organization who published the report right in the introduction, while it lists the full URL address at the bottom.
This does a couple of things: One, it ensures the infographic conforms to accepted standards. Two, it ensures that even skimmers of the data will have a couple of places to see the source.
How to cite images in infographics?
If your infographic includes images, icons, charts or data you didn’t create yourself, they need to be credited just like written sources. Citing images builds credibility, respects the original creator’s work, and helps your audience trust where your information came from.
The exact format varies depending on the citation style you’re using (APA, MLA, Chicago, etc.), but a good image citation usually includes:
- Creator or organization name
- Title or brief description of the image
- Source or website name
- Link to the original image
- Publication year or date accessed (if available)
For print infographics, place image credits in a small footer, caption, or “Sources” section. For digital infographics, include a clickable link to the original source when possible.
If you modify an image (crop, recolor or add labels), make that clear by writing “Adapted from” or “Modified from” before the citation.
Example (APA-style image credit):
Image adapted from Smith, J. (2022). Climate Change Trends. National Weather Archive. URL
Don’t forget about icons and illustrations. Sites like Flaticon and The Noun Project expect attribution unless you’ve purchased a license so always check the usage rules before publishing.
When in doubt, credit the source. A short citation is always better than none.
Do infographics need citations?
If you researched well for your infographic, you likely used many sources. Listing them is part of making a good infographic.
Related: How to Make an Infographic in Under 1 Hour
In most cases, your infographics should have at least one link or reference to the source of your information, data, facts or other analysis. The only exception is when your infographics rely solely on internal data. That could include:
- Survey data
- User metrics
- Company history
- Processes and procedures
You don’t need to cite common knowledge. But if you use research-backed data or facts, always cite the source.
This infographic, for example, includes information that many people already know. But by citing original sources, it makes the information a lot more trustworthy.

In this single-sourced example, the resource — Merriam-Webster — is the final word on, well, words. Merriam-Webster is such a trusted source that one of its two names is the generic definition of a dictionary (Webster’s).

Citing sources also strengthens your infographic and conclusions, making it harder for people to challenge your interpretation. This is particularly important when you’re sharing groundbreaking or potentially controversial findings in your infographics.
The infographic below covers racial inequity in America — a sensitive topic. It lists sources below each chart so that readers can verify the information.

Some infographics may use internal research to explain certain topics. For example, this “Game of Thrones” infographic cites the show as the data source. And the introduction explains the data methodology.

If you’re relying on internal sources, make sure to reference the methodology too. You can link to the survey data to keep your methodology transparent.

Related: 5 Steps to Present Your Research in an Infographic
What’s the best way to keep track of infographic sources?
Keeping track of every source during the research phase can be challenging, especially if you’re yet to shape it into a meaningful narrative. At this point, you might not have decided which statistics or facts to use yet. But you also want to keep the information handy.
Some infographic makers do their research all at once and keep their browser tabs open to copy-paste the URLs as they cite sources in the infographic. But this is risky since you can jumble or miss those sources during the drafting process.
Here’s a better option to track your infographic sources:
- Create a rough infographic outline in Google Drive or Microsoft Word.
- Search for studies, statistics, data, articles — any content that relates to the topic. This will help support or challenge what you think the infographic will be about. Add sources at the bottom of your infographic. Bad infographics contain low-quality data that’s often from non-reputable sources — make sure yours isn’t one of them.
- If you find a statistic interesting or relevant, copy and paste it into your outline document. Paste the URL where you found the statistic directly underneath. Also, add any details you might to locate the original data. If the data is in a PDF, list the page number or table so that you can spot it easily.
- Repeat. Run the process outlined above repetitively until you’ve enough data to tell a complete, engaging and informative story through the infographic.
- You’re now ready to write the content that will appear in my infographic. If you don’t want to use a particular data point, delete it to avoid confusion.
- By the end of this process, you’ll be left with a list of URLs, which you will place in the infographic’s footer.
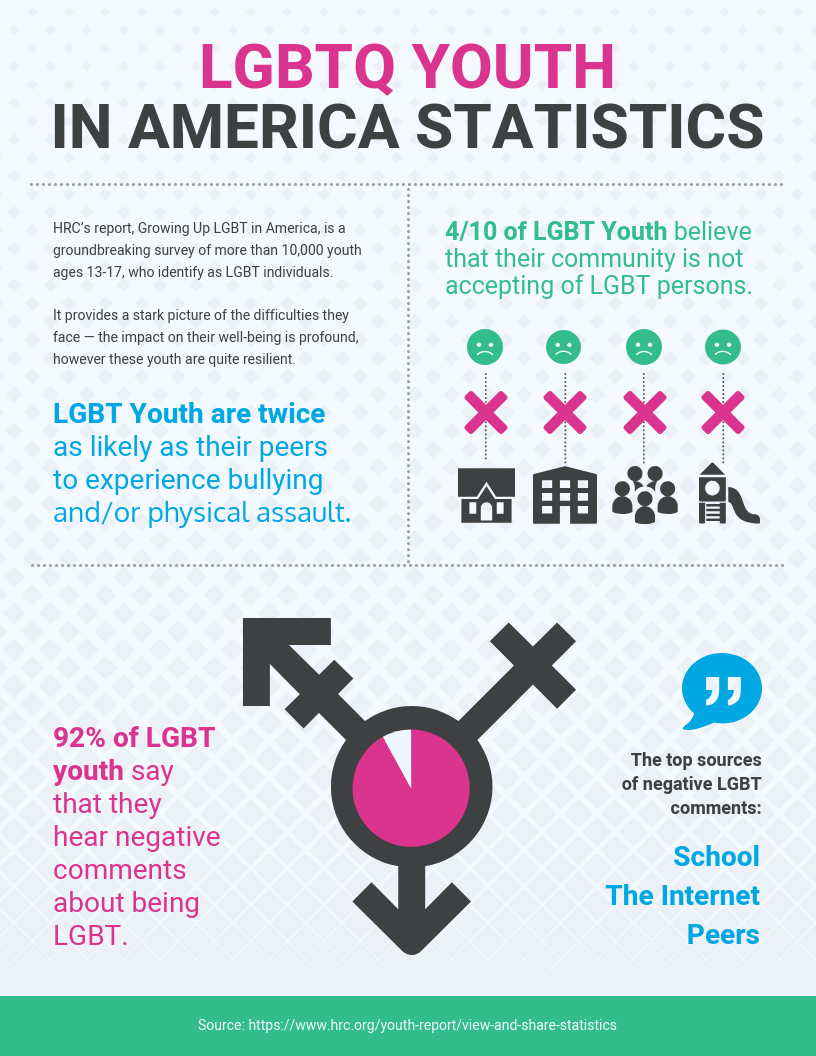
This process doesn’t apply if you’re collecting data from a single source, like the infographic below. However, the citation method remains the same: List the full URL where you got the information in a section or line labeled “Source.”

This example also includes a link to the infographic’s sponsor, offering a subtle way to add branding. Another good example of that is the one below about preventing COVID-19 spread.

Citing infographics matters
Proper sourcing in infographics is key to establishing trust. Infographics are becoming more popular, so they will remain a key resource for reliable information. This means you should be as transparent as possible about your sources.
Once you’ve had all your sources noted and ready, you can start creating your own infographic with Venngage’s infographic maker. It’s free to get started.


