


When it comes to making infographics, there are lots of software options to choose from. Many people want to use software they already have readily on hand or are already familiar with, and so PowerPoint is a common choice. However, infographics are unique products that need a careful review of all of the options.
To save you time, here are my recommendations for making better infographics for PowerPoint. As a professional information designer, I can help you better understand what to look for so if you aren’t a designer yourself you can still make infographics that engage and inspire.
New to infographics? This video walks you how to create the perfect infographic, without any design know-how.
Click to jump ahead:
- Why not PowerPoint for infographics
- How to create better infographics for PowerPoint
- PowerPoint infographic templates
PowerPoint is not meant to be used to create infographics
It’s true that PowerPoint remains the default software to create presentation slide decks. This is despite that fact that it has also received a lot of criticism, clearly demonstrated by the well-known phrase “death by PowerPoint.”
Some try to solve this perennial problem by looking for attractive templates they can simply edit in PowerPoint. This can take time as many existing templates are fairly boring and emphasize the “bullet point” approach to design.
Still, beautiful templates are not a complete solution. Whether you are creating a slide deck or a stand-alone infographic, the best designs include both engaging visuals and smart data visualizations. When it comes to meeting these needs, especially for non-designers, PowerPoint simply falls short.
In part because PowerPoint is a standard, they are not known for their innovation. It’s not intuitive to use. In fact, this is often why people hire professional designers, as it would take too much time to learn to get good at using it and create an ideal template from scratch.
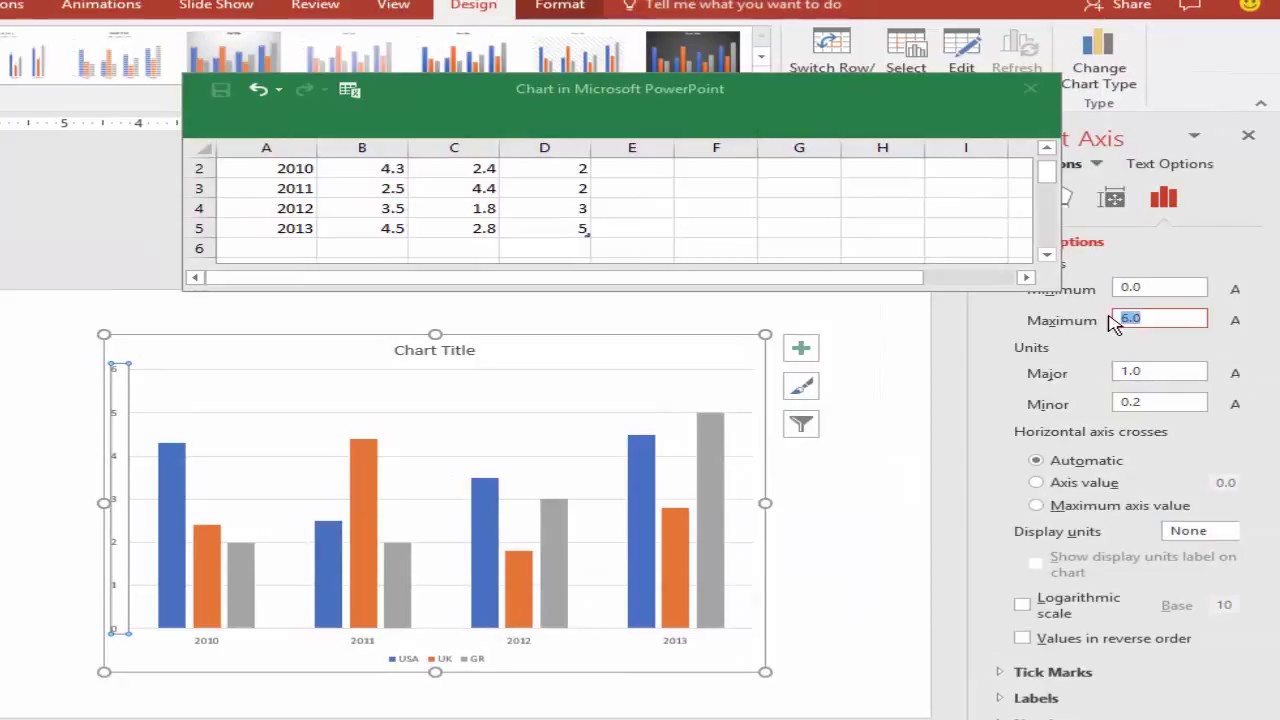
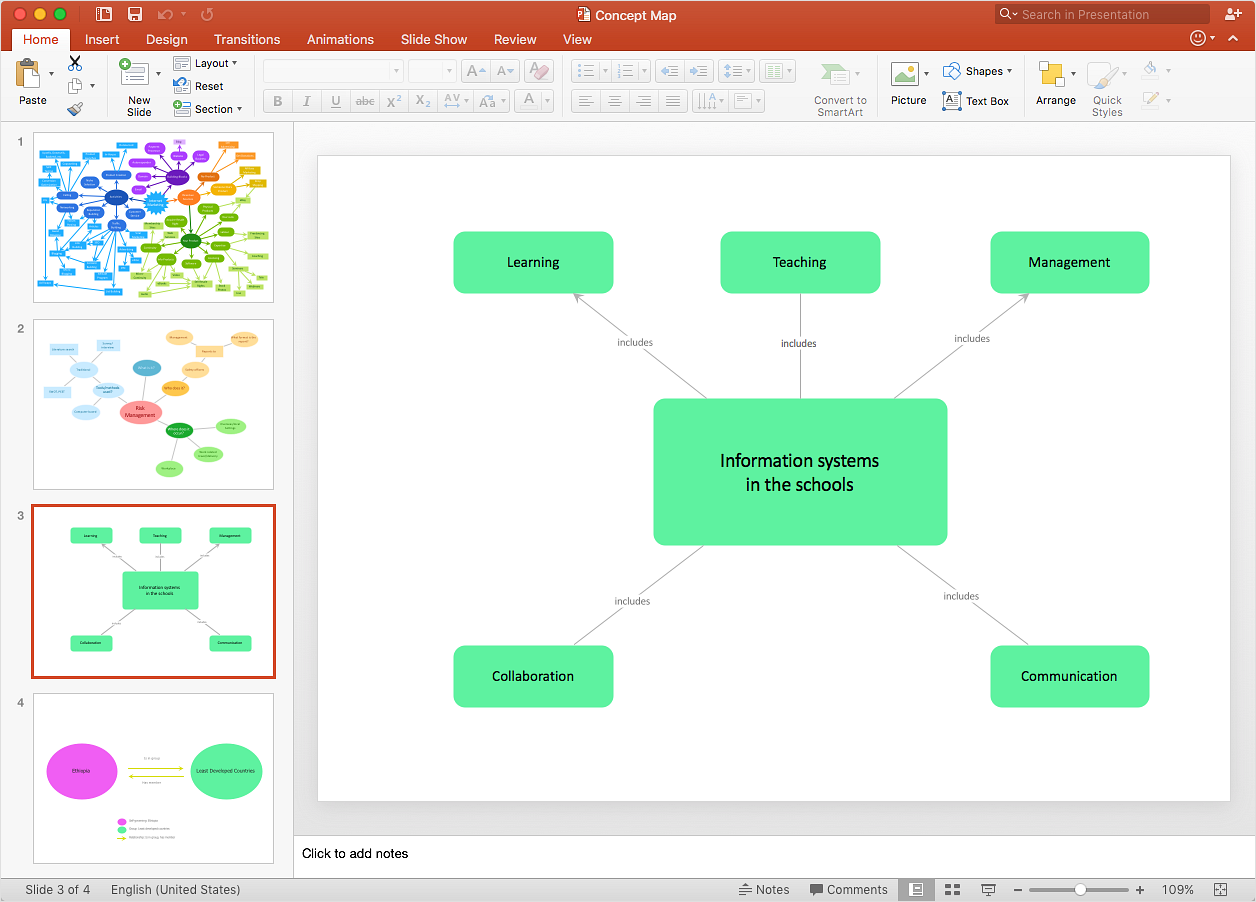
This is especially the case when it comes to infographics because they include visuals like diagrams, graphs, and charts. Using PowerPoint to create these visuals in a way that works well for the audience requires a lot of extra editing, in part because the default settings often lead to poor design. Someone might be able to get away with using these defaults if they were producing a white paper, but not for infographics. If you want to create a one-page infographic or long-form web-based infographic, PowerPoint creates more problems than it helps solve.
At the end of the day, PowerPoint was made for non-designers to create presentations, so if that is your ultimate goal, you might still want to use it in your workflow. The best approach is to create infographics using a different software option, and then import those graphics into your PowerPoint slide deck if you want them to be part of a presentation.
Want to try another tool? Check out our guide on how to create an infographic in Google Slides for an easy, flexible way to design engaging visuals.
Creating infographics you can use in PowerPoint presentations
Keeping in mind why PowerPoint is not useful for creating infographics, you will need to use software that meets the needs already discussed:
- Infographic templates that help your designs stand out and impress others
- Easy to use and/or easy to learn to use (and therefore less time consuming)
- Great for creating attractive and accurate diagrams, charts, and graphs
- Ability to export designs as PPT so you can import them into PowerPoint presentations
Sure, there are a variety of options you might consider, such as Canva, Adobe Illustrator, or Tableau. But meeting all of the above needs can be a bit of a tall order.
Related: Top 8 Canva Alternatives for Infographics
Venngage stands out among the competition. It explicitly seeks to help non-designers easily create beautiful infographics. We are known for our professional templates, powerful features, and useful content that supports your learning.
In addition to meeting the needs above, Venngage features include:
- Many types of ready-to-use infographic templates including for processes, timelines, and statistics, from beginner-friendly to more advanced. Many are free to use.
- Several types of charts and maps from across the world you can include, for which it’s easy to edit both the data and the design

- Support, including with improving your skills
- Download designs in PNG, PDF or PPT (paid plans only)
- One-click branding with My Brand Kit (paid plans only)
- Ability to share and collaborate with your team on designs (paid plans only)
If you are creating a presentation, you can even use one of our many presentation templates with infographics already embedded in them, and then export your designs in PPT format.
You can even continue to edit your Venngage designs within PowerPoint, as the visual below describes.

Here’s an example of one of the many presentation templates you can choose from:

If you want to create infographics that are innovative and wow your audience, don’t settle for PowerPoint. You can easily get started with Venngage – sign up is free.
PowerPoint infographic templates
Here are some examples of infographic templates you can customize in Venngage and then export to PPT.
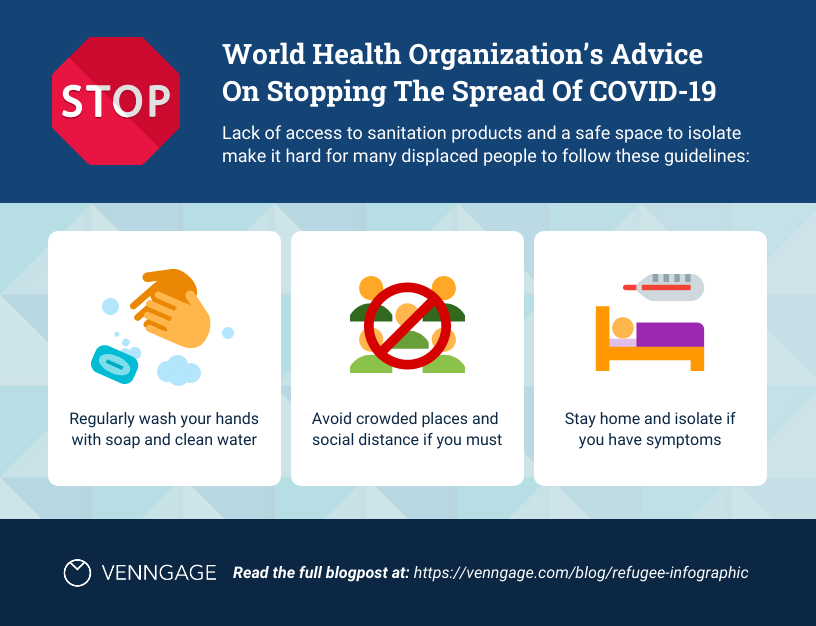
The major rule of thumb for slide design is to keep it simple, so a short and sweet infographic like this one could probably act as an individual slide.
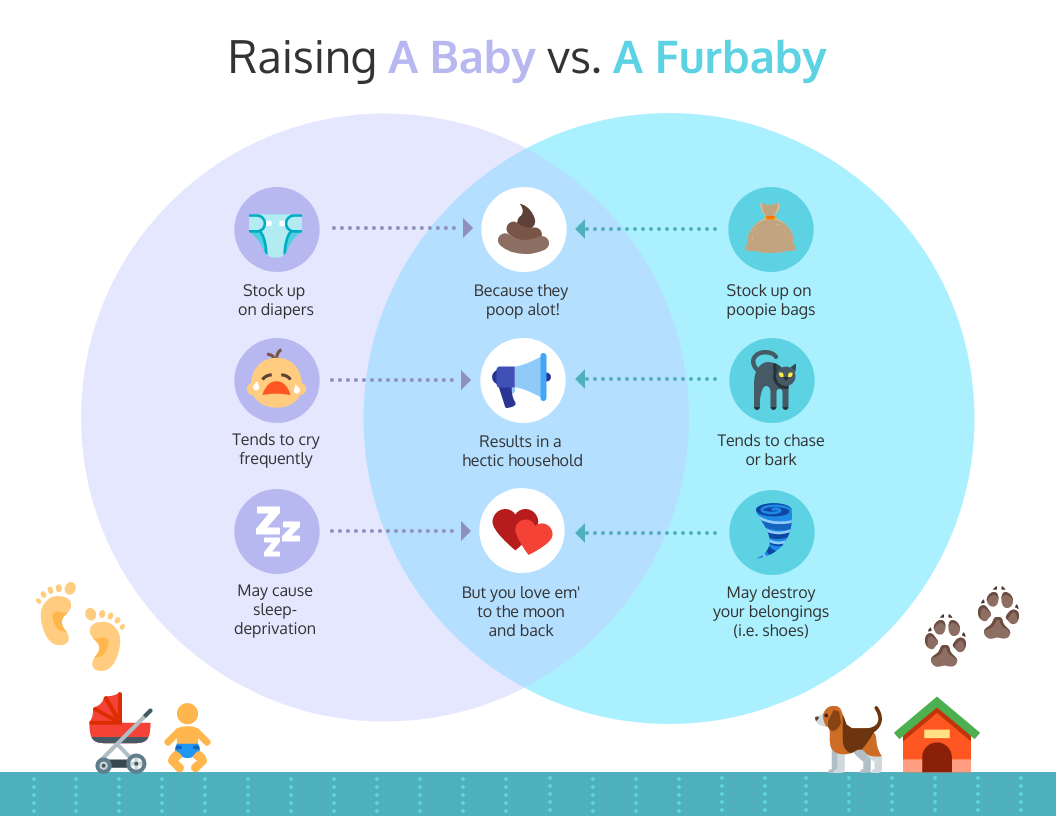
If there’s a bit more content, like this one, make sure to keep the text brief and the ideas straightforward. Again, you want your viewer to be able to get only a few major takeaways at a pretty quick glance.
If you are wanting to describe something with many parts, you can use a “big picture” visual like this one and then break down each of the parts into more detail on subsequent slides.

Remember, you want to be careful with how much text you include. If you make an infographic like this one, you will need to download it into PPT format, then when you bring it into PowerPoint, you can separate the steps outlined onto separate slides.

Don’t settle for PowerPoint. You can easily get started with Venngage – sign up is free.


