


Creating a genogram in Microsoft Word is possible, but it takes more than dropping a few shapes onto a page. You have to build the family structure manually, connect relationships correctly and keep everything aligned as the diagram grows.
In this guide, I’ll show you how to create a genogram in Word using Shapes and Connectors, including how to add standard genogram symbols, organize multiple generations and export the finished diagram.
I’ll also cover limitations of Word and how design tools like Venngage can help you create a genogram faster using AI and ready-to-edit genogram templates.
What information do you need to create a genogram in Word?
Before you start building your genogram, set up a Word document and keep the family information ready.
- Download the desktop version of Microsoft Word: The Word app for Microsoft 365, Word 2019, 2021 and 2024 give you access to Shapes, Connectors, alignment and grouping tools. Word Online has more limited diagramming controls.
- Use a mouse or trackpad: You’ll be dragging shapes, aligning family members and adjusting connector lines, so precise cursor control makes the process much easier.
- Decide how many generations you want to include: This helps you estimate how much horizontal and vertical space you’ll need before you start adding family members.
- Gather the family information you want to showL Depending on the purpose of your genogram, this may include:
- Full names
- Dates of birth
- Dates of death, if applicable
- Marriage or partnership dates
- Divorce or separation dates
- Parent-child relationships
- Medical conditions, major life events or other relevant family information
- Family history
- Know the basic genogram symbols: Genograms use different symbols and line styles to show people, family connections and the nature of relationships. Here are some common ones you must know.
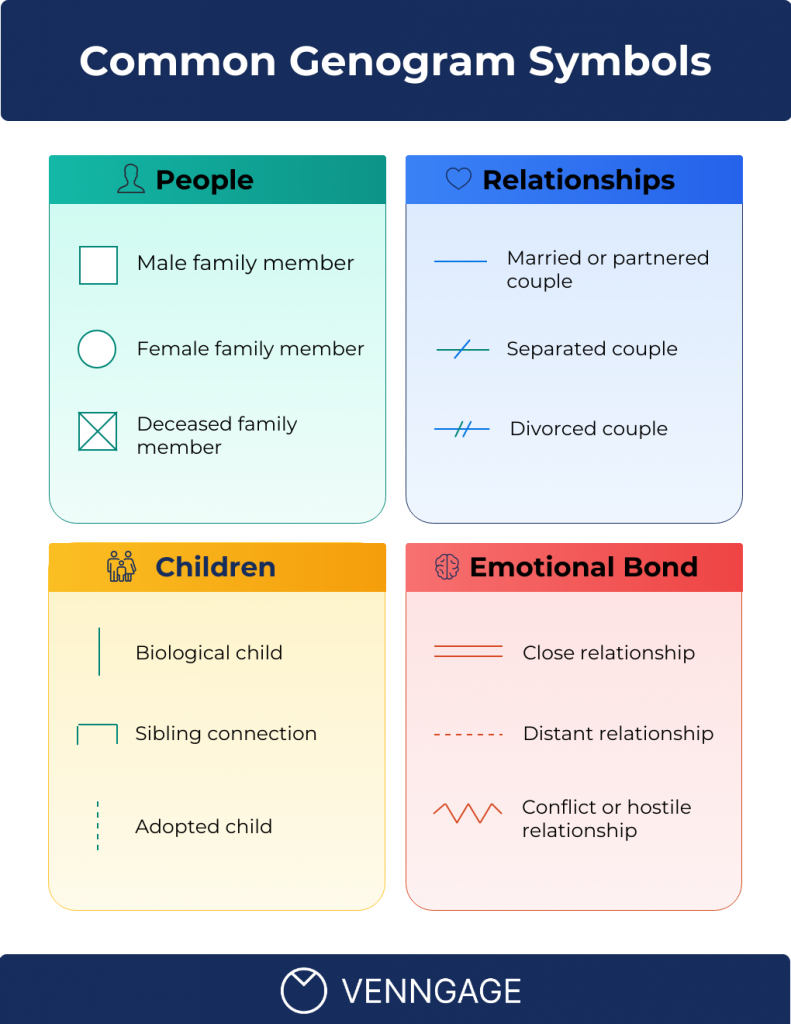
You don’t need to add every possible detail in the genogram. Start with the information that matters for the purpose of your diagram, then plan the layout around it.
How to create a genogram in Word?
You can create a genogram in Word in three ways: using Shapes and Connectors, adapting a SmartArt hierarchy or drawing the diagram manually with the Draw tools. For most genograms, Shapes and Connectors are the most flexible option because they let you control individual symbols, relationships and spacing.
Method 1: Create a genogram with Shapes and Connectors
Start by setting up the page, add and label each family member, connect them using standard genogram symbols and then align the diagram by generation. Once finished, you can group the elements and save or export the genogram as a PDF.
Step 1: Set up your Word document for diagramming
First, switch the page to landscape orientation so you have more horizontal space for multiple generations. Go to Layout → Orientation → Landscape.
Next, reduce the margins to give the genogram more room across the page. Go to Layout → Margins → Narrow.
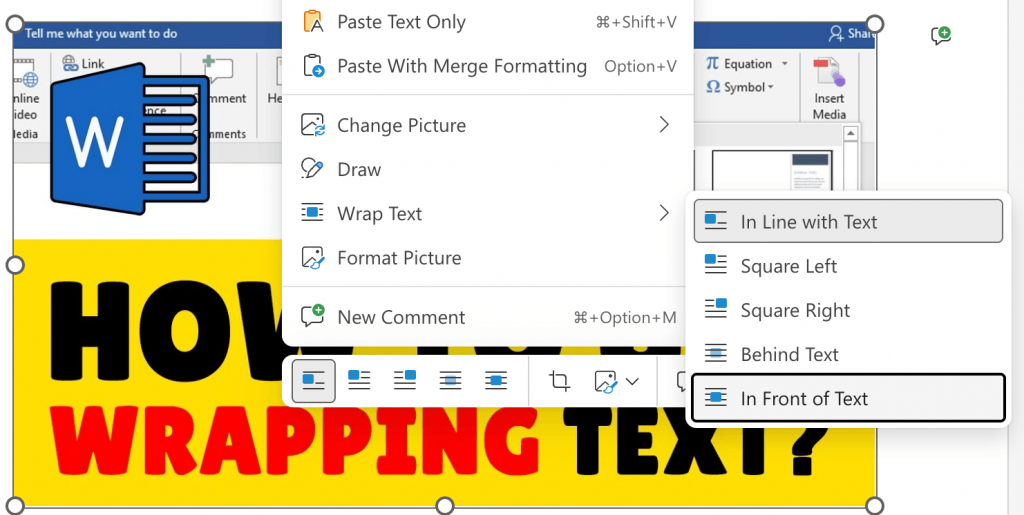
As you start adding shapes, set them to In Front of Text so you can move family members and relationship lines freely without Word repositioning them around the text. Right-click the shape, then select Wrap Text → In Front of Text.
Step 2: Add shapes for genogram symbols
Now add the family members in Word.
Go to Insert → Shapes and choose a square or rectangle for a male family member and an oval for a female family member.
Draw the first shape, then keep the size consistent as you duplicate it for the rest of the family. For a three-generation genogram, around 1–1.2 inches wide and tall is a reasonable starting point.
Add the oldest generation first, then work downward so the family structure is easier to organize.
Once all the family members are in place, you can start connecting marriages, children and other relationships in the next step.
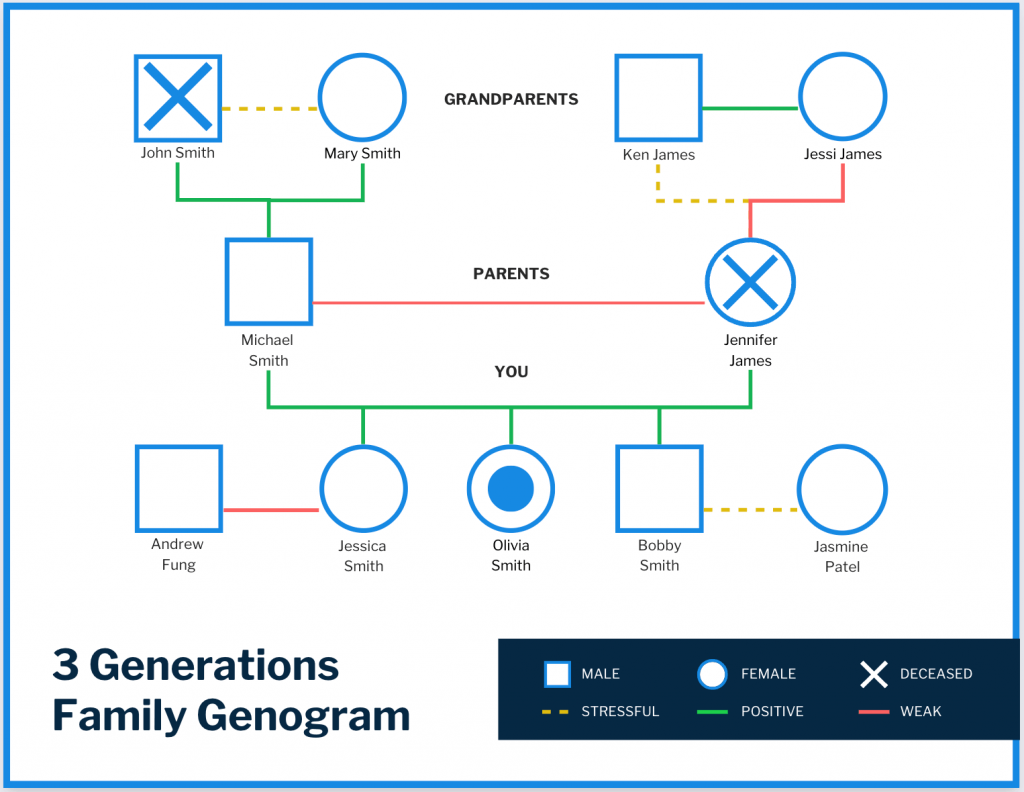
Here’s an example of a three-generation genogram template from Venngage that demonstrates this clearly:
Don’t guess the size of each shape as you draw. Set one size and keep everything consistent so every block is equal.
Right-click the shape → Wrap Text → In Front of Text
Like we discussed earlier, this setup prevents shapes and layouts from jumping around unnecessarily.
Next, add the name:
Option A: Type directly inside the shape. This works best when you have short labels.
Option B:Insert → Text BoxSet it to No Fill and No Outline and place it under the shape.
You can use this option if you want tighter spacing or multiple lines.
Once the shape and label are final, select both → Right-click → Group
Grouping keeps the name and symbol locked together, so they move and align as a single unit while you build the rest of the diagram.
Instead of redrawing shapes every time, treat your first symbols as a small library you can reuse across the diagram.
Pro Tip: If you’d rather not build a symbol library from scratch, Venngage offers a large icon library with thousands of icons that go far beyond basic genogram symbols. Read more about using icons to improve your visual storytelling.
Step 3: Build the top generation row
Start with grandparents or the oldest generation. Place shapes roughly in position first. Then select them all → Shape Format → Align → Align Top
Now space them evenly: Align → Distribute Horizontally
This is where most genograms go wrong. Uneven spacing looks rushed and unprofessional.
Build one generation at a time and fix the alignment before moving down.
Step 4: Add couple relationships
Go to Insert → Shapes → Lines → Connector (Straight)
Connectors snap to shapes and stay attached when you move or realign the symbols, whereas plain lines often drift out of place and need constant readjustment.
For instance, if you hover over a shape, you’ll see small connection points appear. Click directly on those points. When connected properly, the line sticks even if you move the shape.
Next, draw a horizontal line between partners.
For separation:
- Add one small diagonal line across the partner line.
For divorce:
- Add two diagonal slashes.
Keep slashes thin and centered.
Edge case: remarriage
Create a separate partner line. Leave visual breathing room between relationships. Do not stack lines tightly. Clarity beats compression.
Step 5: Add children and siblings
Follow this exact pattern:
- From the couple line, drop a vertical connector down.
- Draw a horizontal sibling line.
- Drop vertical connectors to each child shape.
This creates clean branching. Now select all child shapes → Align Top
Then Distribute Horizontally
Once again, don’t rely on your eyes to give space between sibling symbols.
Step 6: Add notes or markers without clutter
In genograms, “Dx” is shorthand for “diagnosis.”
It’s commonly used in medical, psychology and social work genograms to label a health health conditions associated with a person in the family.
It’s best to keep these labels short. For example:
- Dx: Diabetes
- b. 1972
- “Adopted”
Explain all codes in your legend. Avoid long medical paragraphs inside shapes.
Take a look at this medical genogram, which uses color-coding to clearly show diagnoses and health conditions across family members:
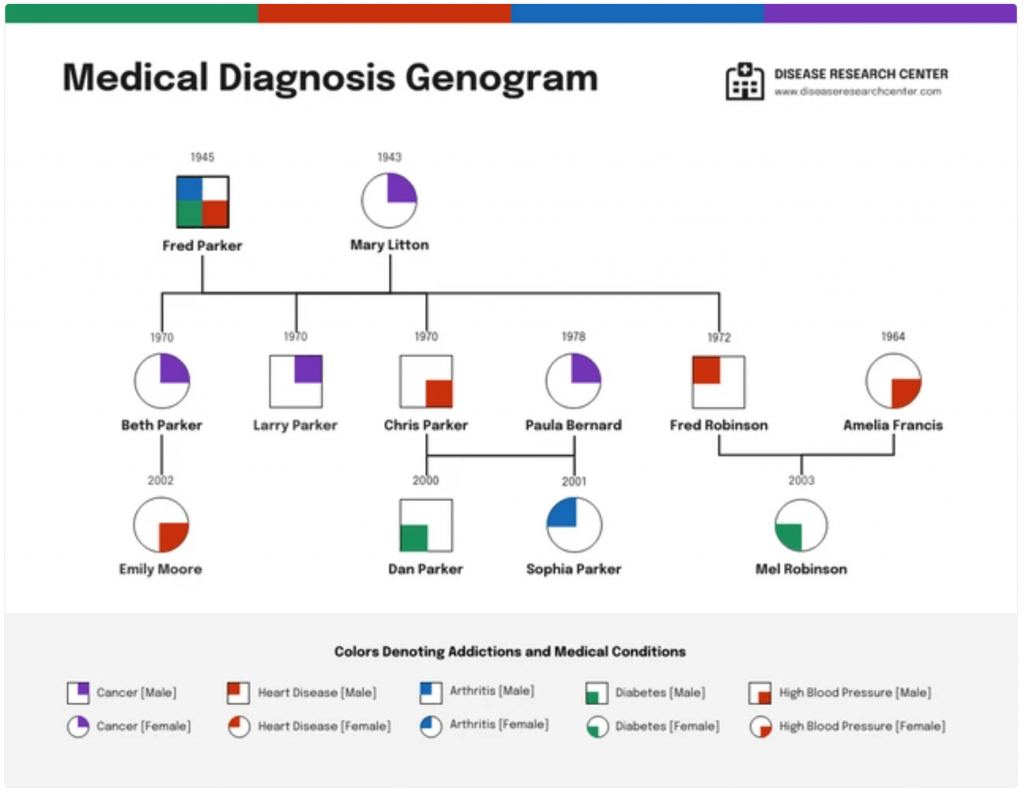
You can color a label if you have a clear reason for it, but most genograms are traditionally printed in greyscale. Dark outlines with a 1–1.5 pt line weight tend to print the cleanest.
Keep sensitive information minimal, especially if this uses real family data.
Step 7: Make it look professional
Standardize everything:
- Line weight: 1–1.5 pt
- Same outline color across all shapes
- Even vertical spacing between generations
Select a couple → Align → Align Middle
Keep each generation on an invisible horizontal band, almost like rows across the page. This simple mental model helps you maintain structure as the diagram grows.
It also helps to zoom out occasionally and look at the layout as a whole. If the diagram starts to feel crowded or misaligned at around 70% zoom, it’s usually a sign that you should fix a thing or two in it.
Step 8: Group by family units
Only group after the connectors are correct.
Select:
- Couple shapes
- Their partner line
- Their children and branch connectors
Right-click → Group
Now you can move entire family units safely.
Don’t group the entire page at once because this might make future edits painful.
Step 9: Add a legend or key
Place a small legend in the bottom or side corner.
Include:
- Male square
- Female circle
- Deceased X
- Marriage line
- Divorce slash
- Any abbreviations used
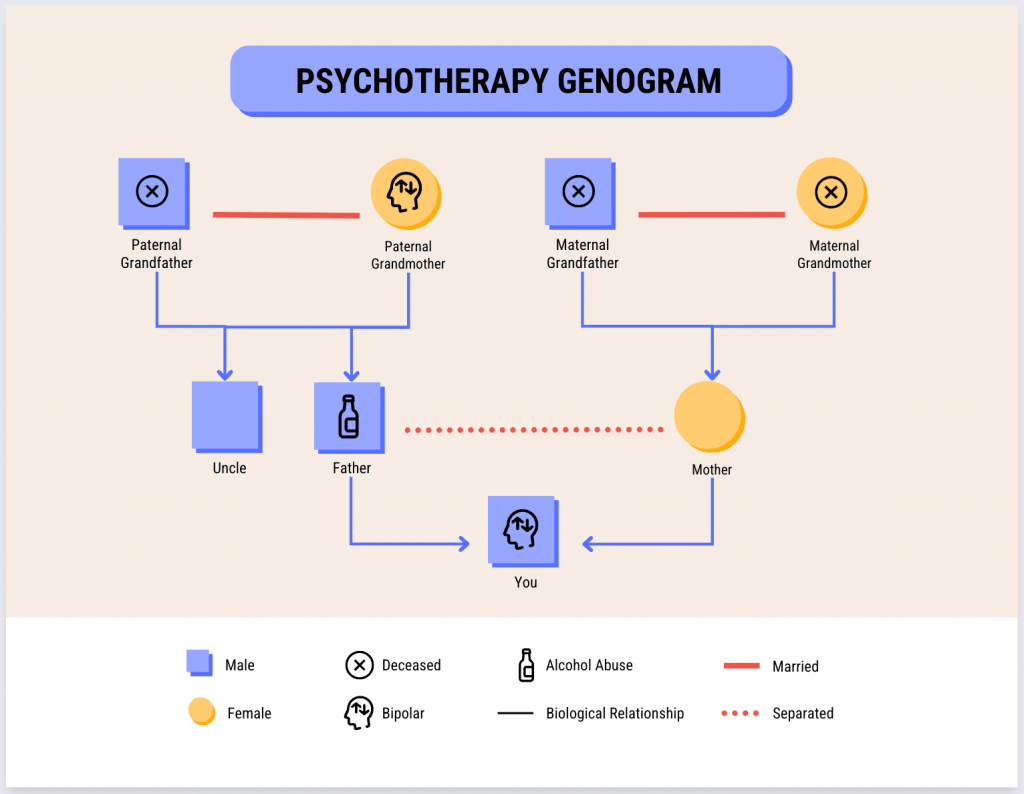
I personally like how this psychotherapy genogram template presents its legend clearly:
If you’re making a genogram as part of an academic coursework, add:
- Title
- Date
- “Three Generations” note
Your intended readers should understand your diagram without asking questions.
Method 2: Steps to create a genogram with SmartArt
SmartArt is faster, but it’s also more rigid.
Use this if you need a simple, clean family-tree style layout. Skip it if your genogram includes divorce, remarriage, blended families or detailed annotations.
Here’s how to go about it.
Step 1: Insert a hierarchy layout
Go to: Insert → SmartArt → Hierarchy
Choose a basic hierarchy chart to begin with and keep the structure simple. Avoid heavily styled presets since they tend to add formatting that you’ll end up undoing anyway.
Next, click OK. You’ll see a top box with subordinate boxes underneath.
Step 2: Enter names using the text pane
Click the arrow on the left side of the SmartArt graphic to open the Text Pane.
Type names there.
- Press ‘Enter’ to add a sibling.
- Press ‘Tab’ to create a child level.
This is quick for basic generational structure.
Step 3: Adjust layout and style
Click the SmartArt graphic → Go to SmartArt Design
Keep the formatting minimal. Use:
- Add Shape to insert more family members
- Change Colors for minimal styling
- Layout options if needed
Where SmartArt works best
If your goal is speed and simplicity, SmartArt gets you there. It’s great for:
- Straightforward, single-marriage family structures
- One or two generations
- No complex relationship markers
Where SmartArt fails
SmartArt genogram struggles with:
- Divorce or separation slashes
- Multiple partnerships
- Remarriage with children from different unions
- Custom symbols like diamonds or deceased markers
- Emotional or medical overlays
You can convert SmartArt to shapes by right-clicking → Convert to Shapes. This gives you more control but defeats the simplicity that makes SmartArt attractive.
If you need precision, Shapes + Connectors (Method #1) still wins.
Can you use Word’s Draw tool for a genogram?
Yes, you can. But you probably shouldn’t. Here’s why:
What the Draw tab is good for
The Draw tab works well for:
- Quick sketches
- Circling or annotating parts of your diagram
- Marking emotional relationship lines by hand
- Adding emphasis during class discussion
If you use a stylus or touchscreen, freehand drawing feels natural.
You can draw squares, circles and lines manually. You can even convert ink to shapes in some Word versions.
Our recommendation: Use Draw for annotations. Use Shapes for drawing the actual genogram.
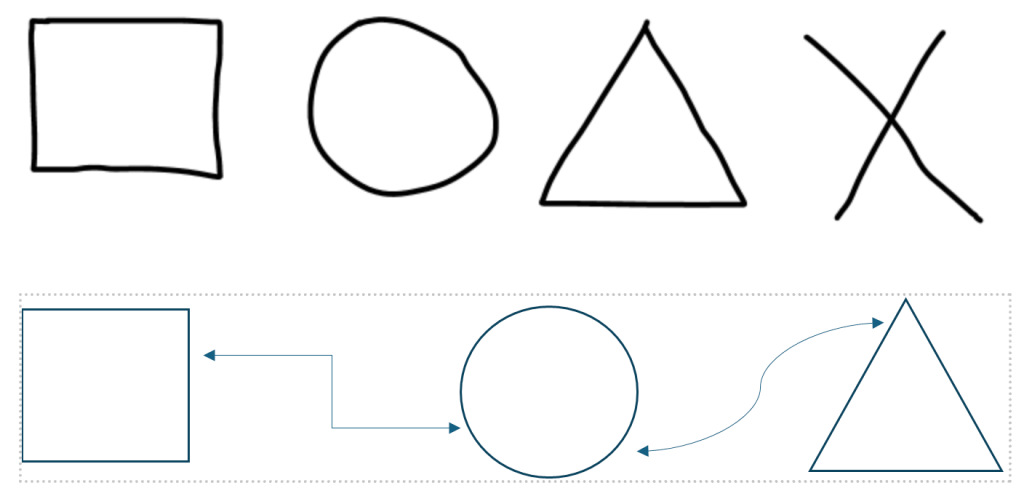
Here’s the difference between the two, with Draw results at the top and Shapes at the bottom:
Why the Draw tab is not ideal for structure
Freehand lines don’t snap to connection points, auto-align or stay perfectly straight. Once you start moving shapes around, those lines tend to shift, which makes editing frustrating.
If you want a clean, editable genogram, Method #1 give you far more control, while the Draw tool is better suited for quick sketches or annotations.
If the Draw tab is missing/disabled
From the top menu, go to:
File → Options → Customize Ribbon
Make sure Draw is checked.
On some desktop versions, the tab appears only if you’re using a touch-enabled device. Word Online may also limit certain ink features.
Which method is the easiest for creating a genogram in Word?
Using shapes and connectors is the easiest method because they give you the most control over family members, relationship lines and layout. SmartArt works better for simple family structures, while the Draw tools are useful for quick sketches or custom markings.
How to save and export a genogram from Word
Most genograms run into trouble right at the finish line, when shapes shift, lines detach or the spacing changes when you open the file on another computer.
Here’s how you prevent that.
1. Save your working file properly
Always save your editable version as .docx.
This keeps grouping, connectors and formatting intact. Don’t submit your only editable copy. Keep a master version in case you want to revisit the orignal draft later.
2. Export the final version as PDF
Once you’re done finalizing the genogram, go to:
File → Export or File → Save As → PDF
Unlike a .docx file, PDF locks the layout.
In a .docx file, Word may rearrange elements depending on version, device or printer settings. But PDF retains almost every formatting down to the line weight.
After exporting, open the PDF and zoom in to make sure that the alignment, symbols and connectors sit exactly where you placed them.
3. Keep the entire genogram on one page
Most people expect a single-page layout unless there’s a clear reason to spread the genogram across multiple pages.
To make that happen:
- Use Landscape orientation
- Set Margins → Narrow
- Select siblings and use Distribute Horizontally
- Tighten vertical spacing between generations
- Avoid oversized shapes
If spacing feels crowded, reduce gaps evenly rather than shrinking random elements.
4. Group before final adjustments
We’ve touched this briefly earlier. As a reminder, do this before your final export:
Select family units → Group
That’s because grouped elements move together. Ungrouped connectors might drift during last-minute edits.
Pro-tip: Don’t group the entire page into one massive object. Keep grouping logical by family clusters.
5. Optional: Save as an image
If you need to save your genogram as a larger report:
- Take a high-resolution screenshot. I really like Greenshot for this because it lets you capture a specified area and export a clean PNG image.
- Or, you can also select the grouped diagram → Right-click → Save as Picture
PNG works well for documents, especially when you export it at a high resolution so the diagram appear clear and not blurry.
Tips and troubleshooting
Even a carefully built genogram can run into issues, because Word tends to behave in unpredictable ways when you’re dealing with more complex diagrams.
Here are some common issues you might encounter, along with the fixes that usually resolve them.
1. Shapes jump around
Problem: You move one shape and everything shifts.
Fix: Right-click the shape → Wrap Text → In Front of Text
If even one shape is set to “In Line with Text,” Word treats it like a paragraph. That’s when layouts collapse.
2. Lines don’t stay attached
Problem: You move a person block and the relationship line stays behind.
Fix: Use Connectors, not regular lines.
Go to: Insert → Shapes → Lines → Connector (Straight)
When you attach it correctly, the connector snaps to a connection point on the shape. If you do not see a snap highlight, it is not properly attached.
3. It’s hard to select the right object
Problem: You click a line but select a shape behind it. Or you cannot grab a small slash.
Fix: Go to Shape Format → Selection Pane
This shows every object on the page in a list. Click the exact item you want.
If you do not see the Selection Pane, use Select → Select Objects from the ribbon.
4. Alignment looks slightly off
Problem: Rows look uneven. Spacing feels inconsistent.
Fix: Select the shapes → Align → Align Top
Then → Distribute Horizontally
For couples, use Align Middle, so partner shapes sit perfectly level.
Zoom out to 70 percent. Misalignment becomes obvious at lower zoom levels.
5. The diagram becomes impossible to edit
Problem: You grouped everything at once. Now small edits are painful.
Fix: Undo full-page grouping.
Group in smaller units:
- Each couple
- Each sibling cluster
- Each family branch
6. Printing looks faint or blurry
Problem: Lines look thin on paper. Slashes disappear.
Fix:
- Increase line weight to 1–1.5 pt
- Avoid pale grey outlines
- Use solid black or dark grey
- Export as PDF instead of printing from .docx
Always preview the PDF before submission.
7. The page feels too crowded
Problem: Everything fits, but it looks cramped.
Fix:
- Reduce vertical spacing evenly
- Slightly shrink the shape dimensions
- Re-distribute horizontally
- Switch to Landscape if you forgot
Do not randomly shrink some shapes and not others. Keep proportions consistent.
What are the limitations of creating a genogram in Word?
Microsoft Word is not built specifically for genograms. It can work well enough for a simple genogram, but it becomes harder to manage as you add more generations, relationship types and family details.
Here are some of the common limitations of using Word to create a genogram:
- You have to build everything manually: Every family member, connector and relationship marker has to be added, positioned and formatted separately.
- Complex relationships are harder to show: Divorce, remarriage, adoption, twins and emotional relationships can quickly make the diagram difficult to organize.
- Edits can disrupt the layout. Adding or moving one family member often means realigning nearby shapes and connectors.
- There are no dedicated genogram tools. Word only gives you generic shapes and lines, so you have to recreate standard genogram notation yourself.
- Large genograms are difficult to manage. Once you start mapping several generations or a large family, fitting everything neatly onto one page becomes challenging.
- The final design can take more work to polish. Consistent spacing, alignment and visual hierarchy all need to be handled manually.
For a small, one-off genogram, these limitations may not matter much. But if you’re working with a larger family structure or expect to make several changes, a dedicated Genogram Maker like Venngage can save a lot of manual work.
Create a genogram faster with Venngage AI
Creating a genogram manually requires a lot of effort, whether you use Word or another basic genogram software. You have to add each shape, enter the text, connect family members and then adjust everything until the layout looks right.
A faster option is to use an AI design tool that can create the shapes, text and genogram structure for you. Venngage AI Diagram Generator can help you do that and still gives you the flexibility to edit the design afterward.
Generate a genogram from a text prompt
Venngage can generate a genogram from a simple text prompt. Simply add the family structure you want to map. Add the family members, their relationships and any details you want to show, and Venngage AI will generate a genogram with the names, symbols and connections already laid out.
You don’t have to add every shape manually or draw each relationship line yourself.
For example, you could prompt:
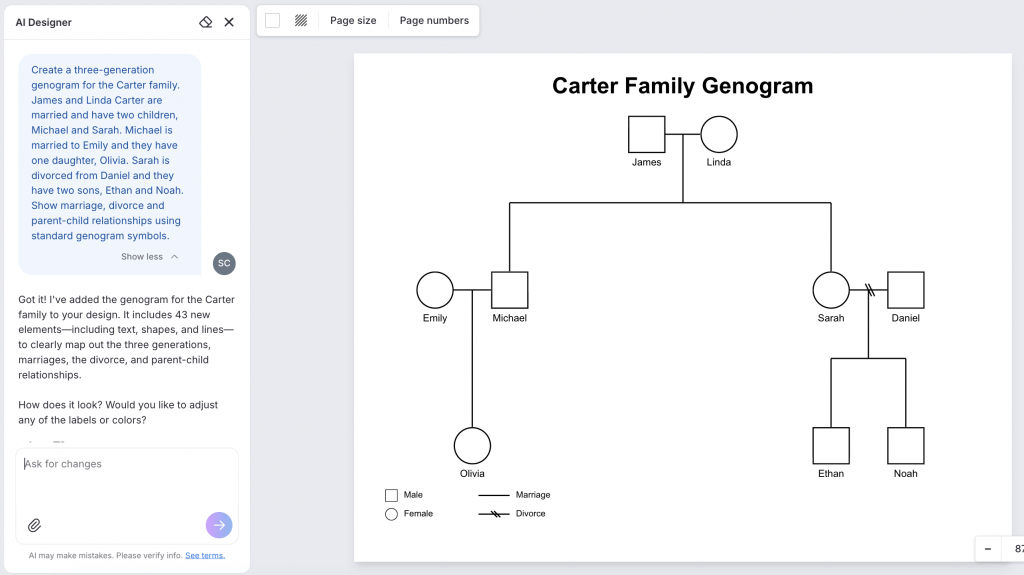
Create a three-generation genogram for the Carter family. James and Linda Carter are married and have two children, Michael and Sarah. Michael is married to Emily and they have one daughter, Olivia. Sarah is divorced from Daniel and they have two sons, Ethan and Noah. Show marriage, divorce and parent-child relationships using standard genogram symbols.
Here’s a sample genogram I generated in Venngage using the same prompt:
Edit the genogram with AI
Venngage AI generated customizable AI genograms, so you can easily move shapes around, change names, add icons or adjust the layout using the drag-and-drop editor.
If you want to make the process to create a genogram even faster, edit the genogram with Venngage AI. Instead of changing things manually, go to the chat section and tell the AI Designer what you want to change. You can ask it to:
- Add another family member
- Add a third generation
- Change a relationship
- Update the text
- Rearrange the layout
- Make the genogram easier to read
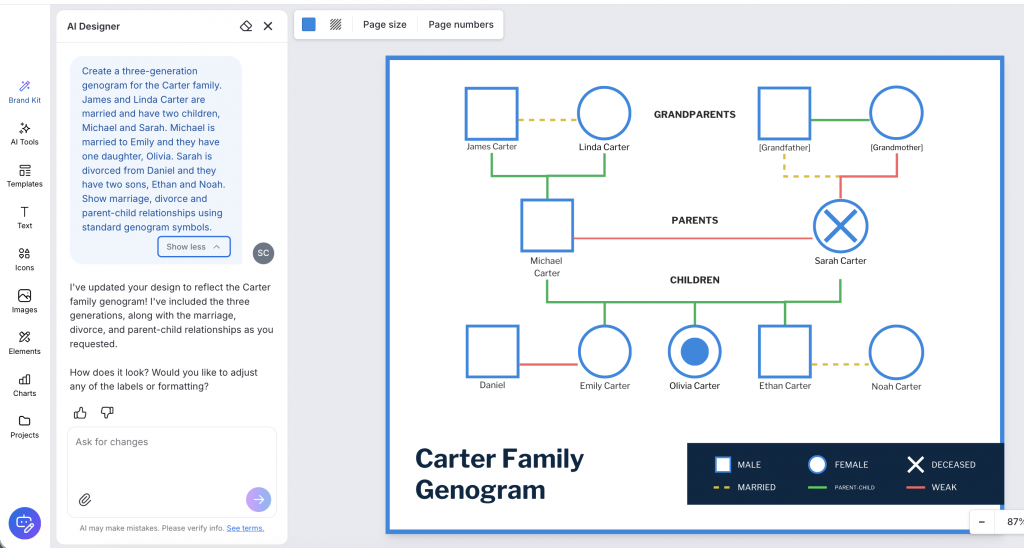
For example, I created another genogram using the same Carter Family prompt above and some of the relationships turned out to be wrong.
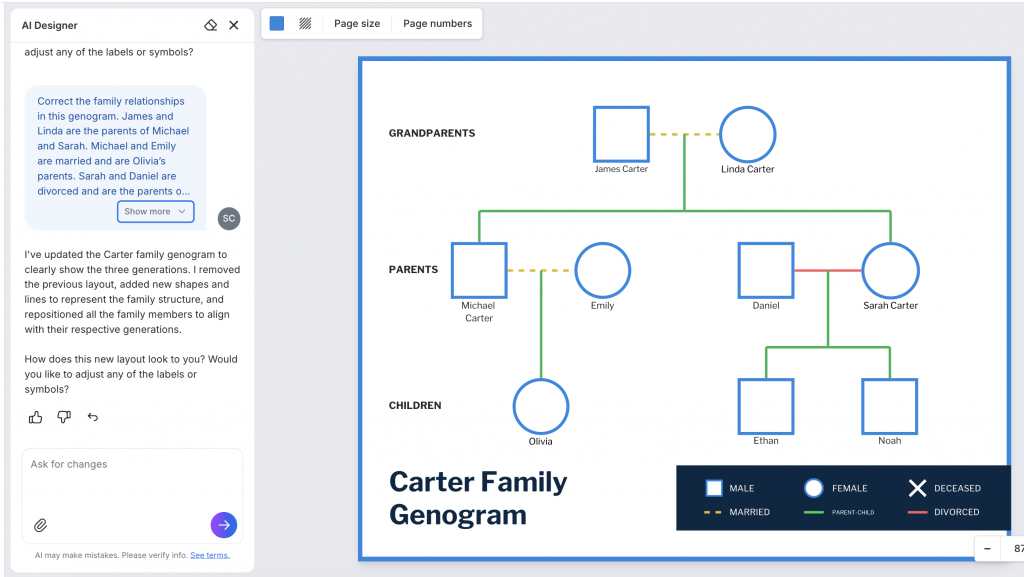
I asked the AI Designer to fix the relationships and here’s how the final result looks.
You can also use Venngage’s AI Icon Generator to create custom icons for your genogram. For example, you can generate icons for occupations, medical conditions or major life events and add them to the design when you need to show more than family relationships.
Start with a genogram template
If you already have a clear idea of the layout you want, you can also start with a ready-made genogram template in Venngage.
Choose a template that matches the family structure you need and edit it using AI. Add the prompt and Venngage AI replace the sample information with your own and adjust the symbols, relationships and layout as needed.

This works well when you want more control over the starting design but still want to avoid building the entire genogram manually.
Word vs Venngage: which is better for creating a genogram?
Word works well if you need a simple genogram and already use Microsoft Office. Venngage is a better fit if you want to reduce the manual work, generate the first version with AI or make changes without rebuilding the diagram yourself.
How to protect private information in a genogram?
Genograms can include personal details such as names, family relationships, medical history and major life events, so be careful about what you include and how you share the final diagram.
Only add information that is relevant to the purpose of the genogram. If you’re sharing it outside a private setting, consider removing full names, exact dates and other identifying details. You can also use initials or fictional names when the real identity of family members isn’t important.
If the genogram includes medical, psychological or other sensitive information, check any privacy or confidentiality requirements that apply to your school, workplace or professional setting before sharing or uploading it to another tool.
If you’re testing an AI genogram generator, use fictional or anonymized family information rather than sensitive real-world details.
Start creating a genogram
Microsoft Word can work well for a simple genogram, especially if you already have access to it and don’t mind building the diagram manually. Shapes and Connectors give you the most flexibility, while SmartArt and Draw offer quicker options for simpler layouts.
If you want to spend less time adding and connecting shapes, Venngage AI can generate the first version of your genogram from a text prompt. From there, you can edit the layout, update family details or start with a template and customize it with AI.
The right option ultimately depends on how complex your genogram is and how much manual work you want to do.
FAQs about creating a genogram in Word
1. Can you make a genogram in Microsoft Word?
Yes. You can create a genogram in Word using Shapes and Connectors, SmartArt or the Draw tools. Shapes and Connectors give you the most control if you need to show several generations and different types of family relationships.
2. Does Microsoft Word have a genogram template?
Word does not have a dedicated built-in genogram template. You can build one manually using Shapes and Connectors or adapt a SmartArt hierarchy. If you want a ready-made starting point, you can use a genogram template in a dedicated diagramming tool.
3. What is the easiest way to make a genogram?
The easiest way to make a genogram is to use a dedicated genogram maker or AI diagramming tool like Venngage that can create the basic structure for you. You can also make one manually in Word using Shapes and Connectors, but you’ll need to add, connect and arrange each family member yourself.
4. How do you make a genogram using AI?
To make a genogram using AI, describe the family members, generations and relationships you want to show in a text prompt. An AI diagram generator like Venngage can turn those details into a genogram with the initial symbols, names and connections in place, which you can then edit and customize.
5. How many generations should a genogram include?
A genogram commonly shows at least three generations so you can see family relationships and patterns across generations. However, you can include fewer or more depending on the purpose of your genogram.