


Since 30,000 BC, when we were painting on cave walls, we’ve been using simple images to communicate.
Icons are the modern-day equivalent of cave paintings. They are simple, visual symbols that are used to communicate real-world concepts and ideas, that are designed to be universally and intuitively understood.
If you look around you, you’ll see them everywhere—on your phone, on your computer, on bathroom doors, on road signs, in instruction manuals, in airports…anywhere that clear communication is necessary.
![]()
Icons are used all the time in infographics, too. They’re often added as an accompaniment to infographic text, used to bring some extra visual flair to the table.
But there’s much more to infographic icons than just aesthetics.
Icons and icon stories are powerful communication tools
Our brains are primed to process visual information, with 40% of our cerebral cortex devoted to visual perception.
Infographics are unique in that they can be designed to leverage this strength of the human visual system. The most effective infographics use eye-catching visuals to summarize and communicate complex ideas quickly and easily.
And icons are one of the best ways of doing that.
Icons are the perfect tool for representing ideas visually because they are:
- Engaging: they can add personality to an otherwise bland graphic
- Unambiguous: they can be understood regardless of language or reading level
- Flexible: their size and color can often be modified, making them easy to customize to fit an infographic
Plus, they have that undeniable “it” factor:

But best of all, icons can be used like a visual language. They can be strung together like words, used to tell visual stories, or “icon stories”.
Icon stories can be used to simplify and communicate ideas, scenes, and feelings that are otherwise hard to express.
We all know that it’s better to show than tell. Combining icons to create compelling icon stories is an easy way to replace words with visuals, and will help you connect and engage with your audience.

So today I’m going to teach you how to use icon stories to take your infographic to the next level. Plus, I’ll give you some quick tips on how to make the most of icons in Venngage.
NEW! Introducing: Marketing Statistics Report 2022
It’s 2022 already. Marketers, are you still using data from pre-COVID times?
Don’t make decisions based on outdated data that no longer applies. It’s time you keep yourself informed of the latest marketing statistics and trends during the past two years, and learn how COVID-19 has affected marketing efforts in different industries — with this FREE marketing statistics report put together by Venngage and HubSpot.
The report uses data gathered from over 100,000 customers of HubSpot CRM. In addition to that, you’ll also know about the trends in using visuals in content marketing and the impacts of the pandemic on visual content, from 200+ marketers all over the world interviewed by Venngage.
Grab your copy now — it’s not like any other marketing reports out there, plus it’s 100% free!

When to use an icon story in an infographic
There are three easy ways to put icon stories to work in an infographic.
1. Use an icon story for decoration
If the idea of an icon story is new to you, the easiest way to get started is by using icon stories for decoration.
Combining icons to create decorative elements is a pretty straightforward process, and can give a design extra visual impact, as you can see in this live art and music poster:

Here are some basic guidelines for pulling this kind of decoration off.
Find a few different icons that center around the theme of your infographic.
The title page of this business plan template, for example, uses a few icons related to sales, money, and shopping, as decoration.

When deciding what icons to add to your infographic, feel free to flex your creativity muscles–Venngage offers a database of over 10,000 icons. Browse through our icon categories to find the ones that best reflect the content of your infographic.
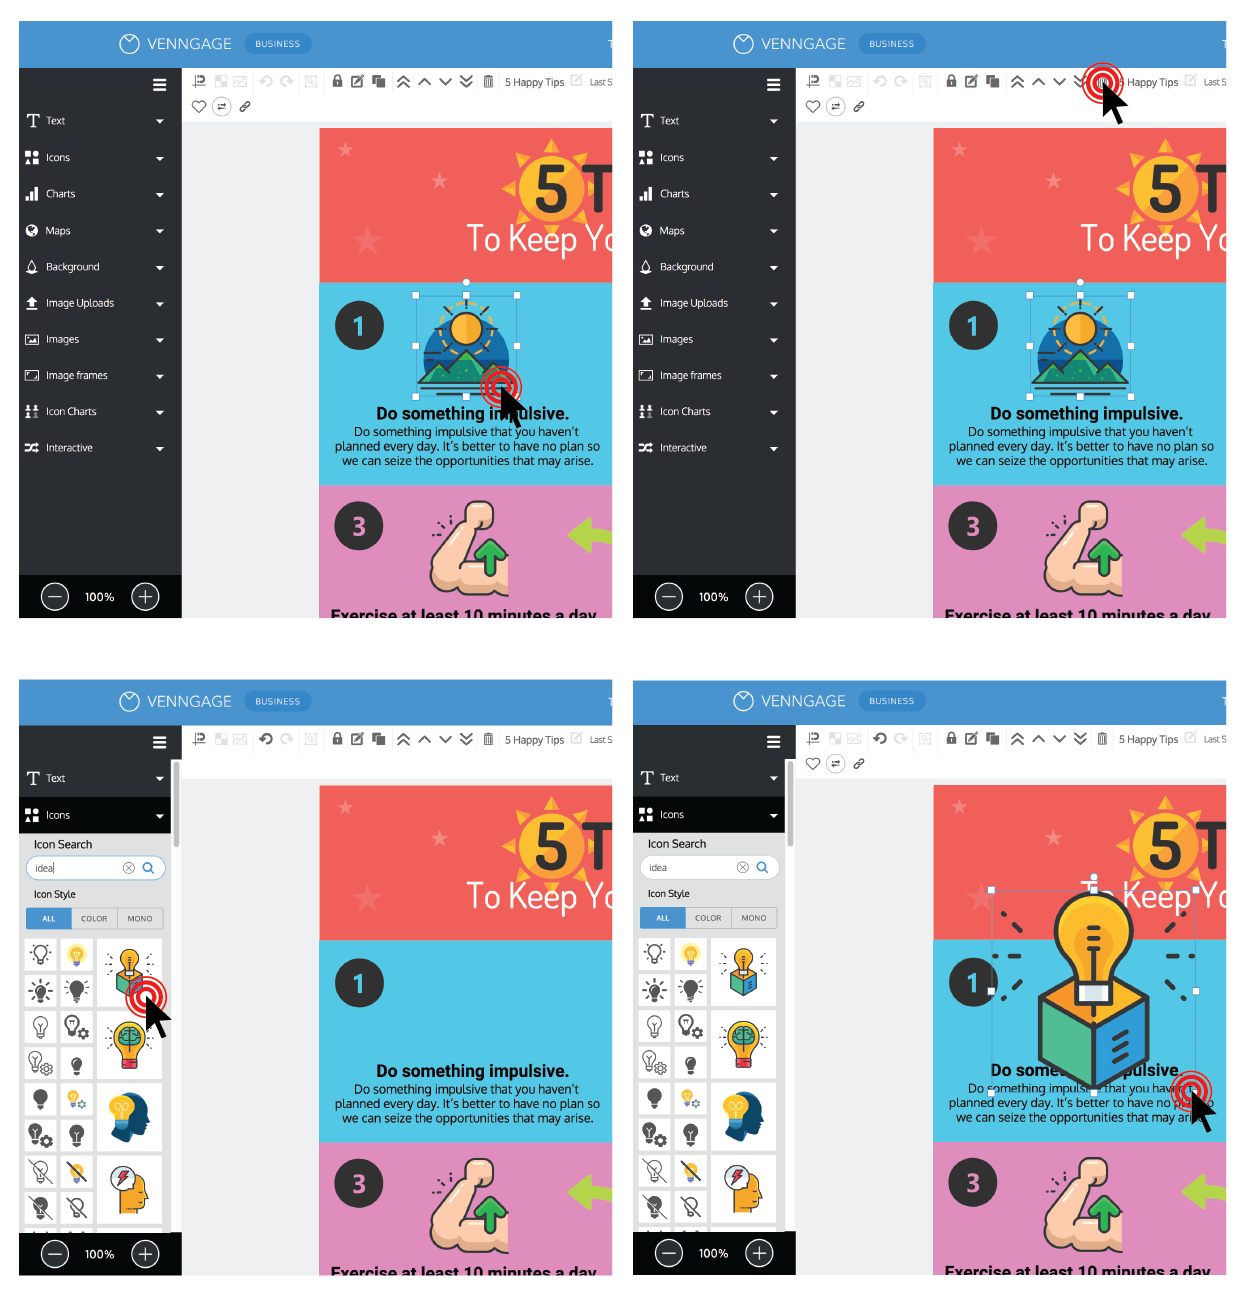
Click on relevant category titles to reveal the icons that fall under that category:
![]()
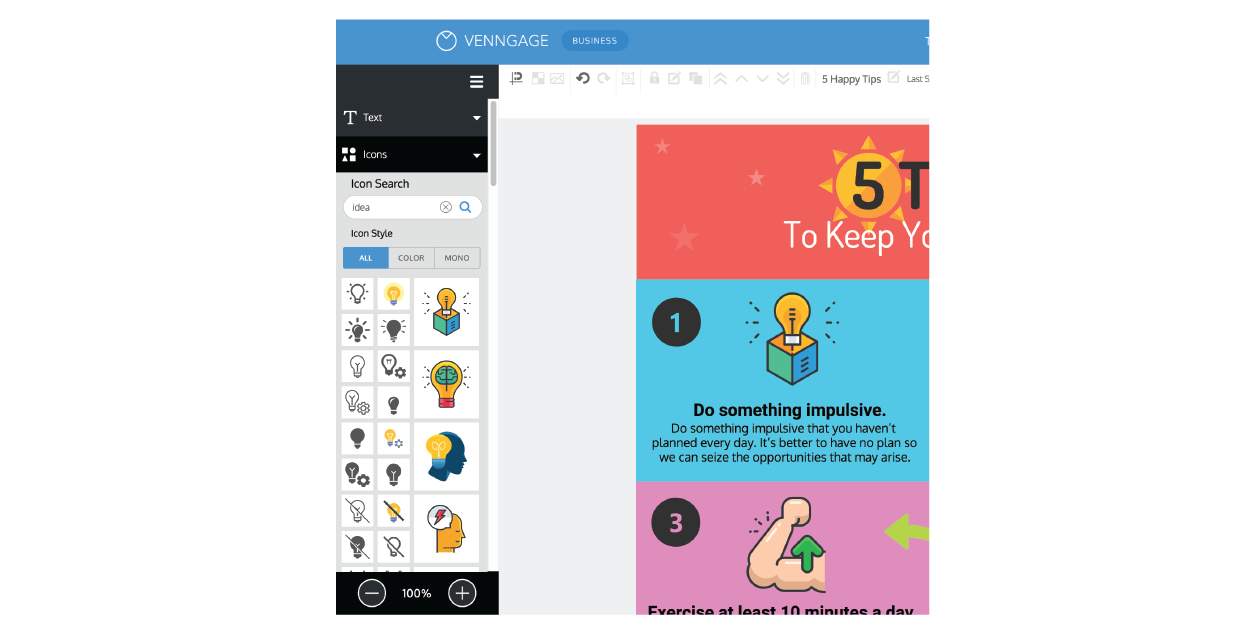
Or type relevant keywords into our icon search bar to look for something specific:
![]()
Then click the icon you want to use, and it’ll appear in the editor. Just try to keep a few things in mind when choosing your icons:
A single icon story should contain only icons of the same style.
In the business plan above, the icons work well together because they all have the same icon style. In Venngage, there are four main icon styles to choose from:

Since the business plan contains only monocolor outlined icons, the graphic has a satisfying sense of visual unity. When building your own icon story from scratch, always try to combine icons of the same visual style.
Make every icon the same color so the icon story feels like one cohesive unit.
Color is another thing to consider. The reason the icon story in this business plan works so well is that a single color is used to tie all of the decorative elements together!
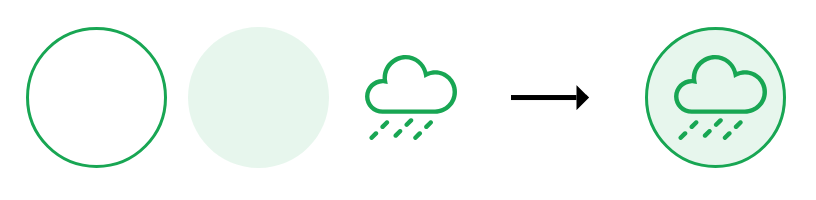
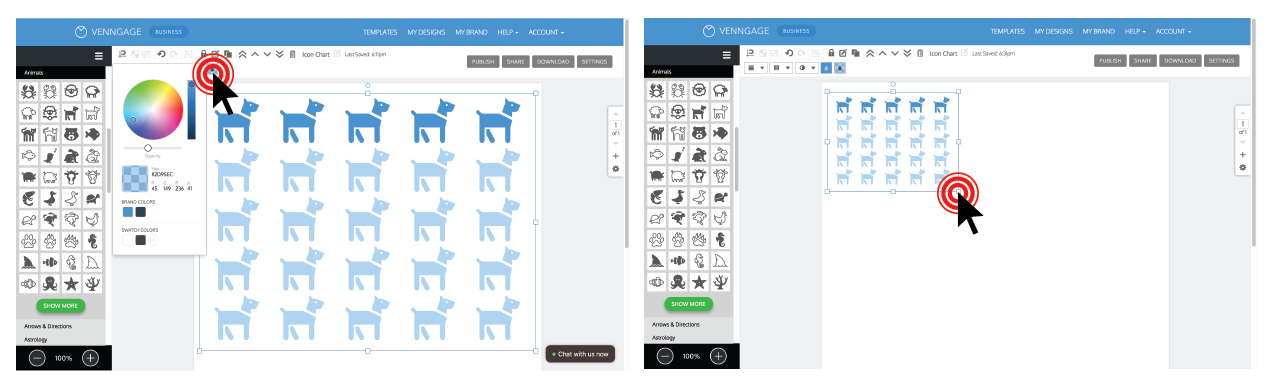
Venngage makes it easy to change the color of an icon. Just select the icon you want to change, click the color widget in the top toolbar, and click the desired color swatch:

The last piece of the puzzle that makes this icon story successful?
Use simple shapes to create backgrounds and borders around icons.
Simple icon shapes (borders and circles, in this case) can be combined with other icons to give them more visual weight and make them feel more complete. These simple shapes can be used as extra decoration, too.
Shapes and borders can be found at the top of the icons widget in Venngage’s left panel, under “Shapes and Symbols”, and “Lines and Borders”. To combine icons, match up their sizes and layer them on top of each other.

To summarize these tips and tricks for creating a decorative icon story:
- Find a few icons of the same style that center around the theme of your infographic
- Use a single icon color to pull these icons together
- Add simple icon shapes like circles and borders to give icons visual weight and create a sense of cohesion

2. Use an icon story to create a scene
Another easy way get started with icon stories is to combine icons to create scenes.
Like we can see in this infographic, multiple icons of the same style can be combined to create an eye-catching, impactful image that could pass as a custom illustration.


The idea with an icon scene is that you want to create something that looks seamless. This means that a lot of same principles apply here as for decorative icon stories: for the scenes to look natural, the styles and colors of combined icons must be consistent.
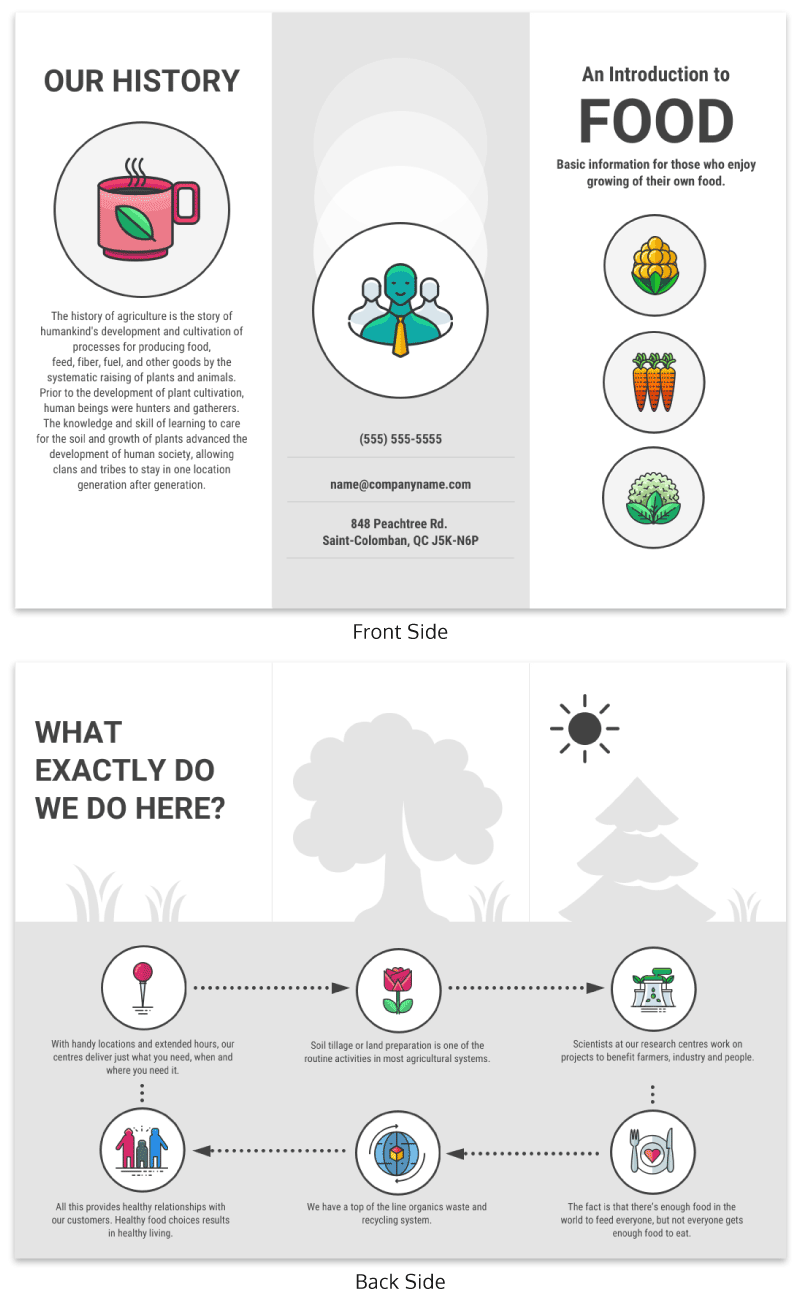
To get started, try your hand at using a few simple, recognizable shapes as subtle background elements. This strategy works well for creating outdoor landscapes or cityscapes, like we can see in this brochure template:
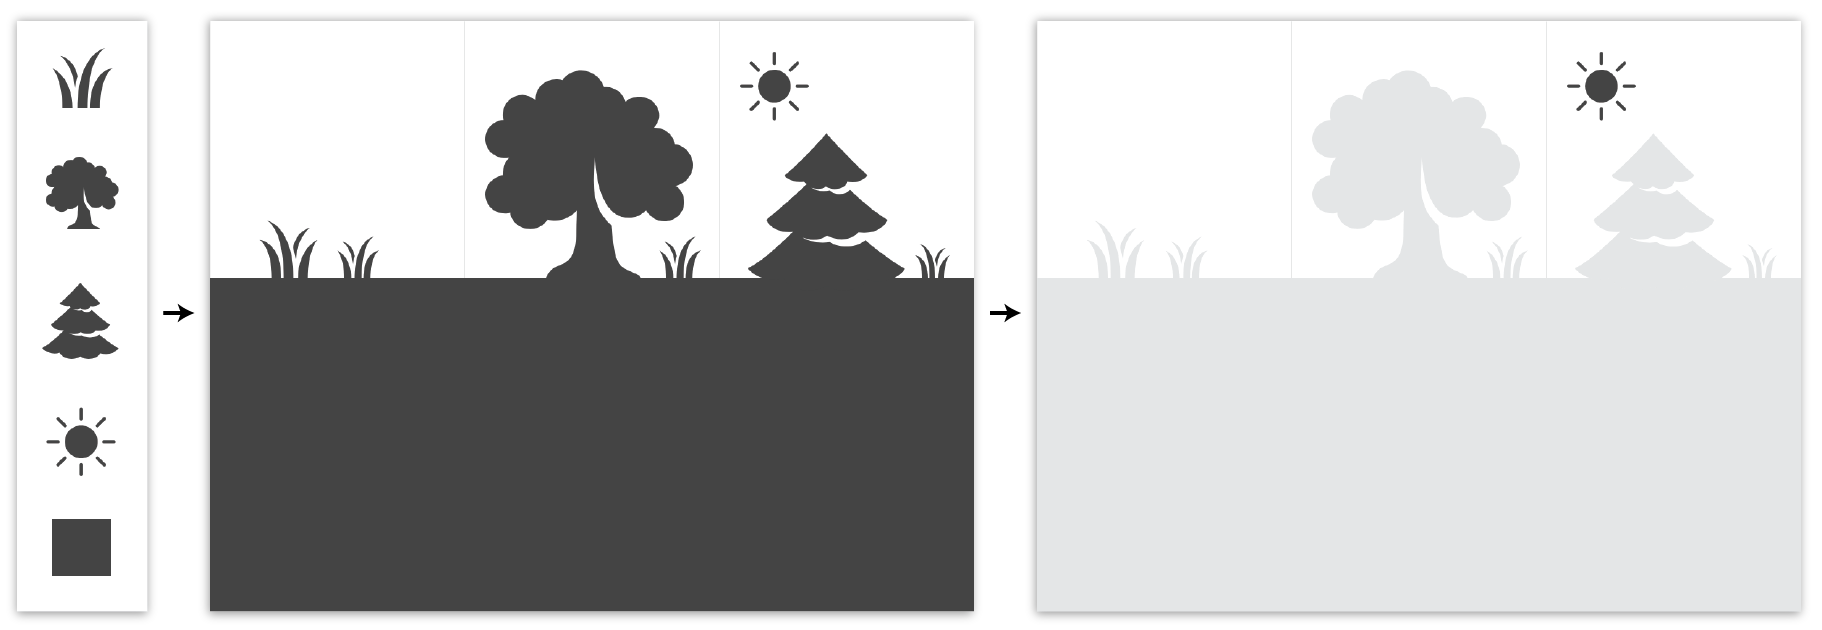
Or, take things up a notch by adding colorful, detailed icons as foreground elements over these simpler background icons. By combining foreground and background elements it’s possible to make a complete scene that can be used as a feature of your design.


Icon scenes don’t even have to have a lot of elements to work well!
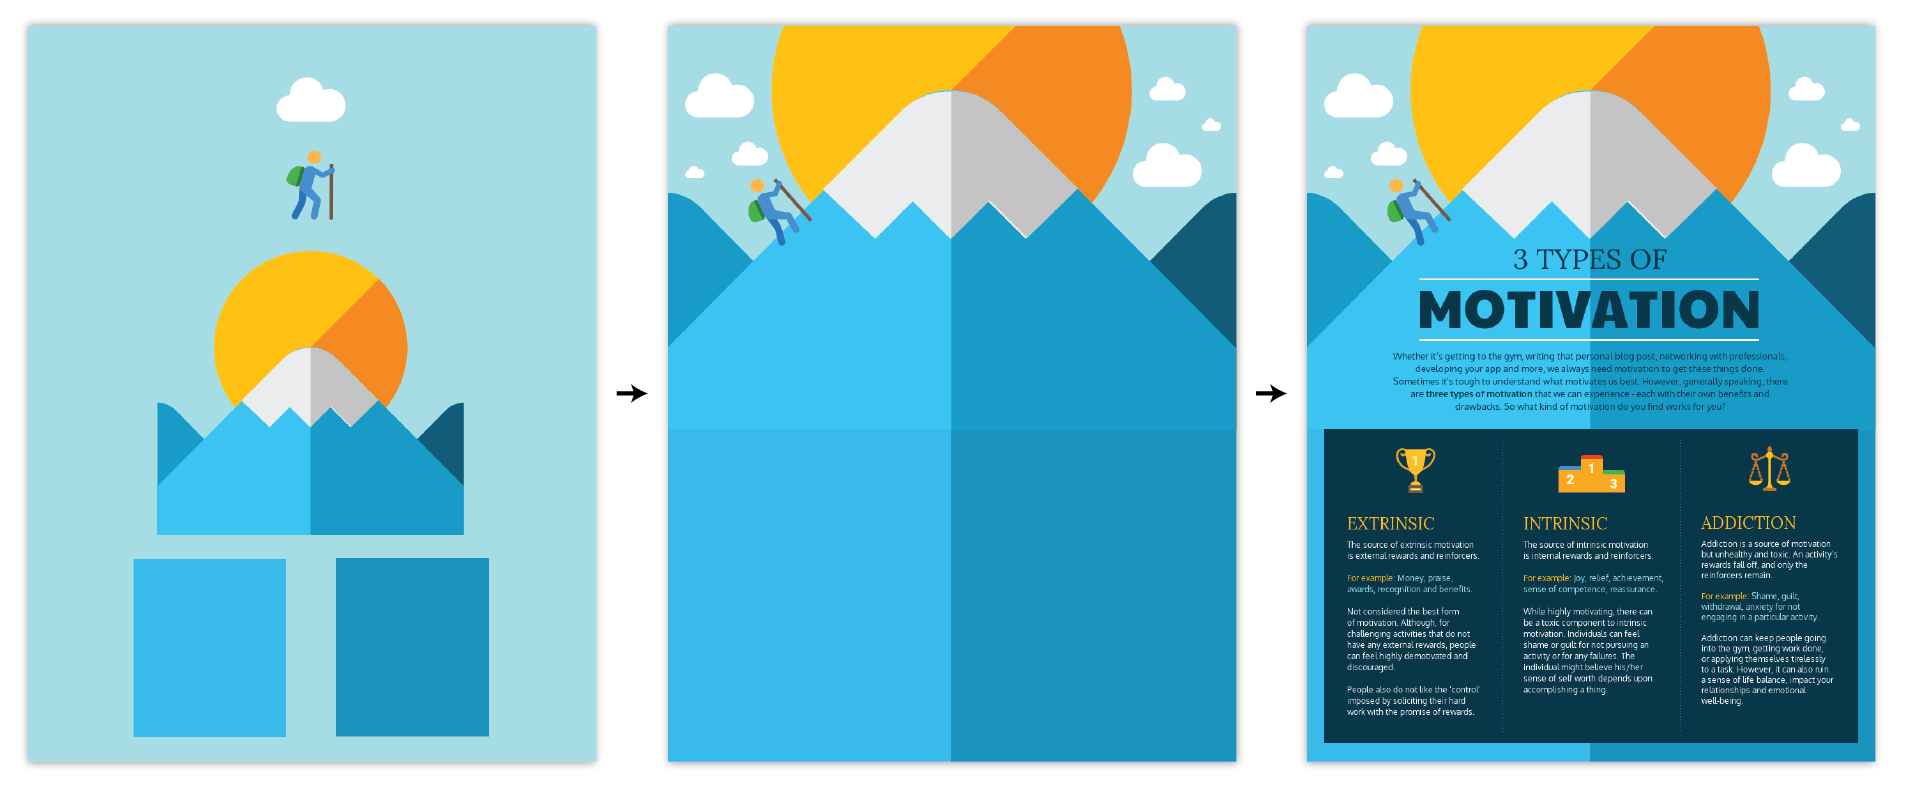
This one is a personal favourite of mine, because it’s much simpler than it looks. It creates an entire scene out of three icons and a few shapes, applying a clever metaphor for motivation. It takes style cues from the focal point (the mountain) and carries the same styling throughout for an impressive effect:

But enough of outdoor scenery, let’s look at some other types of icon scenes.
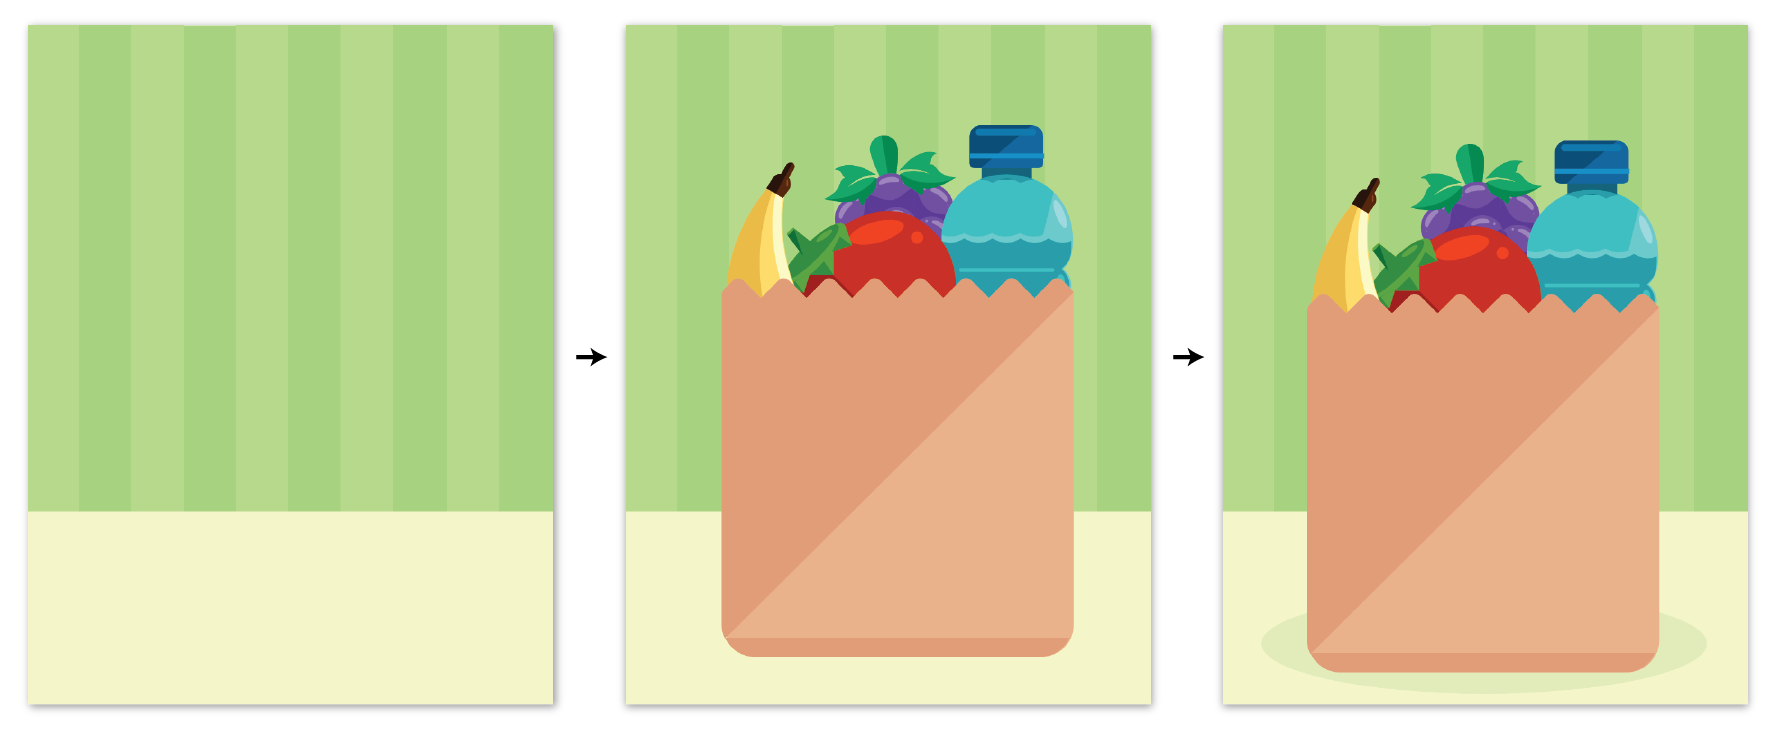
If you want to imitate a real life objects, do your best to create a sense of depth in your scene. Here are some easy techniques for creating depth with icons:
- Add a rectangle at the bottom of the page to represent the “ground”
- Layer multiple illustrated icons in the foreground
- Use a semi-transparent oval to mimic a shadow on the ground.
All of these techniques are expertly applied in this price comparison infographic:

Oh, and stick with illustrated icons for icons scenes whenever possible – the little bit of extra realism they carry tends to make the finished product a lot more effective.
Don’t feel like every scene has to mimic real life scenarios, though. It’s often just as effective to pick a few icons that match in style and color, and arrange them nicely on the page.

3. Use an icon story to represent data
The last type of icon story I’d like to touch on today is the icon chart.
An icon chart is a type of visualization that uses repeated icons to represent data.
You can use them to add visual interest to very simple data, like in this quick breakdown of coffee shop numbers in the United States:

In an icon chart, basic icons are stacked, either horizontally, vertically, or both, to illustrate a simple number or proportion. Kind of like a visual tally, it’s especially useful for simple quantitative data like survey results.

Visually stacking items to represent simple data has been shown to improve short-term recall of that data, compared to bar charts. And using icons, specifically, compared to other generic shapes like circles has been shown to boost both engagement and long-term recall of data.

So, assuming I’ve convinced you that you should definitely use an icon chart in your next infographic, here’s how to make one in Venngage.
Start by opening the ‘Icon Chart’ library in the left toolbar. This will reveal most of the same icon categories we saw earlier in the icon library, save for a few that don’t work so well in icon charts (detailed and illustrated icons are not so great for icon charts).
Find the symbol that you want to use, either by browsing the icon categories or by searching for a specific keyword, and click to create an icon chart with that symbol.

Play with the “icons/row” and “icons/column”, toggles to create the desired number of rows and columns. Then, if you’re visualizing a proportion set the “fill %” to the correct level. If you’re just visualizing a whole number, set the “fill %” to 100 so that every icon is the same color.

Then use the usual color swatches to adjust the icon color, and use the bounding box to resize the entire chart, if you need to.
Alternatively, if your data is ultra simple, you can make an icon chart manually from individual icons, like you can see in this template below.

Next time you want to visualize some data in an infographic, consider using an icon chart. But remember – this kind of data visualization is only appropriate for small, simple data series, not for visualizing large, complex datasets.
How to use icons like a pro in Venngage
By now you should almost be ready to use icons like a pro, but there are two things I haven’t touched on yet that are key for creating great icon stories.
How to favorite an icon
If you use Venngage regularly, favoriting icons is absolutely essential. It can speed up the infographic creation process exponentially! It’s best to favorite icons that you use regularly to make them easier to find.
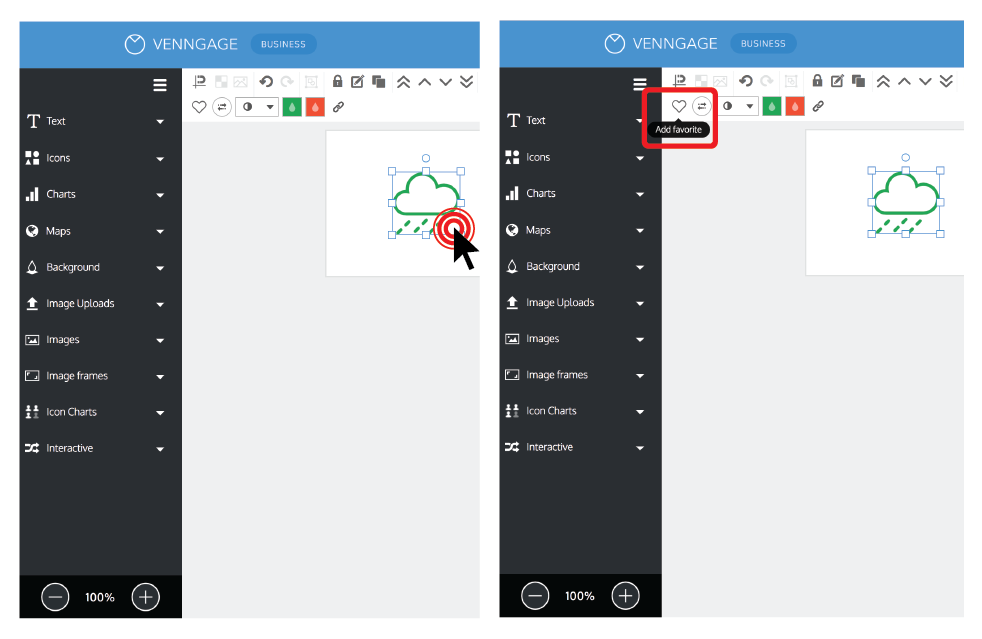
Favorite an icon in two quick steps:
- Select the icon you want to favorite.
- Click the heart at the top left of the editor.
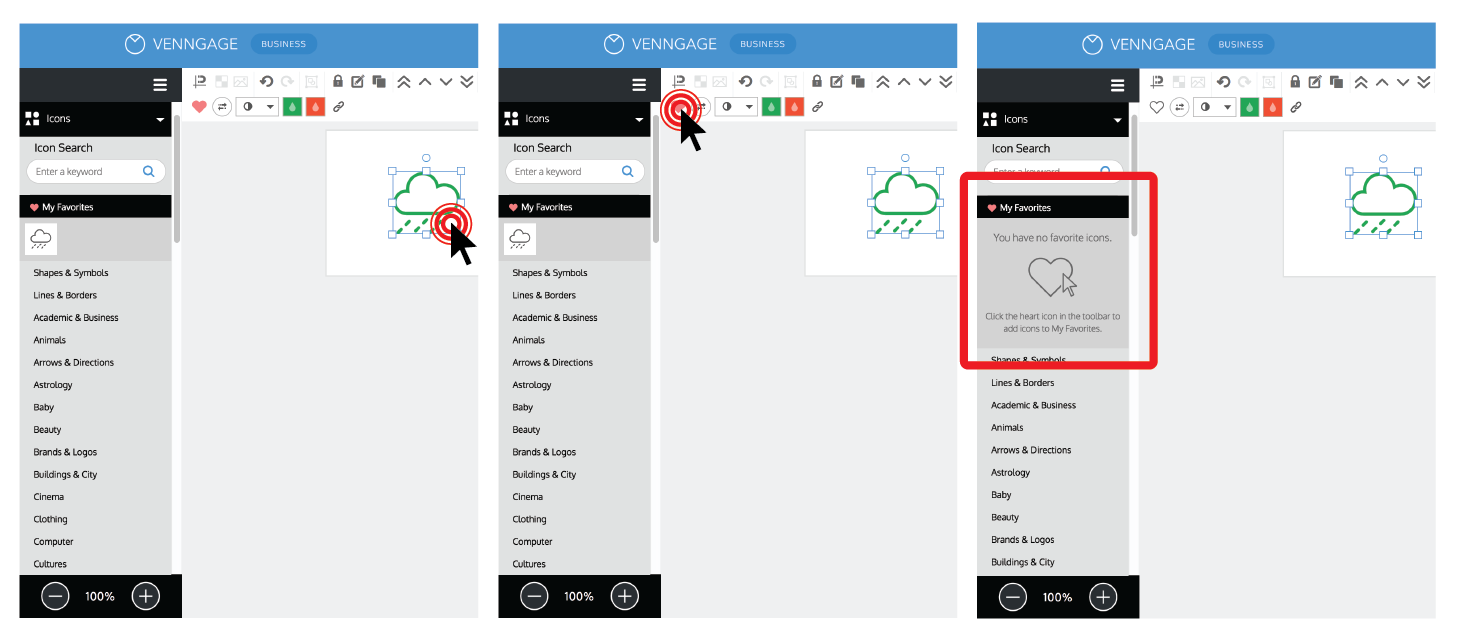
You can find your favorited icon under “My Favorites” in the icon tab in the left panel.

To remove an icon from “My Favorites”, select the icon and click on the heart again.
How to change an icon in a pre-existing template
If you’re not a designer, I recommend working from one of our many pre-designed infographic templates rather than building your own from scratch. Many of our templates already include icons, but don’t feel like you have to stick with those original icons.
You can swap out icons in a template in four steps:
- Select the icon you want to replace.
- Hit the “Delete” button on your keyboard, or click the “Delete” button in the top toolbar.
- Click the new icon you want to add.
- Resize it to fit, and drag it into place
Conclusion
I come across people all the time who have trouble simplifying and communicating complex ideas for their infographics.
If you ever run into this problem yourself, give icons and icon stories a try. They can communicate a lot of information in a small space and they’re great for engagement.


