


Your organization counts on your HR reports to predict future staffing needs, shine a light on performance drivers and find new ways to boost employee satisfaction. But let’s be real—traditional reporting methods often leave us buried under a mountain of dense, lengthy documents.
And guess what? These don’t exactly capture attention or inspire action.
HR analytics have the power to change that. McKinsey reports that companies who use data for decision-making are 23 times more likely to acquire customers and 19 times more profitable. Yet, many HR teams drown in data, struggling to make it meaningful.
It’s time to stop overwhelming your stakeholders with endless pages and start telling impactful stories. Visual storytelling transforms raw data into narratives that matter, making it easier to communicate insights to leadership. With the free HR report maker from Venngage, you can create sharp, visually appealing reports that highlight key HR metrics and trends.
These aren’t just reports—they’re a chance to build trust and showcase your department as a strategic player. Make your data not just visible, but impactful.
Ready to make your HR reports work harder? Let’s dive into how Venngage can change the game, turning your data into a powerful tool for understanding and action.
Why visual HR reporting is a game-changer
Simply put, when data is presented in an easy-to-understand format, managers, founders and other stakeholders can better use it to make decisions.
For example, if you are demonstrating the effectiveness of your hiring process, rather than listing the steps in a lengthy document, you can visualize the process as follows.
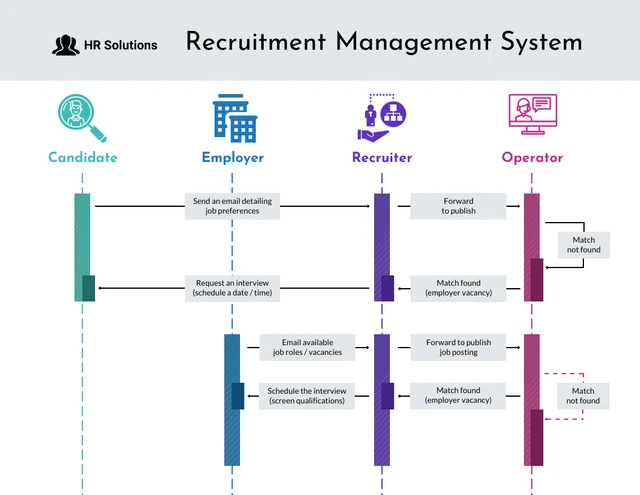
Here each stage of the process is clearly marked, making it easy for team members and leadership to view what works well and make suggestions on how to optimize the process, if required.
Similarly, another vital metric HR teams track is the employee turnover rate. Analyzing this by department and tenure reveals hidden patterns that drive strategic decision-making.
By transforming raw data into easily digestible charts and graphs, HR can quickly identify departments with high turnover, pinpoint critical departure points and uncover trends correlated with factors like employee tenure, role, or manager.
Look at how Deloitte used a neat bar graph to demonstrate the key reasons employees seek new employment.
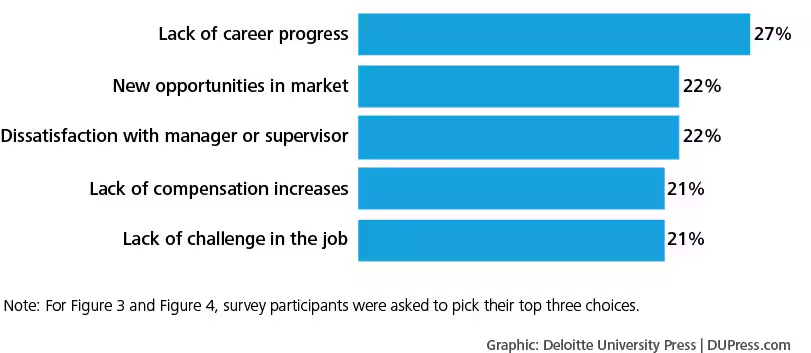
Source: Deloitte Insights
You can use such a graph to help C-suite executives quickly grasp key findings while you pinpoint root causes and share proposed retention strategies.
Businesses today are more dependent on HR reports to optimize employee performance, improve processes and improve business metrics than ever. But data does not speak for itself. Insights from reports are only as good as the ease of reading the reports.
Visual HR reporting is the key to effectively informing leadership on staffing and recruitment needs, workforce trends and enabling better resource allocation and budgeting decisions. It doesn’t just show data; it reveals the story behind the numbers, guiding informed decision-making.
By transforming complex data into easily digestible visuals, HR leaders can:
- Highlight skill gaps: By identifying skill shortages, HR can proactively plan for talent acquisition or upskilling initiatives, ensuring the organization remains competitive. A tabular representation of employees and their skills outlines the system for tracking employee progress and measuring results.
- Optimize resource allocation: A bar chart showing department-wise headcount and respective workload can quickly track imbalances. This empowers leadership to redistribute resources effectively, preventing burnout and maximizing productivity.
HR metrics and analytics are the foundation for aligning workforce strategies with business goals.
Jac Fitz-enz
- Uncover diversity and inclusion insights: By understanding employee demographics, such as gender, ethnicity and age across different departments and levels, you can identify areas for improvement and implement targeted initiatives to create a more inclusive workplace.
65% of the population learn visually. Using visuals in reports ensures you have management’s attention. They’re more likely to remember the findings of your report and act on them when you break down complex data into easy-to-understand, visually appealing infographics.
By leveraging the power of visuals, HR leaders can communicate complex information clearly and concisely, fostering data-driven decision-making and driving organizational change.
Essential features of effective HR reporting
When you communicate clearly through your reports to key stakeholders including managers and leadership, you bring about greater collaboration and alignment across the organization.
Effective HR reporting relies on several key features that enhance the creation, presentation and sharing of insightful reports. They help HR professionals drive strategic decision-making in the organization and build greater trust in management towards HR policies and results.
User-friendly interface for stress-free designing
HR professionals often juggle multiple responsibilities and may not have extensive design expertise. A simple, sleek and stress-free interface is key to effective HR reporting. It has clear navigation menus, organized content and clean design to help you explore the platform with ease.
Now, you can spend less time wrestling with complex software and focus on what really matters —analyzing data and generating insights.
A well-designed interface also has practical features like drag-and-drop tools and customizable templates are easy to get a handle on. This makes the learning curve shorter for your team members to adapt and start producing valuable reports.
The bottom line: a streamlined interface boosts productivity and ensures that crucial information is easy to access and understand.
Customizable templates for impact
Tailor-made templates are a game-changer for effective HR reporting. These aren’t just any templates; they’re designed with HR metrics in mind, making it easy to focus on what matters most.
Think pre-built graphs and diagrams that effortlessly showcase data—employee turnover rates, performance metrics, engagement scores and more.
The beauty of custom templates is in their adaptability. You can tweak them to reflect your unique branding, add or remove sections and highlight specific insights that matter to your organization.
This customization doesn’t just save time; it ensures that every report is on point and relevant.
The real magic? These templates help turn raw data into compelling visuals, making it easier for stakeholders to grasp complex information at a glance. They’re not just about looking good; they’re about making data work harder, faster and smarter for your team.
With tailor-made templates, you’re not just creating reports—you’re crafting stories that resonate and drive action.
Choose from a swathe of pre-designed free human resource report templates by Venngage to speed up your report creation process. Easily customize layout, content and visualization type based on what suits your organization the best.
Diverse visualization options for storytelling
Diverse visuals transform complex data into clear insights. This helps leaders grasp key points fast. Visuals make data more impactful and drive better decisions. With multiple options to choose from, you can pick the best format to highlight the most critical data points and insights.
To get the most out of diverse visualization options:
- Identify key metrics: Pinpoint critical HR metrics aligned with business goals.
- Choose the right visualizations: Select charts and graphs that best represent your data. For example, bar charts are best for comparisons, line charts for trends and pie charts for proportions.
- Design for impact: Create visually appealing and easy-to-understand graphics.
When you keep the above factors in mind, you’re bound to create HR reports that shine.
By blending diverse charts, graphs and infographics, you will create a powerful visual report that unveils hidden trends, quantifies impact and tells a persuasive story.
This is not just data presentation; it’s a strategic tool to influence decisions and drive business growth.
Create effective HR reports with customized templates that highlight the specific KPIs and relevant metrics for your organization.
Creating complex, data-driven reports often involves multiple team members, each bringing their unique expertise to the table. Choose a report maker platform that allows multi-member collaboration, so that everyone can contribute effectively.
With real-time collaboration features, your team and other stakeholders can work on the same report simultaneously, allowing for immediate input and feedback. This dynamic interaction not only speeds up the reporting process but also ensures that all perspectives are considered, leading to more comprehensive and accurate reports.
Professional export options for flexible reporting
I’d recommend you choose a platform that supports versatile export formats like PDF, PowerPoint, or interactive links. It allows you to tailor your report delivery to diverse audiences and preferences, ensuring the key messages resonate.
You can enable real-time collaboration through interactive online links, as well as preserve valuable HR data for future analysis with archiving.
HR metrics you can showcase with visual reports
You can better demonstrate the value of your work to leadership when you use visuals that represent data and facts clearly. It is easy to distill your report to the most important findings when you use visual reporting.
Here are some key reporting metrics to focus on:
Employee engagement
Studying employee engagement provides crucial insights into the overall health of an organization. By leveraging employee engagement software and analyzing factors like job satisfaction, turnover rates, and employee net promoter score (eNPS), you can identify areas of strength and weakness within the workplace.
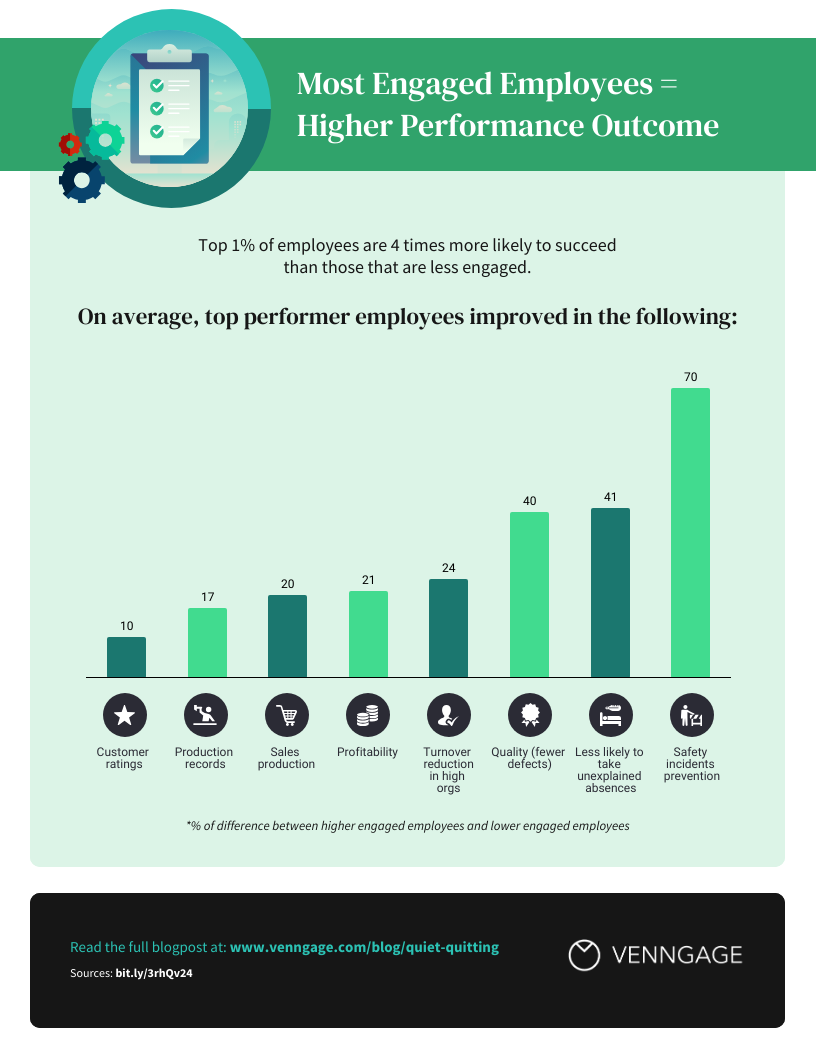
Additionally, exploring factors such as employee well-being, work-life balance and organizational culture can reveal deeper trends that impact the overall employee experience and impact business success.
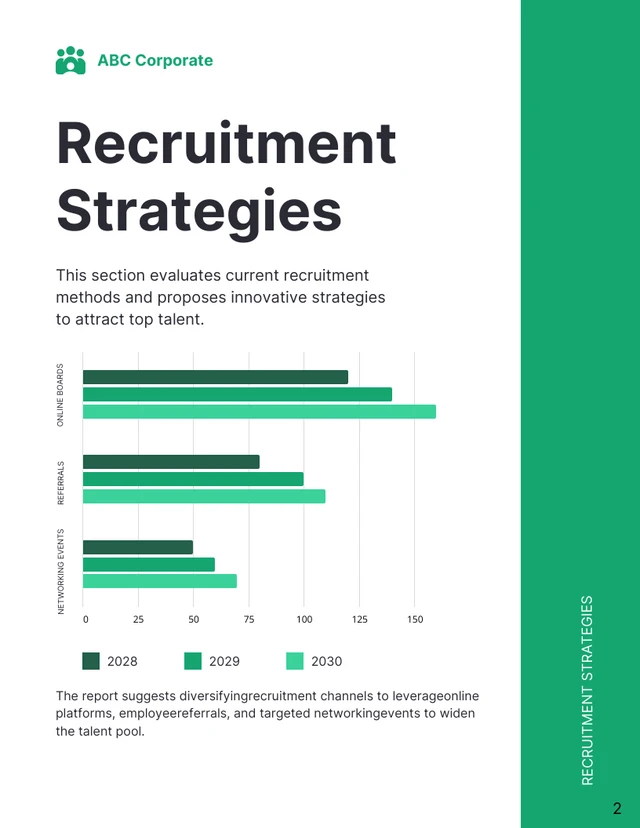
Recruitment and talent acquisition
The world economy is expecting a talent shortfall of 85 million people by 2030. Management relies on HR leaders to adapt recruitment and hiring practices to prepare for this predicted shortage.
Tracking analytics such as time-to-hire, cost-per-hire, candidate source effectiveness and candidate experience feedback will inform the strategies to improve talent acquisition.
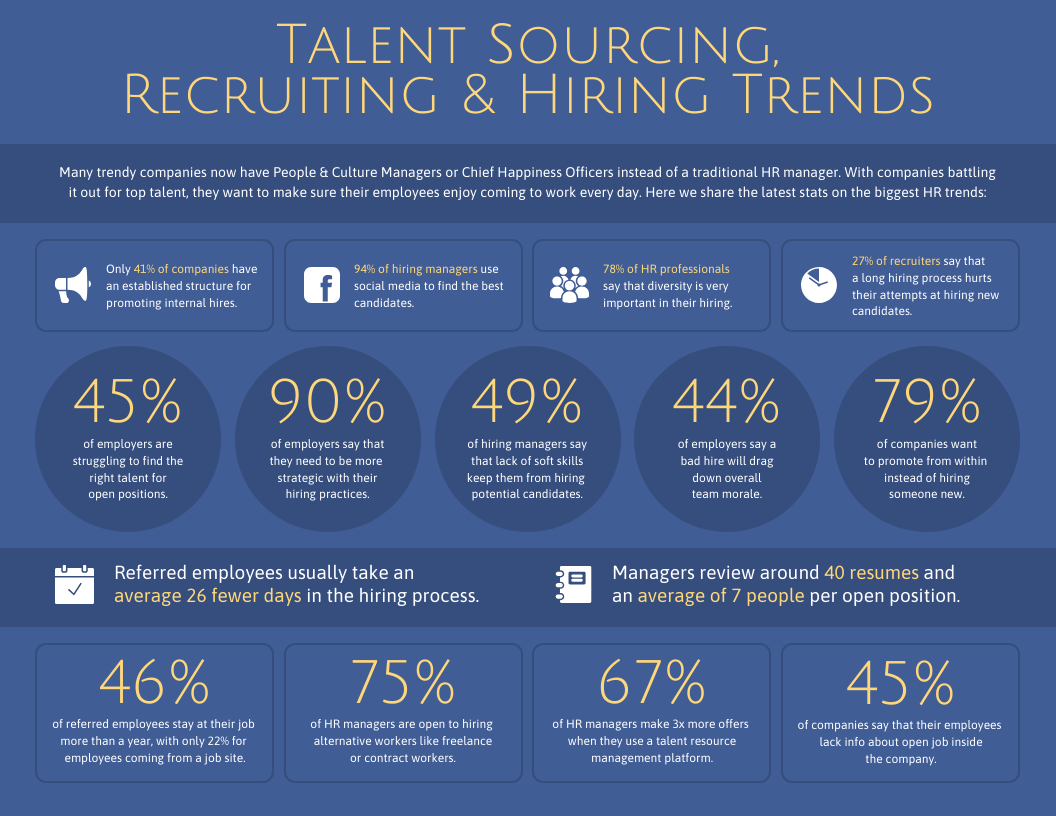
This template provides a clear and concise overview of your recruiting performance and how they sync with overarching company goals. When you add your data here, you’ll create a powerful visual representation of your team’s progress and strategic direction.
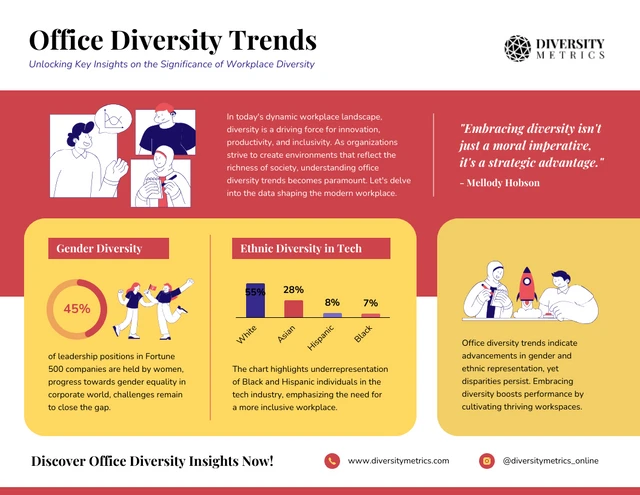
Workforce demographics and diversity
Diversity isn’t just a checkbox; it’s a catalyst for greatness. A melting pot of ideas, experiences and perspectives creates an environment where innovation thrives.
When everyone feels seen and heard, there is a strong sense of belonging, leading to happier, more engaged employees. After all, different minds equals different solutions and that’s a recipe for success.
To create HR policies, training programmes and benefits that serve the needs of various demographic groups, you must be clear on the various aspects of diversity in your workforce including nationality, gender, experience levels and backgrounds.
Leveraging visual aids such as graphs and charts, makes it easy to delve into employee demographics including age, gender, tenure, compensation levels and other pertinent factors to get management’s approval on inclusive policies and benefits.
Here is a template that highlights what diversity in the workplace looks like based on industry and gender. Customize it to highlight the diversity trends in your office.
Learning and development
As per Korn Ferry’s Talent Acquisition Report (2024), 76% of Gen Z employees see learning and development as a key driver of work engagement. Expectations from HR teams rise in terms of making employees feel supported in their overall well-being and fostering healthy work-life integration. In-house certifications, wellness apps and access to counseling are some of the most desirable development programs to young employees.
Only when management is made aware of these changing trends, can they give HR teams the tools and budgets they need to bolster career and training resources.
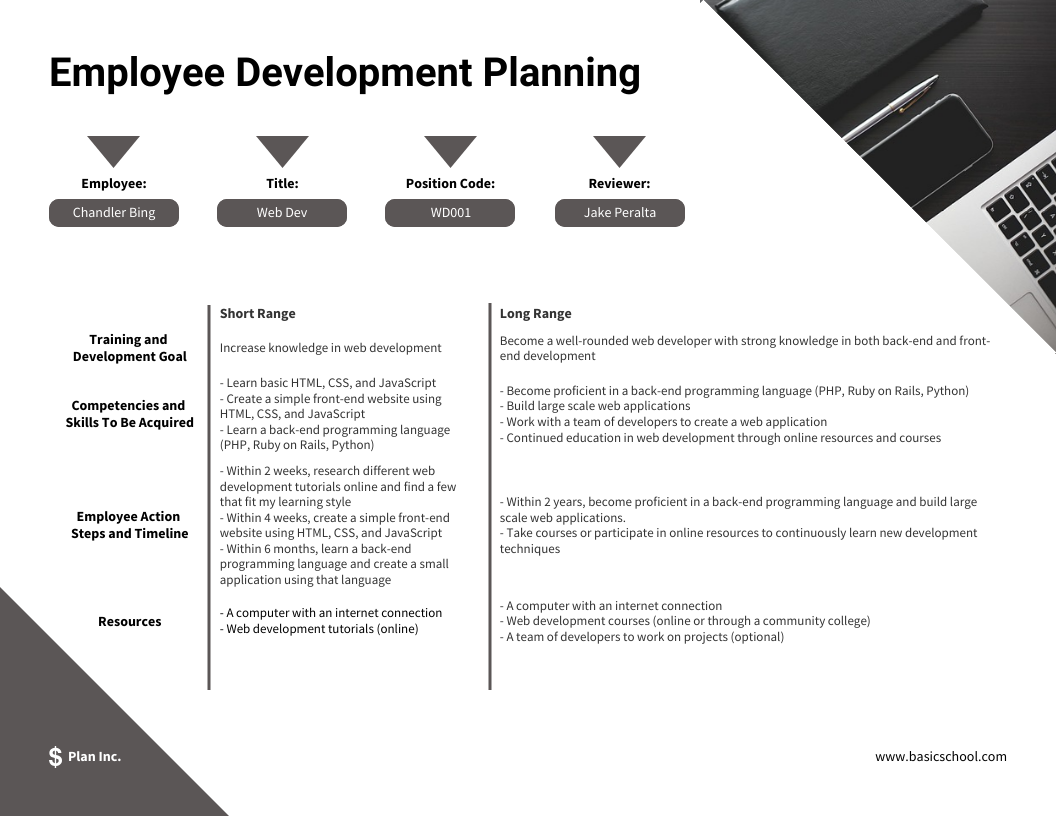
You can easily highlight the benefits of a proposed training model to effectively communicate its benefits to leadership, as seen in the employee training software template below.

Learning and development metrics help HR executives justify training budgets, optimize program design and showcase the positive impact of employee development on overall organizational performance.
Performance management
Employee growth can take place only when there is regular feedback and evaluation by managers. Key HR metrics such as performance appraisal ratings and goal attainment rates are essential for assessing employee performance against set goals.
They help track the success of individuals and teams in reaching their objectives.
With these insights, HR teams can identify areas of strength and weaknesses for each department and present strategies to management to support the workforce accordingly.
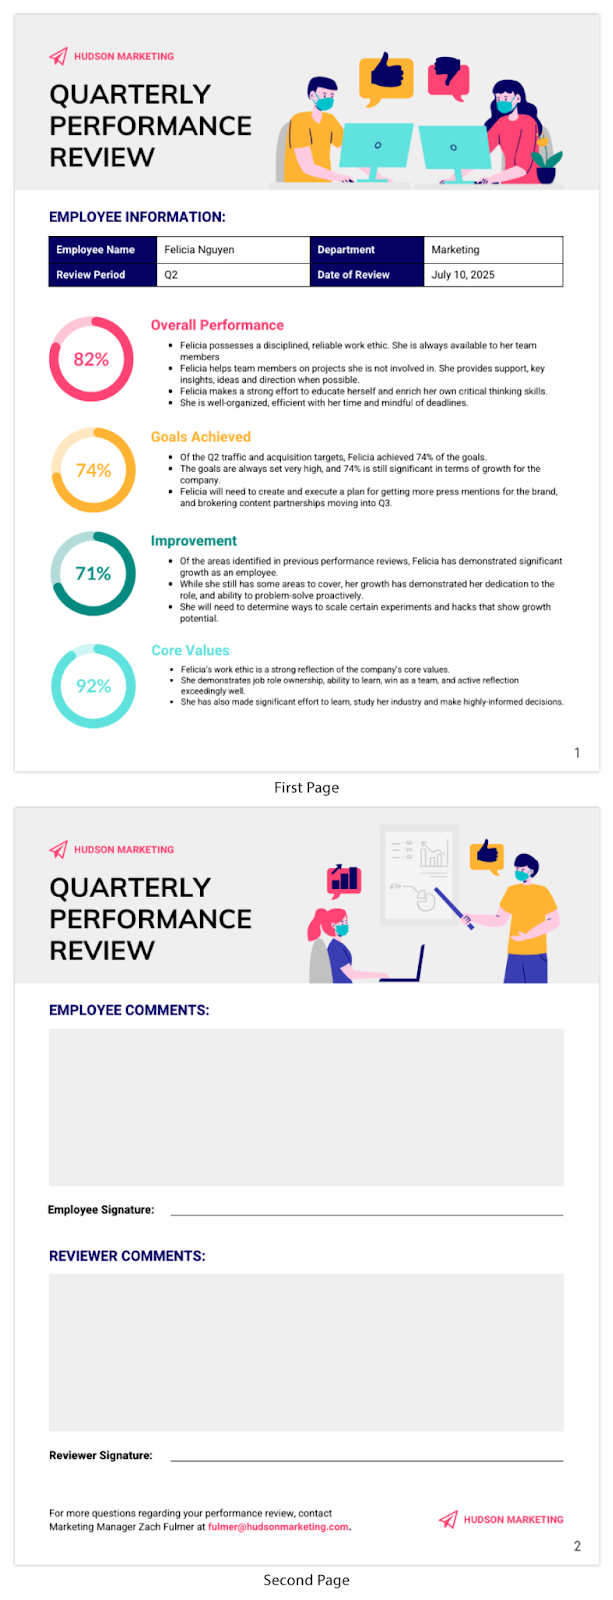
Many HR teams also adopt the 360-degree feedback approach to share a well-rounded perspective on performance by incorporating insights from various sources, allowing for comprehensive and actionable feedback.
Use the following performance review template to effectively share your findings with leadership:

Best practices for creating impactful HR reports
Creating effective HR reports needs a strategic approach. To maximize impact, follow these best practices.
Start with a clear goal
Get clarity on the purpose of your report and your target audience. This way you can ensure your report format aligns with their specific needs. For instance, if you’re creating a report on training program completion, a pie chart is a good way to show the completion rates of different departments.
Management executives are usually pressed for time and will appreciate how quickly they can review pie charts to make changes in future training initiatives or budgets.
Choose the right visuals
Use charts, graphs, or infographics that effectively convey your findings. The right visuals enhance the impact of your message and make it easy to understand for your audience.
Choose a bar chart to show performance ratings across different teams over a complex heat map. Keep it simple, to enhance the impact of your findings.
Keep it simple and focused
Avoid clutter by focusing on the most important insights. Less is more here. Use simple visuals and minimal text to ensure the report remains neat. Highlight key data points that support your report’s goal.
Let data tell your story
Spotify’s iconic ‘Spotify Wrapped’ which presented the musical journey of users, is proof of the true impact of storytelling through data. The dynamic presentation and design came together to create an unforgettable narrative. While this campaign was for customers and not internal stakeholders, the emotional impact it created and the resulting virality is something to take inspiration from.
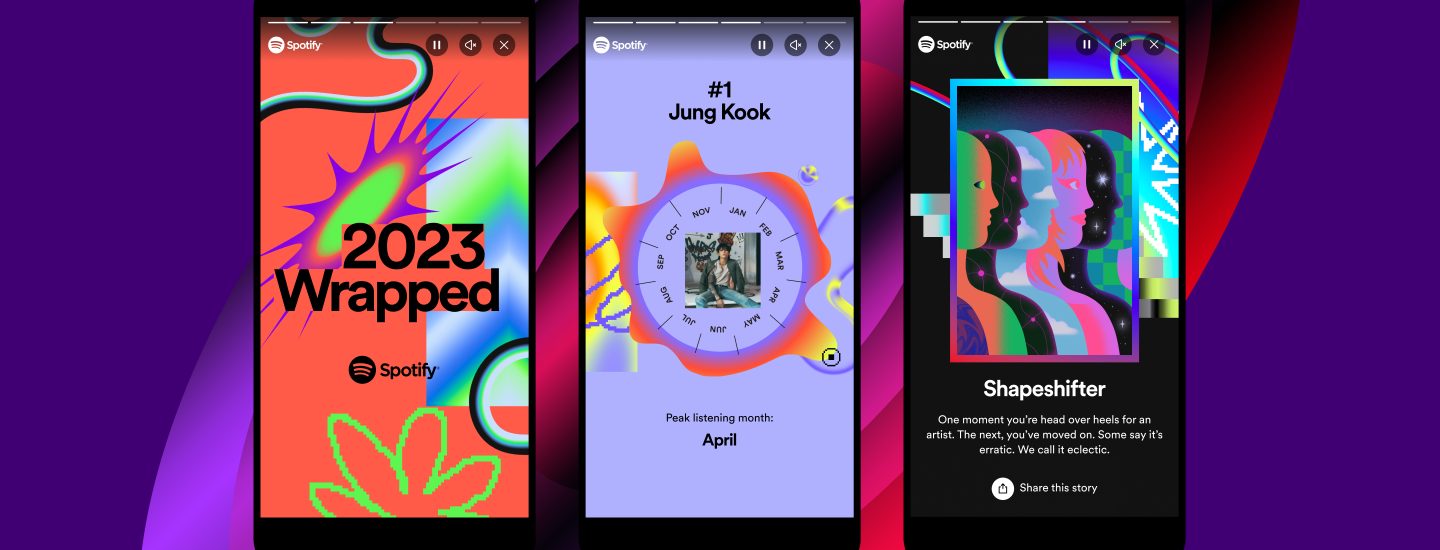
Source: Spotify Newsroom
Companies that rely on data management tools for decisions making are 58% more likely to surpass their revenue goals than those who don’t use data to make decisions. Highlight trends, patterns and correlations in your report to provide context and meaning to make your information memorable.
Brand your reports
Having a common purpose on an organizational level is key to better performance and a stronger culture. Customize your reports to align with your company’s brand. Use your organization’s colors, fonts and logos to create a professional report. The presence of branding elements adds credibility to your report and reinforces brand identity.
Elevate HR reporting with visual reports
Human resource (HR) departments have undergone a dramatic transformation since their inception in the early 1900s. Once primarily focused on administrative tasks, HR now wields significant influence over business outcomes. Today, HR is a strategic component in driving business impact.
Traditional HR reporting methods often fall short in effectively communicating critical HR data.
Visual reports empower stakeholders to understand complex HR metrics, identify trends and make data-driven decisions that impact staffing, recruitment, employee engagement and resource allocation.
This shift will allow you to effectively communicate the value of your work to leadership, optimize talent management and ultimately improve business performance.
Venngage empowers HR professionals like yourself with the tools to take control of your reporting and effectively communicate your value to leadership. With an intuitive interface, customizable templates, diverse visualization options and collaboration capabilities, you’ll be able to create impactful, crisp HR reports with ease.
Remember to choose visual formats that align with management’s preferences and effectively communicate to busy C-suite executives. Try the free HR report templates by Venngage and make your next report stand out.


