
Visuals do more than add flair — they can transform complex information into something clear and memorable.
Using flowcharts is a common way for business professionals to simplify a series of steps or concepts into a simple visual journey. From explaining an employee onboarding process to mapping out customer journey maps, flowcharts are great for clearly communicating your message.
But if you are trying to create a flowchart in PowerPoint, I wish you all the patience in the world. You’ll need it. If you have already tried it, you know how frustrating it is to deal with PowerPoint’s clunky shapes, lack of customization options and tricky formatting.
But don’t worry. In this guide, I’ll help you skip the headaches of creating a flowchart in PowerPoint. We will go over three easy-to-follow methods — including how to use flowchart templates to save time — and discuss the easiest way in detail so that you can create great-looking flowcharts without any hassles.
Click to jump ahead:
- How to make a flowchart in PowerPoint using simple methods
- Method 1: Create a flowchart with SmartArt graphics
- Method 2: Create a flowchart from scratch using the Shape Library
- Method 3: Use flowchart templates
- How to edit and customize your flowchart in PowerPoint
- Bonus: How to make a flowchart in Venngage?
How to make a flowchart in PowerPoint using simple methods
Creating a flowchart in PowerPoint doesn’t have to feel like assembling a rocket — especially if you know which tools to use.
Here are three simple methods, each with its pros and cons, so that you can decide which one you want to use.
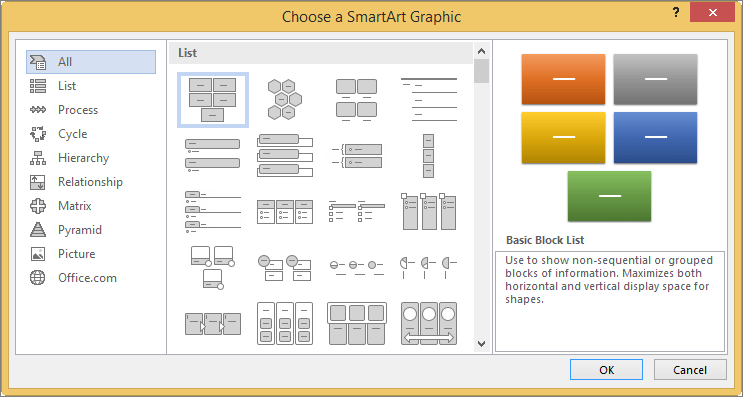
Using SmartArt graphics: If you need a flowchart quickly, the SmartArt graphics within PowerPoint are a great start. They are ready-made designs that make designing a flowchart a breeze. However, they are limited in terms of flexibility and may not suit complex layouts.
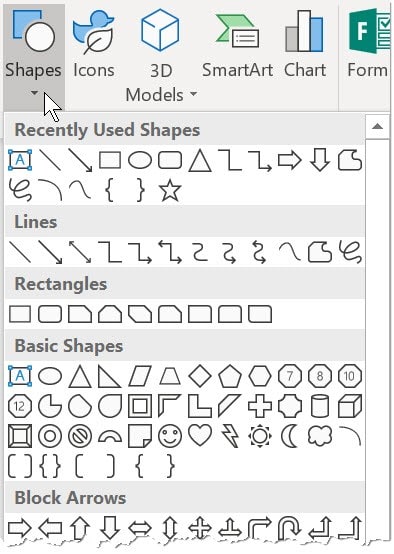
Using the Shapes library: For those who want total control, the Shapes library is the way to go. You can build every part of your flowchart or customize shapes, sizes and connectors exactly as you like. This method takes longer but allows endless customization for specific use cases.
Using Templates: If time is tight and you need a polished look, you can always use pre-made flowchart templates. They offer consistency and save time, although they may feel restrictive if you want a unique look.
Next, let’s go into detail with each of these three methods step-by-step.
Method 1: Create a flowchart with SmartArt graphics
If you are a beginner or pressed for time, SmartArt graphics in PowerPoint offer a user-friendly way to create flowcharts quickly. Here’s how to create flowcharts with SmartArt graphics.
Insert a SmartArt Graphic:
- Go to the Insert menu and select SmartArt to open the SmartArt graphic dialog box.
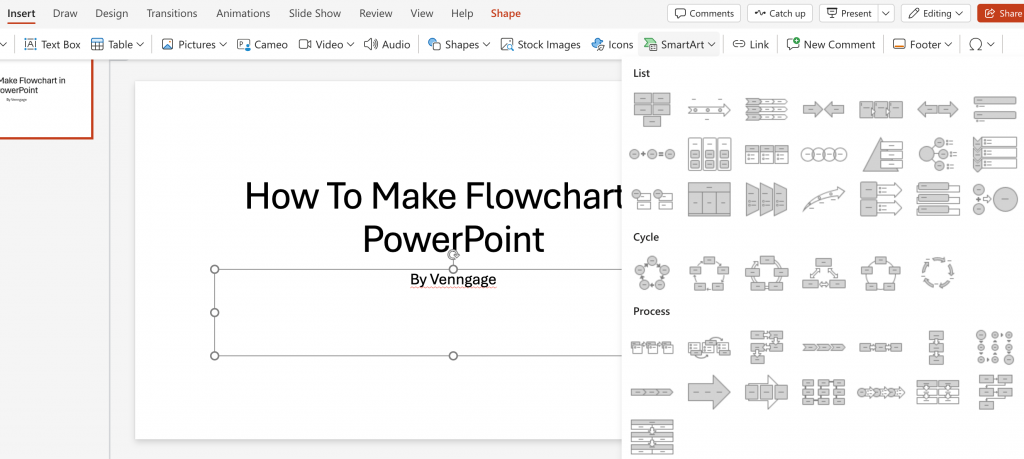
- From here, choose a diagram type that suits your flowchart needs. Options include categories like List, Cycle, Process, Hierarchy or Timeline.
- Next, click inside any SmartArt shape to add your text.
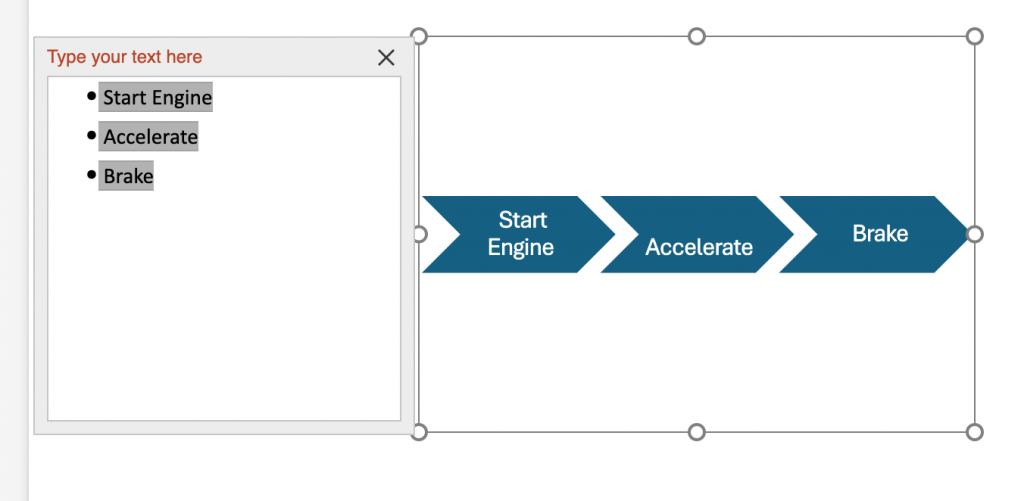
- To customize your flowchart’s colors and styles, go to the SmartArt tab and select Change Colors to adjust the overall color scheme.
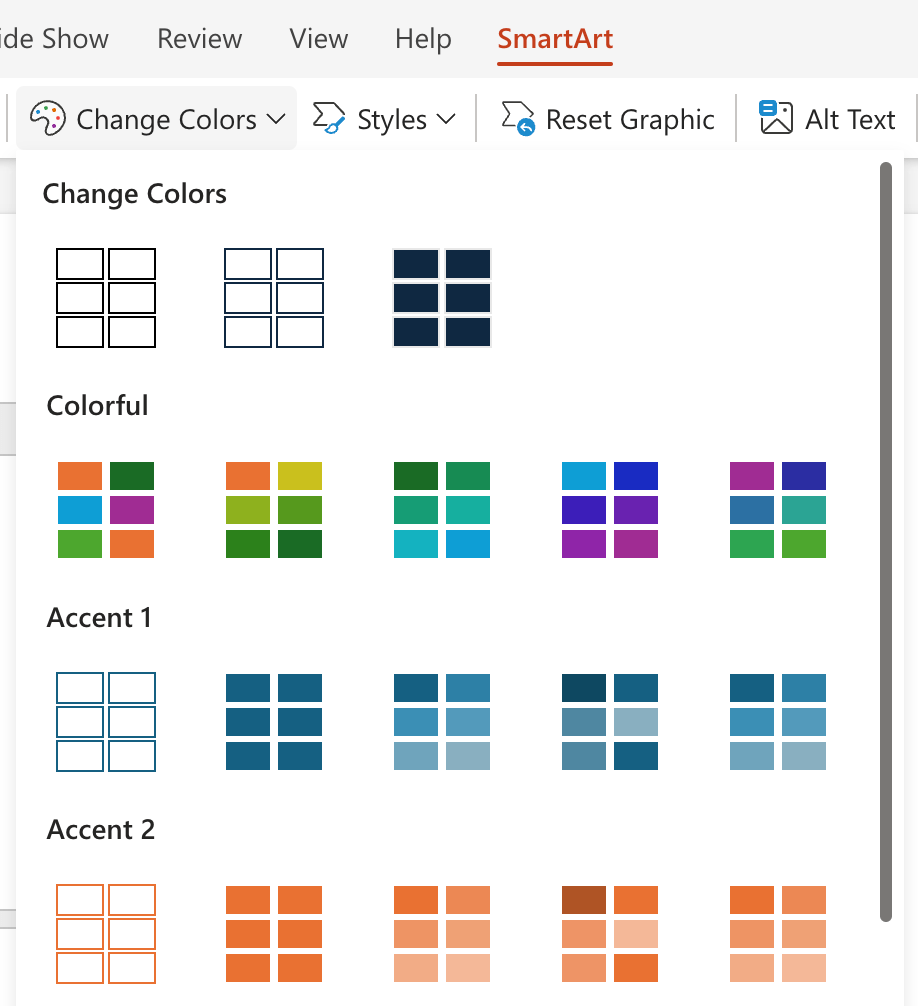
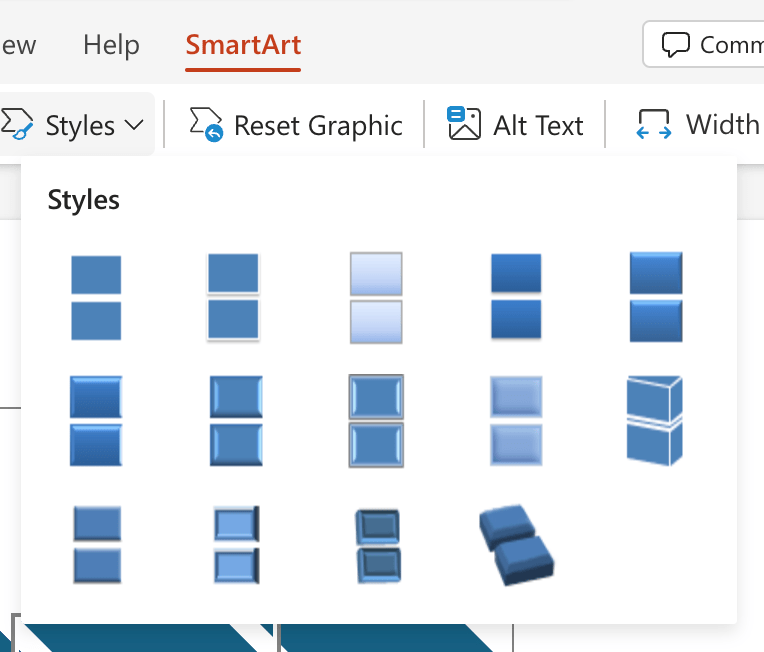
- For more customization options, you can also pick a style from various SmartArt Styles. Here, you can change an individual shape’s fills, adjust fonts or apply effects to make your flowchart visually appealing.
Pros and cons of using SmartArt for flowcharts
Sure, SmartArt graphics are great for quickly slapping together a flowchart, but speed often comes at the expense of quality. SmartArt has limitations when it comes to customization since it doesn’t include unique shapes or designs.
“SmartArt designs are usually worse than having a slide that is just really well-designed text.”
– Echo Rivera, PowerPoint and Data Visualization expert
If you want more flexibility and professional-looking flowcharts, consider using Venngage’s flowchart templates that can better meet your specific needs.
Method 2: Create a flowchart from scratch using the Shapes library
Creating a flowchart using the Shapes library gives you better control over your design. This method provides more customizations and precise flowchart designs that you can tailor to your specific needs.
Here’s the step-by-step process on how to create a flowchart in PowerPoint using the Shapes library.
To insert Shapes:
- Click on the Insert tab, select Shapes and scroll to the Flowchart section to find relevant options.
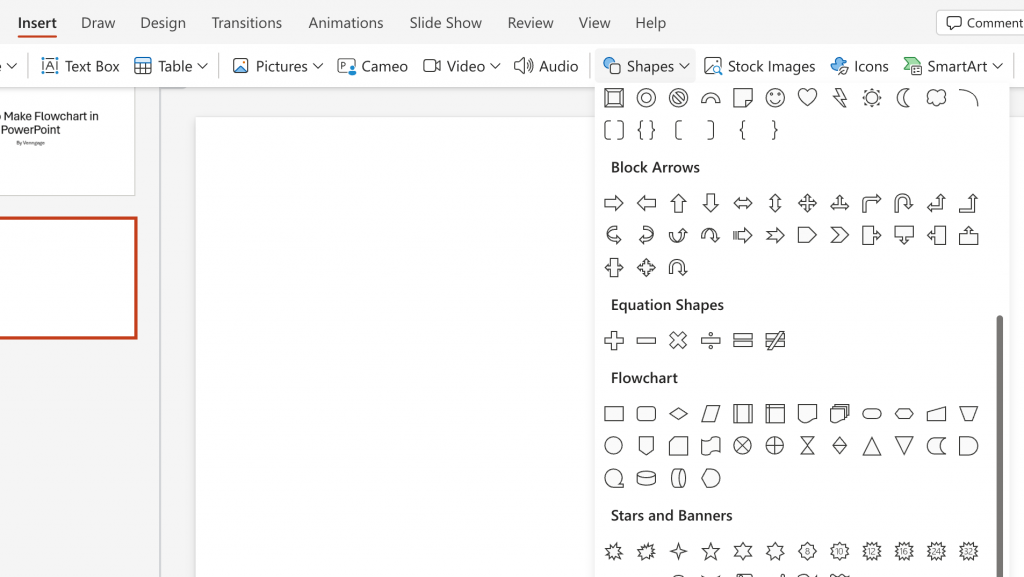
- Choose the right shapes, such as rectangles for process steps, diamonds for decisions and ovals for start or end points.
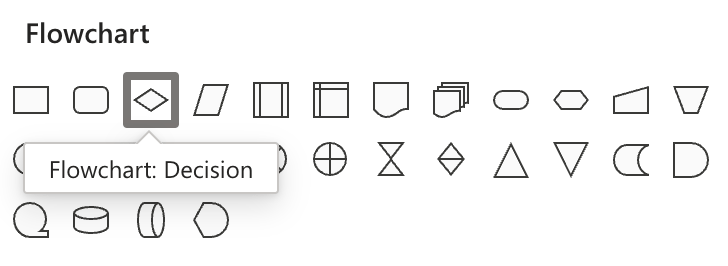
- Click and drag your mouse to draw shapes on the slide, positioning them to represent the logical flow of your process.

To connect the shapes with Lines:
- Click on Insert > Shapes and select an arrow from the Lines section.
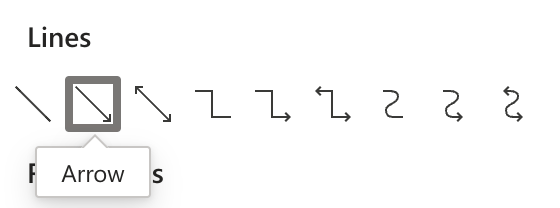
- Use the arrows to connect the shapes by positioning them between the shapes to indicate the direction of the process flow.

To label Shapes and Lines:
- Click on a shape and type directly to label it.
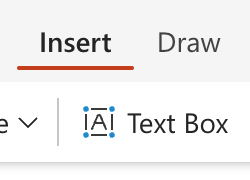
- Click on Insert > Text Box, draw a text box near the arrow. Type in labels to give your flowchart and its shapes clarity.
For advanced customization:
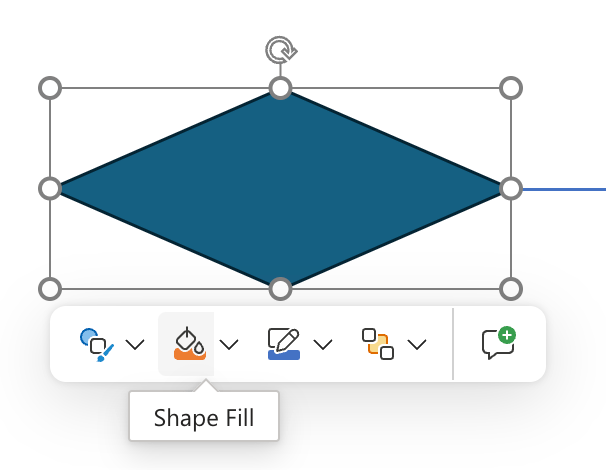
- Click on any shape in the slide to access customization options.
- Use the options to adjust colors, line weights, transparency and other styling details, giving your flowchart a polished finish.
Pros and cons of using Shapes library for flowcharts
Starting from scratch means you have the freedom to shape your flowchart exactly as you envision it. In that sense, using the Shapes library to create a flowchart in PowerPoint lets you add a personalized brand touch.
But while this flexibility is great, playing around with shapes requires a lot of time commitment and attention to detail. If you aren’t a designer who can’t be bothered to make your presentations pretty, this method can be cumbersome.
Method 3: Use flowchart templates
In most cases, templates equal efficiency. Flowchart templates can help you design amazing flowcharts by letting you choose from hundreds of ready-to-use flowchart designs.
Instead of wasting your time and energy wrestling with clunky shapes and inconsistent formatting in PowerPoint, you can access a host of templates that suit your specific needs.
For example, Venngage’s Online Flowchart Maker has a vast selection of templates that come with structured layouts that cater to common business scenarios, ranging from sales processes, bidding strategies, to decision-making frameworks.
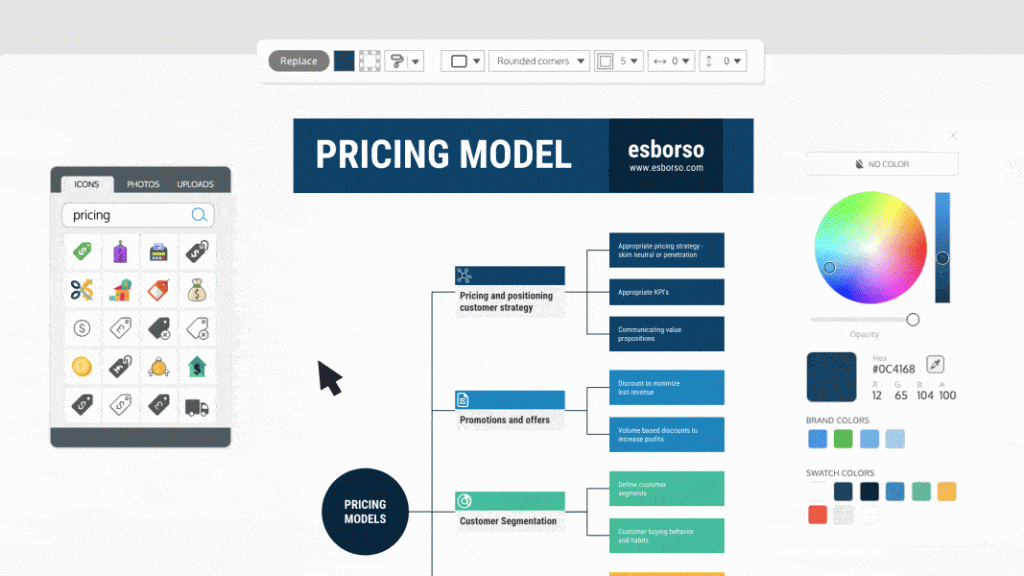
This extensive library allows you to quickly find and adapt a template that meets your flowchart needs and saves you a lot of time.
And the best part? Unlike PowerPoint, Venngage gives you a complete free hand to customize the templates. You can modify colors, shapes and text to suit your branding or personal style — or meet your customers’ expectations.
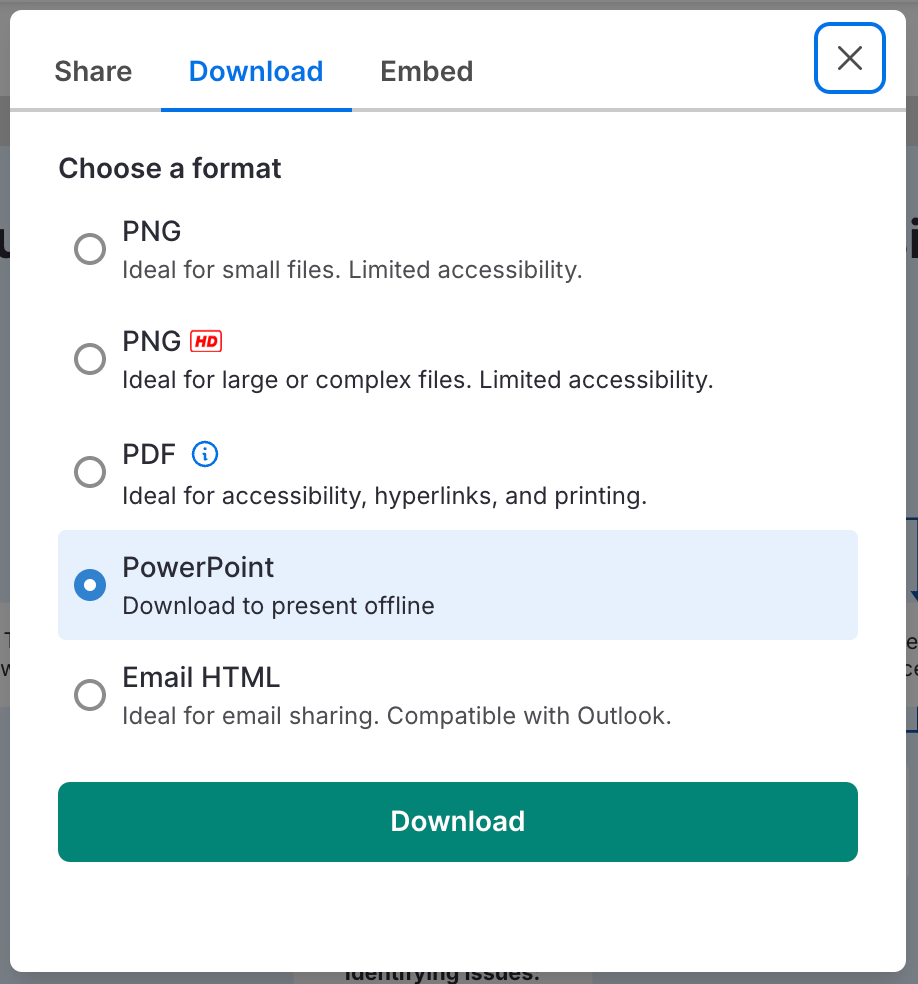
Once you are satisfied with the design, you can download your flowchart as a PowerPoint file for easy presentation integration.
Pros and cons of using pre-design flowchart templates
Using Venngage’s flowchart templates offers a quick way to create flowcharts that feel professional from the start. With its vast templates library, you can find designs tailored to various business scenarios and save time in contrast to creating a flowchart design from scratch. The customization options let you match templates to your brand style or presentation needs effortlessly.
However, using pre-made templates may not be as flexible as building a flowchart from scratch, and advanced design features require a paid account. For the most part, though, Venngage provides an ideal mix of convenience and design flexibility.
How to edit and customize your flowchart in PowerPoint
Customizing your flowchart in PowerPoint allows you to align the presentation style to your brand’s standard, control its look and feel and make the content more engaging for the audience.
In this section, we will revisit some of the steps to customize your flowchart design in PowerPoint, but in more detail. Here are 4 step-by-step instructions on how to customize your flowchart design in PowerPoint:
Adjust colors and styles
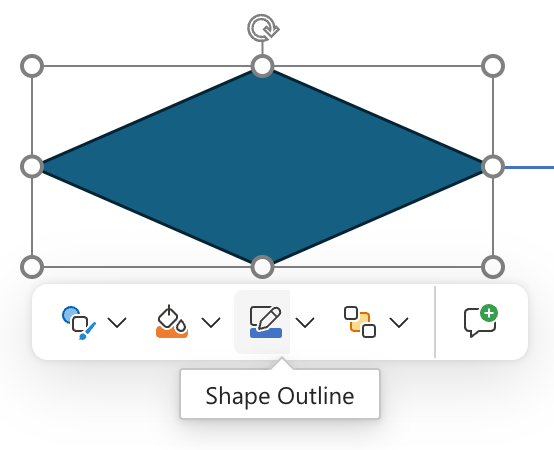
To adjust shape colors and outlines, click on an item on the slide and go to Shape Fill and Shape Outline. You can use a single color palette or a subtle gradient to keep the design cohesive.
To choose a different font, adjust text size, color and type, go to Home> Font. Ensure that you align the text style to ensure readability and maintain a consistent color scheme with the rest of the flowchart design to give it a polished look.

Modify shape properties
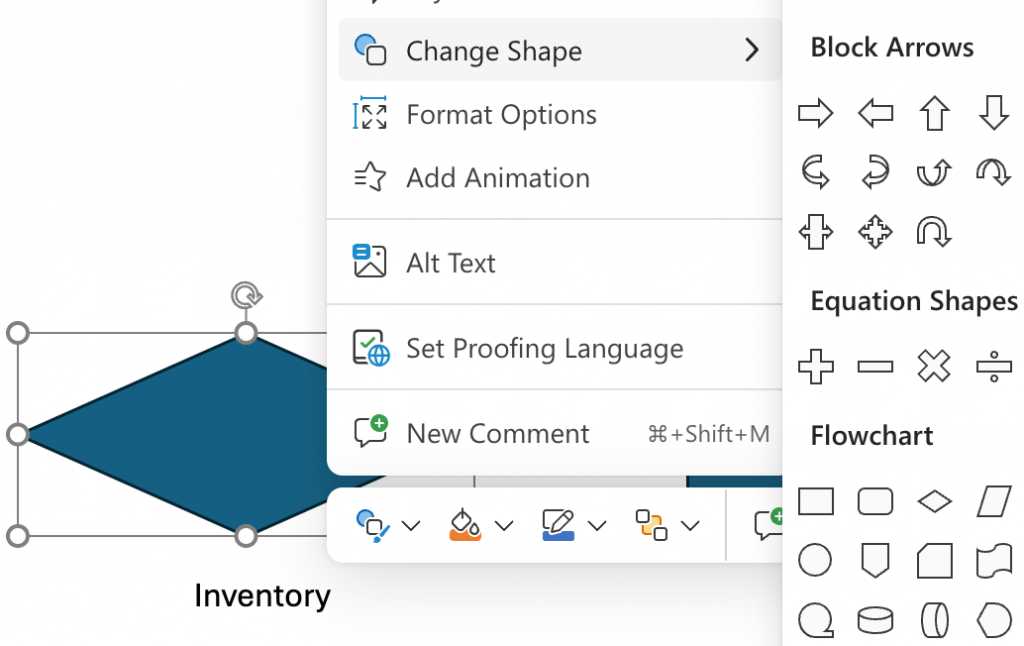
If you need to reshape elements, right-click the shape and select Change Shape. This lets you fine-tune the shapes and create custom layouts. For example, changing rectangular shapes to diamonds can clarify decision points for your audience.
Add icons
Icons are a great way to communicate visually. PowerPoint offers a vast library under Insert > Icons.
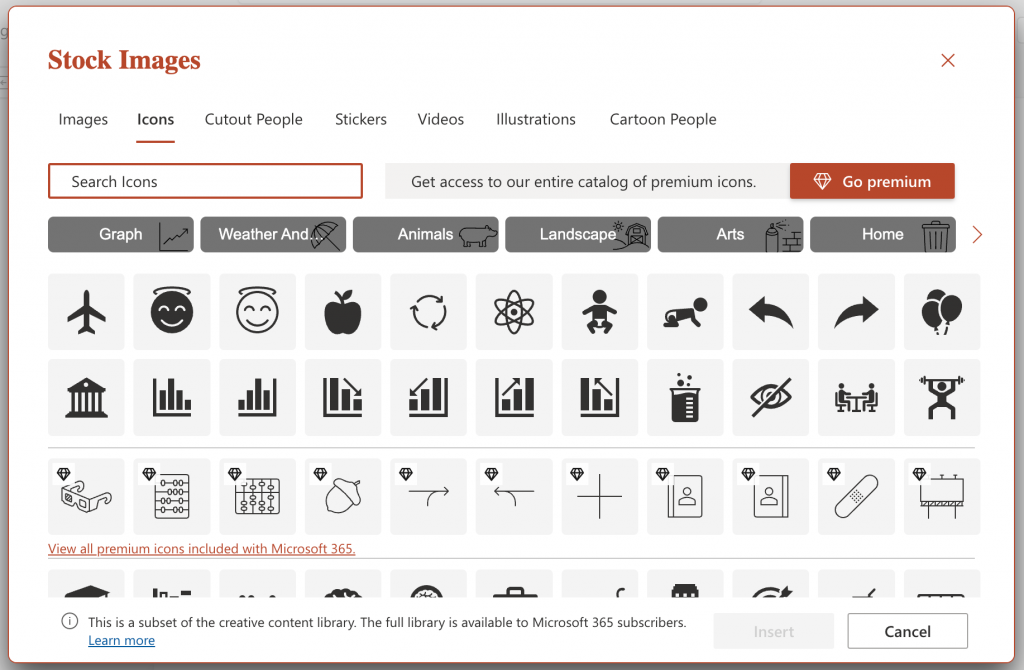
Once you add an icon, you can click on the icon to change its color and match it with your flowchart’s palette.
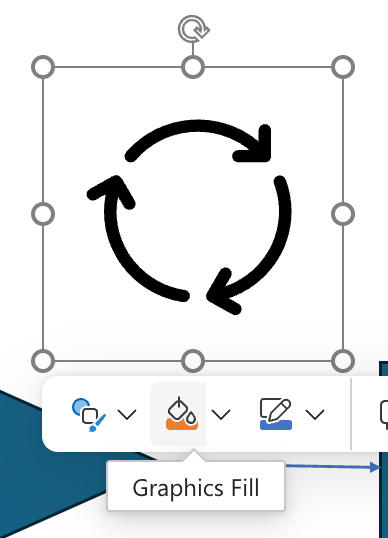
Icons for key stages (like start/end points or decision nodes) can help readers quickly follow the flow.
Animate your flowchart
PowerPoint animations can add flow to your presentation. Go to Animations > Animation Pane to set up animations that reveal each step one at a time.

This keeps your audience engaged and focused on each part of the process. For example, using a simple “fade” effect between steps can create a smooth narrative while presenting.
How to make a flowchart in Venngage?
PowerPoint has limited tools and customization options for flowcharts. It often produces designs that lack visual clarity and polish and makes it harder for you to show complex workflows.
In contrast, Venngage’s flowchart maker offers a variety of templates and customization options for you to create and design flowcharts to meet your needs.
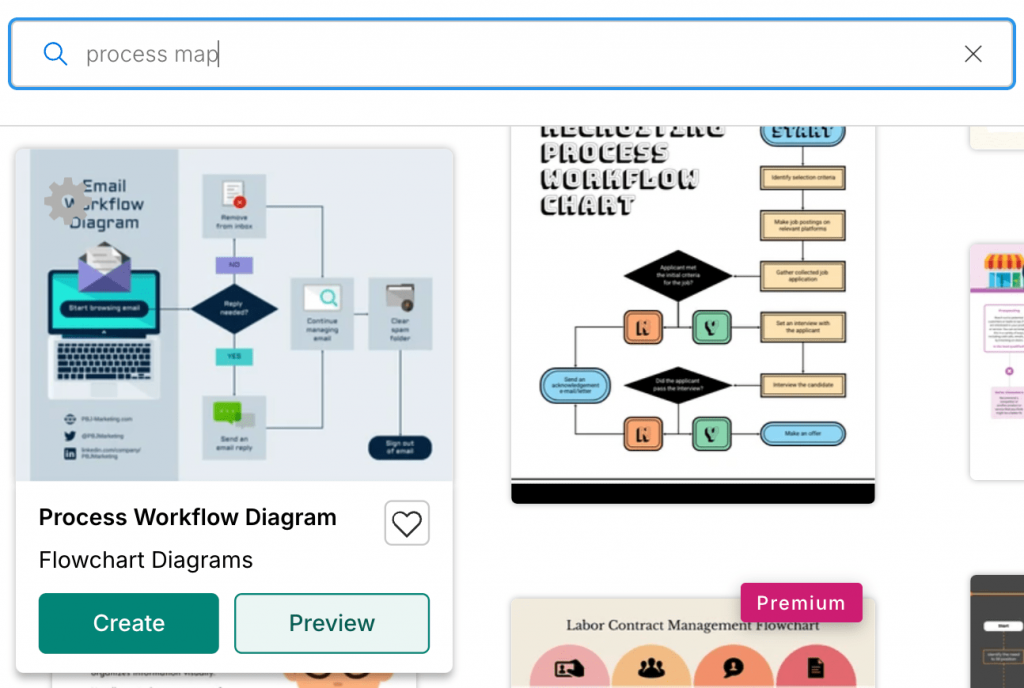
Step 1: Choose a template
Visit Venngage’s Flowchart Templates library and pick a design that fits your project needs, such as templates for process maps or decision trees.
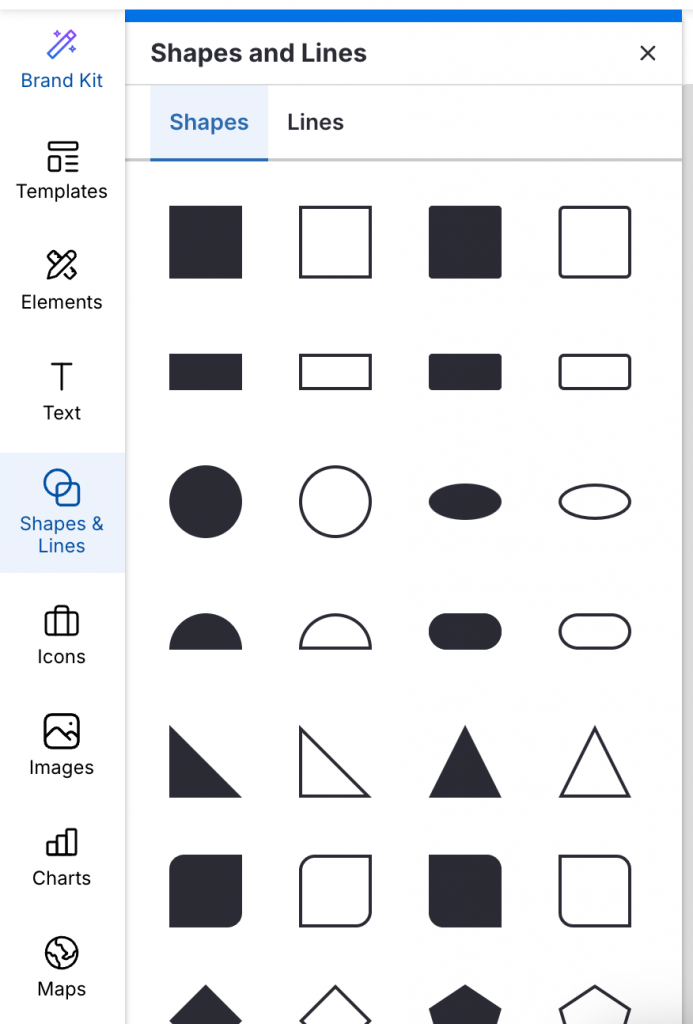
Step 2: Add shapes and lines
Customize the chosen template by inserting shapes and lines from the left-hand toolbar. Select the appropriate shapes (rectangles, diamonds, etc.) to represent each step in your process.
Step 3: Customize text and colors
Click directly on shapes to add text, adjusting fonts, sizes and colors to match your branding. Use the text editor to style content for readability.
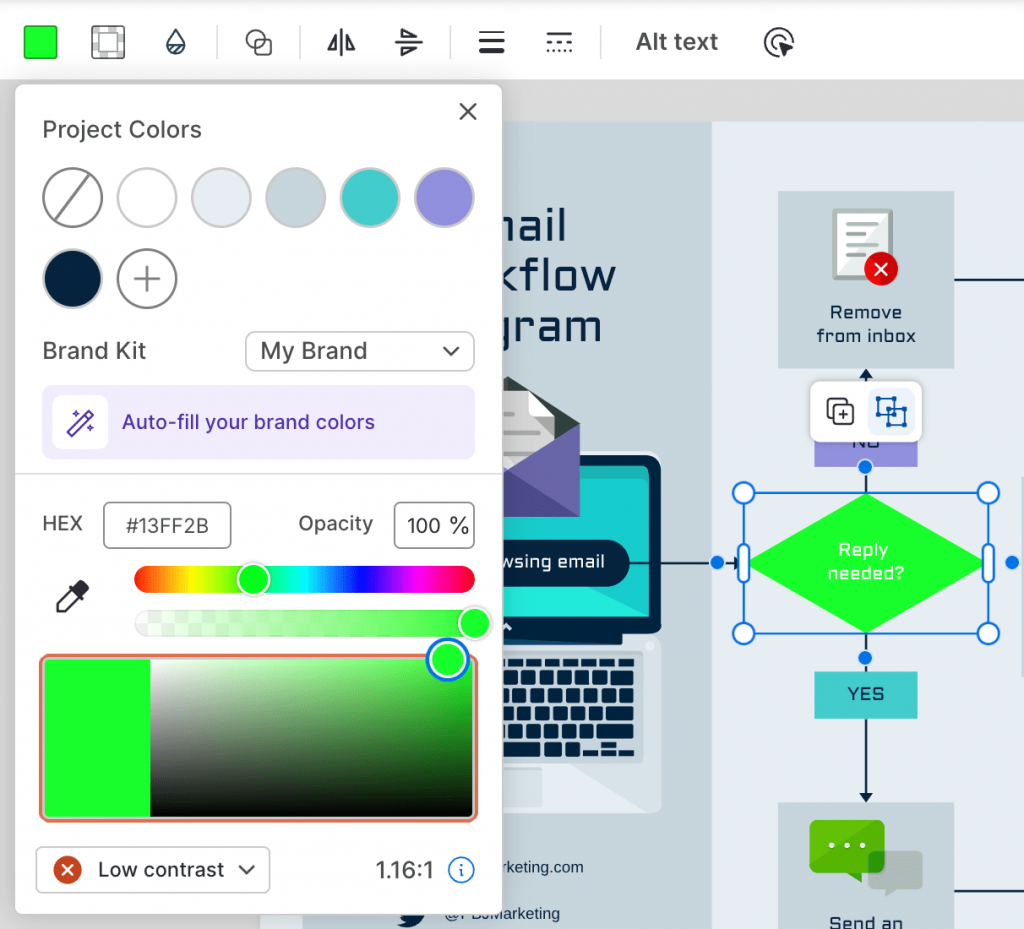
NOTE: As an aside, notice the “Low contrast” warning at the bottom-left of the image? It’s one of Venngage’s proprietary accessibility features that helps you ensure that your designs are readable and compliant with accessibility guidelines like WCAG 2, ADA and AODA.
Step 4: Add icons and visuals
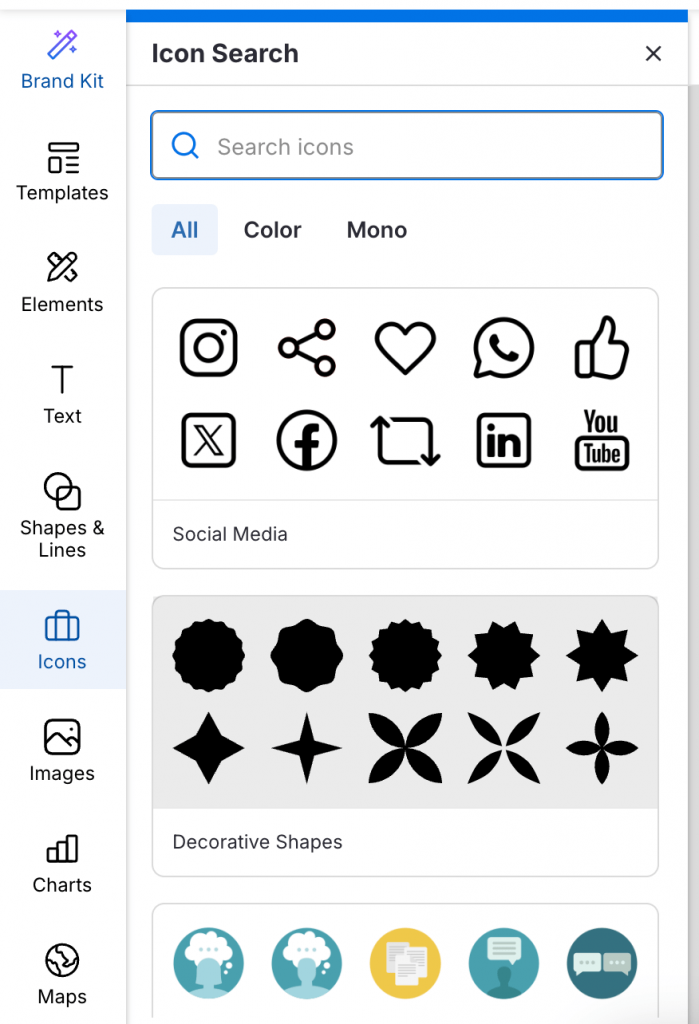
Enhance your flowchart with icons or images by accessing Venngage’s icon library. Icons can help clarify steps visually.
Step 5: Export and share
Once your flowchart is complete, download it as a PowerPoint file or share it digitally.

Bringing your flowcharts to life with Venngage
Creating flowcharts in PowerPoint doesn’t have to be complex. By experimenting with different methods, you can tailor your flowcharts to make your presentations clearer and more engaging.
Flowcharts offer a visual boost that simplifies complex ideas and keeps your audience on track, helping with everything from process visualization to decision-making.
Looking for a faster route with more customization? Try Venngage’s flowchart templates. Sign up for free and create great-looking flowcharts in just a few minutes.


