


Infographics can make your ideas click faster and look a whole lot better.
In this guide, I’ll show you how to create stunning infographics in Google Slides, step by step. It’s an easy way to turn dull data into visuals people actually want to read.
And if you want to skip the setup, try our infographic maker — it comes with free infographic templates so you can start designing in minutes.
Let’s begin, shall we?
Create an infographic in Google Slides in 8 easy steps
To create an Infographic in Google Slides, you can follow these steps:
Step 1: Open Google Slides
Step 2: Set up your page
Step 3: Create your layout
Step 4: Add shapes and design elements
Step 5: Insert text and images
Step 6: Customize your infographic
Step 7: Add data visualizations
Step 8: Final touches
Let’s dive deeper with a step-by-step explanation to help you create an infographic easily with Google Slides.
If you’re also looking to map out processes, check out this guide on how to create a flowchart in Google Slides.
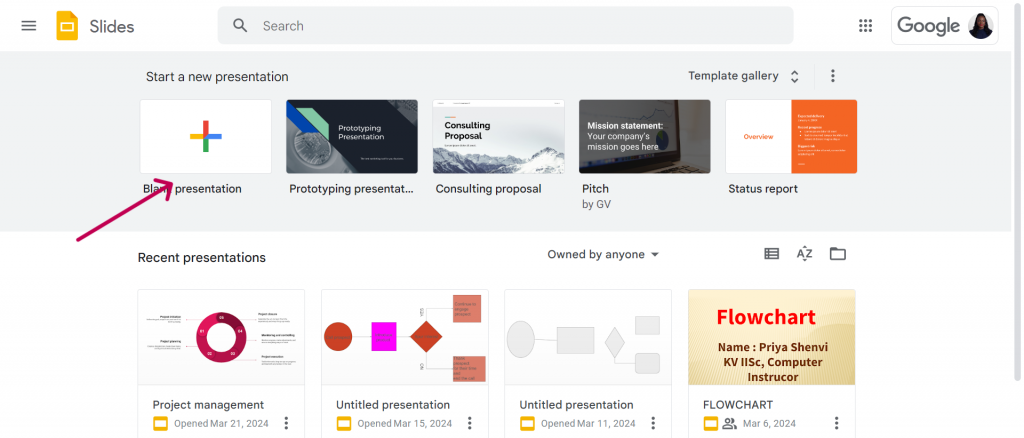
1. Open Google Slides
- Navigate to Google Slides:
- Go toGoogle Slides.
- Click on the Blank option to start a new presentation.
2. Set up your page
You want to be sure you have the correct dimensions and page orientation. It usually sets the pace for how your infographic will turn out.
To set up your page:
- Adjust the page setup:
- Go to File > Page setup.
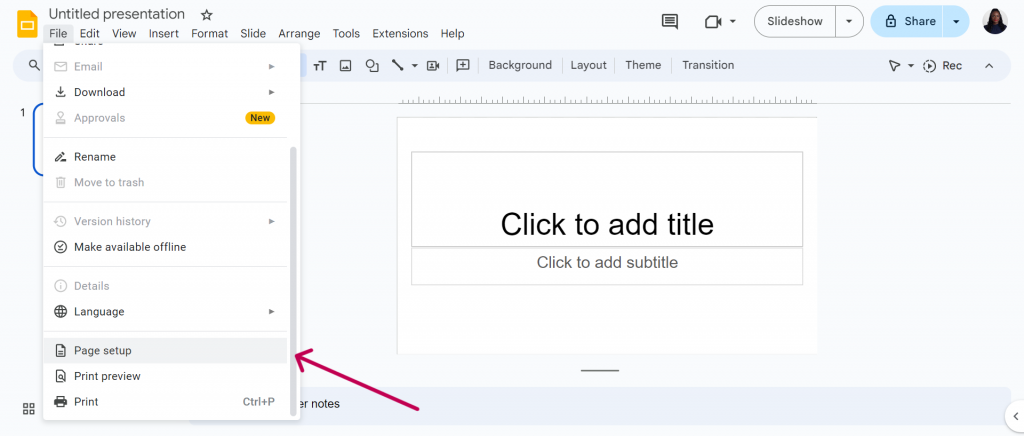
- Select Custom from the drop-down menu.
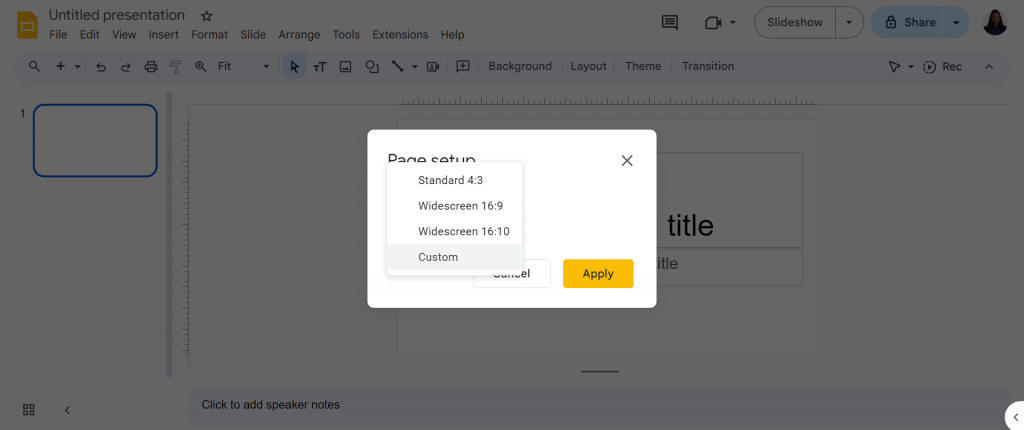
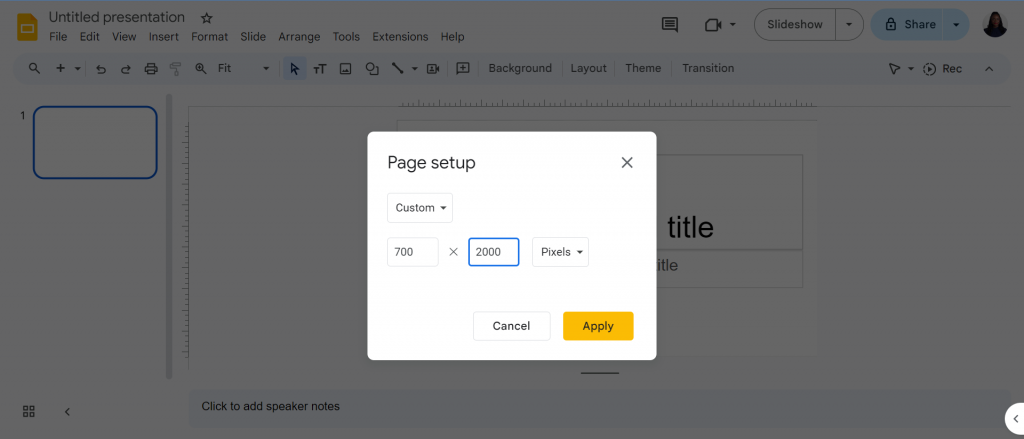
- Change the dimensions to a format suitable for an infographic. Common dimensions are 700 x 2000 pixels.
3. Create your layout
Now that you have gotten the correct dimensions for your infographic, you want to start with a blank sheet. This gives you all the space you need to create the perfect infographic that you need.
To create your layout:
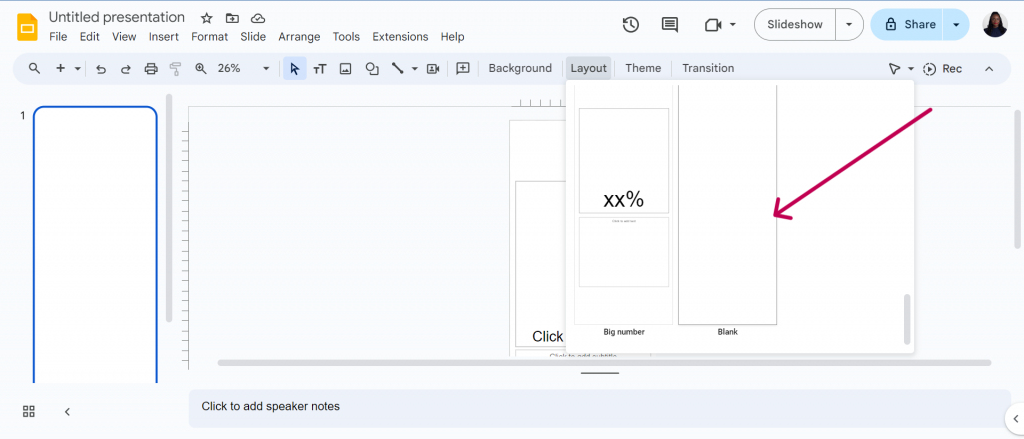
- Change slide layout:
- Click on Layout in the toolbar.
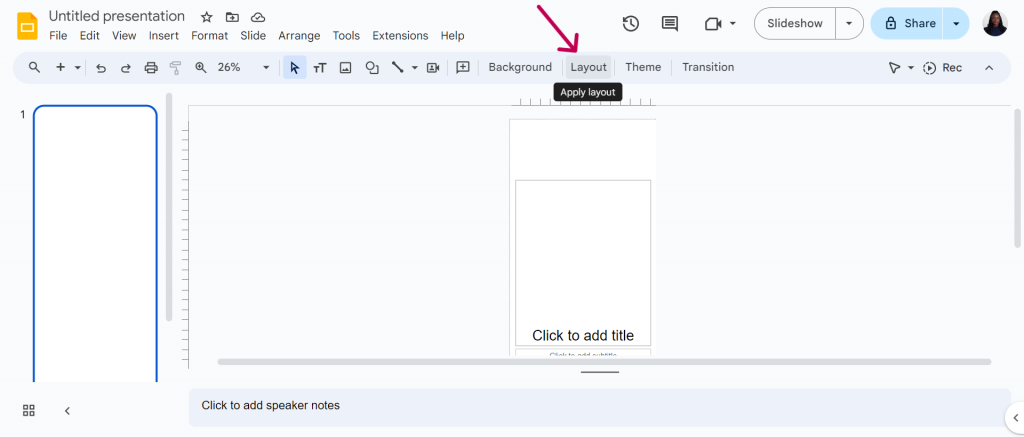
- Select Blank.
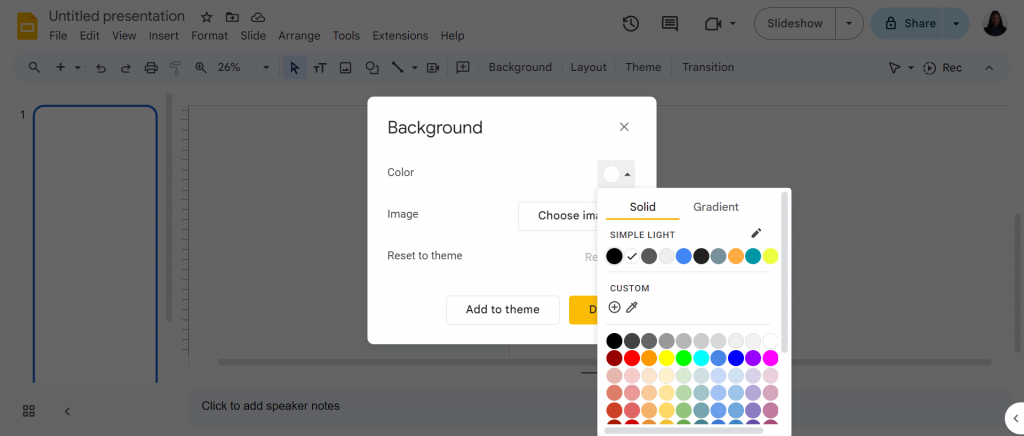
- Add background color:
- Go to Background > Color.
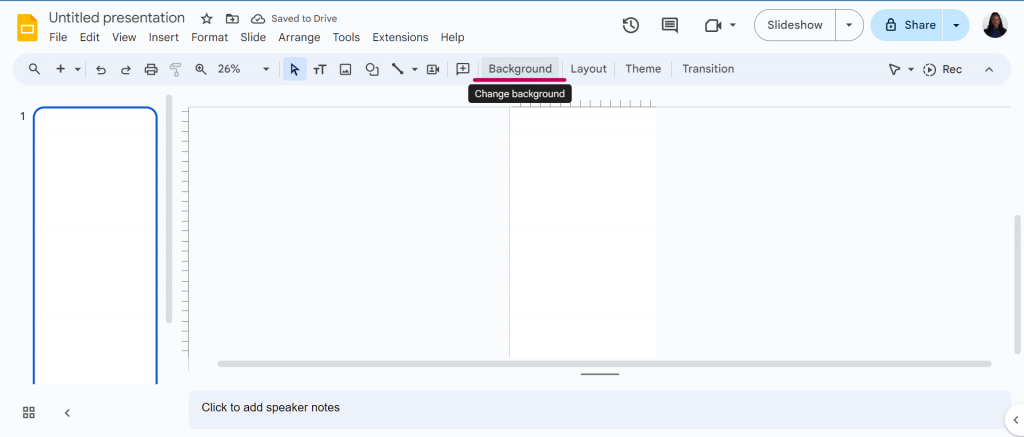
- Choose a color or create a custom color for your background. For this example, I will select the red color.
4. Add shapes and design elements
Now that you have your background and desired color, you can proceed to build your infographic. First, note the kind of infographic you want to create and the shapes you will need.
In Google Slides, there are diverse shapes and tools you can use in creating your infographic. To add shapes and design:
- Insert shapes:
- Use the Shape tool from the toolbar to add rectangles, circles, or other shapes.
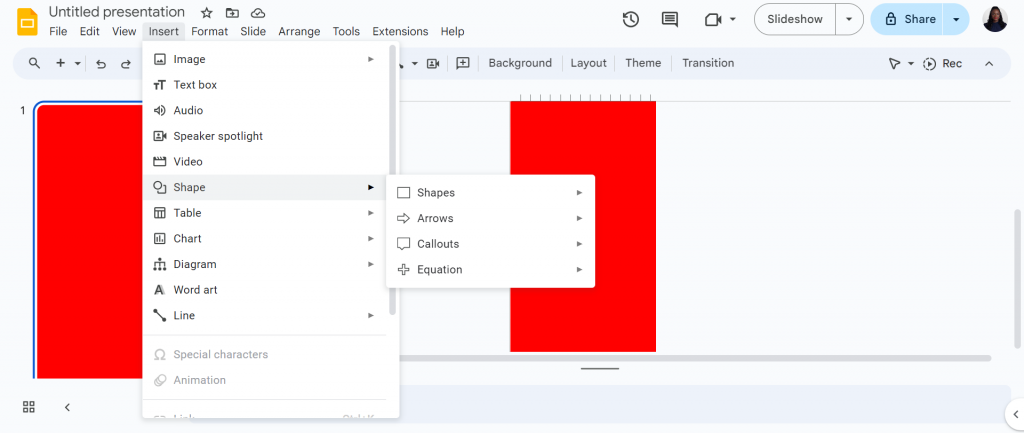
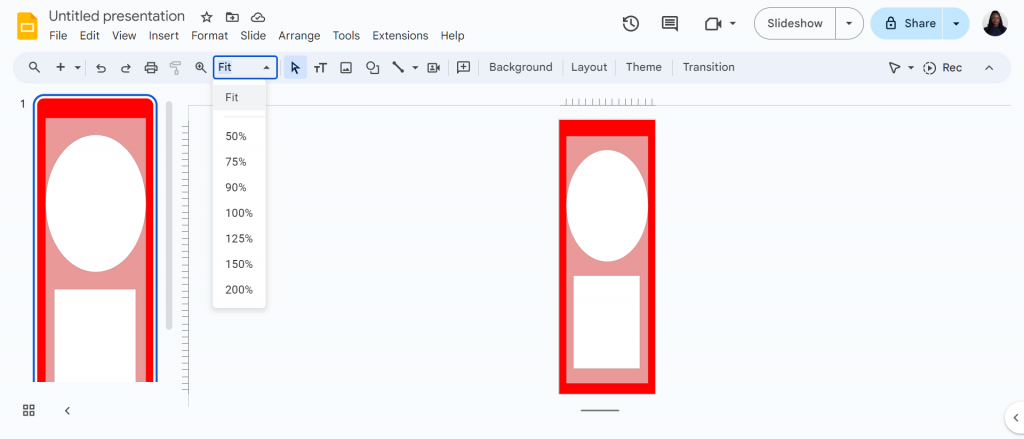
- Arrange these shapes to create sections or segments for your infographic. Pro tip: Change your zoom to Fit to enable you to see your design as a whole.
5. Insert text and images
Here, you can add the texts you want to include in your infographic. Type in your texts, add external images from your computer or Google drive or the web and align accordingly.
To insert texts and images:
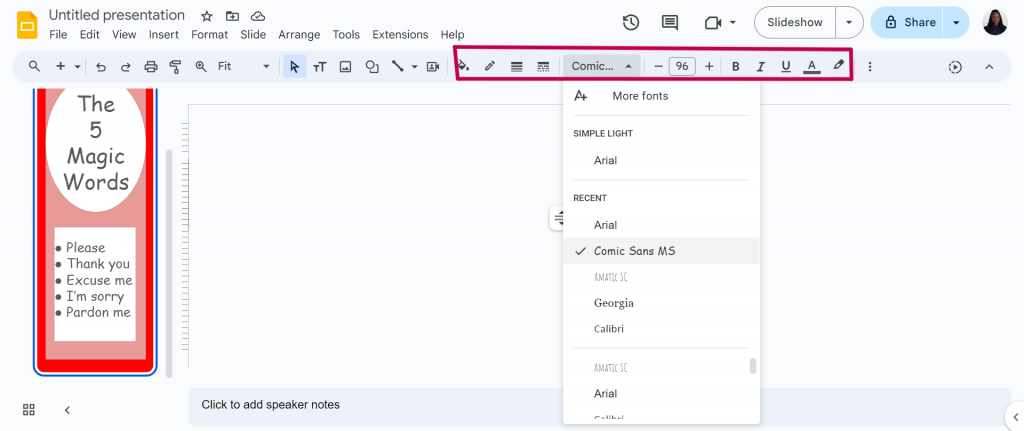
- Add text:
- Click on Insert > Text box.
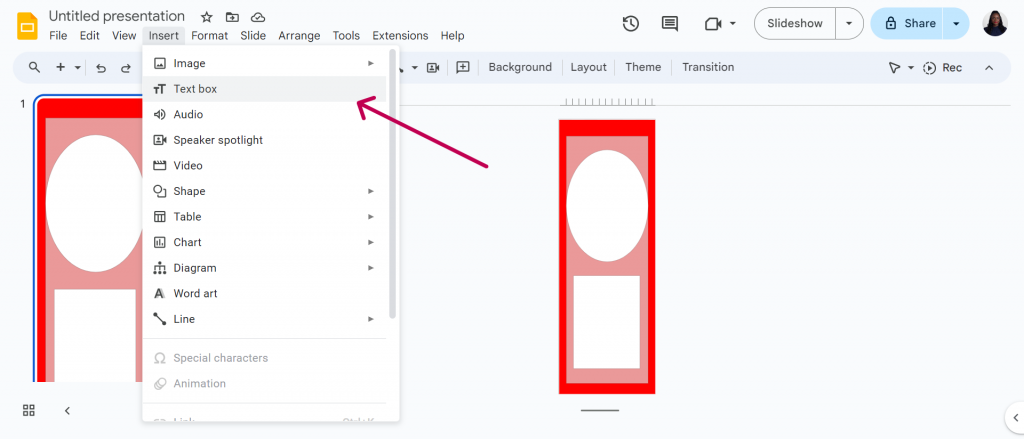
- Click and drag to create a text box. Enter and format your text as needed.
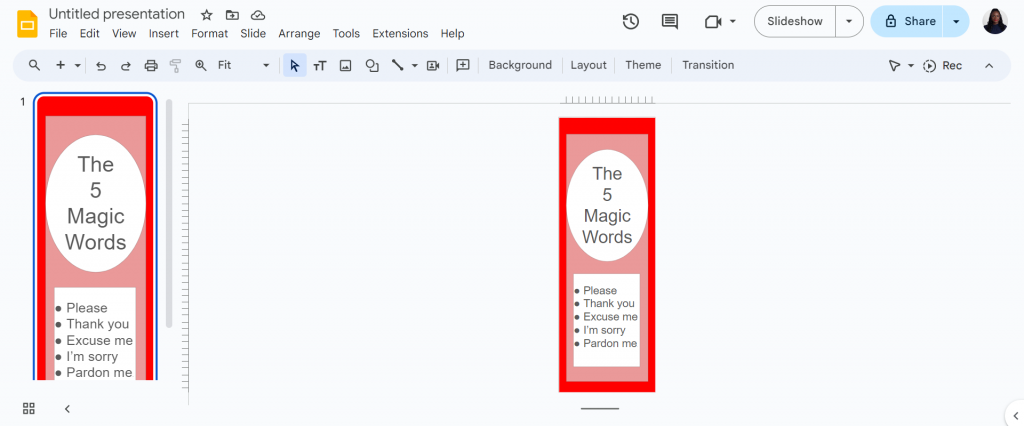
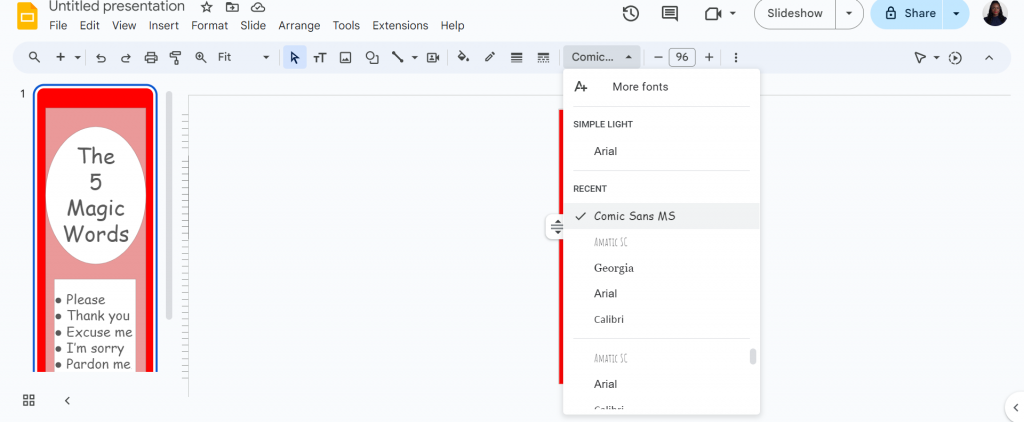
- You can edit the font type and size to suit your taste. To do this, simply navigate the toolbar to see more fonts that you can use.
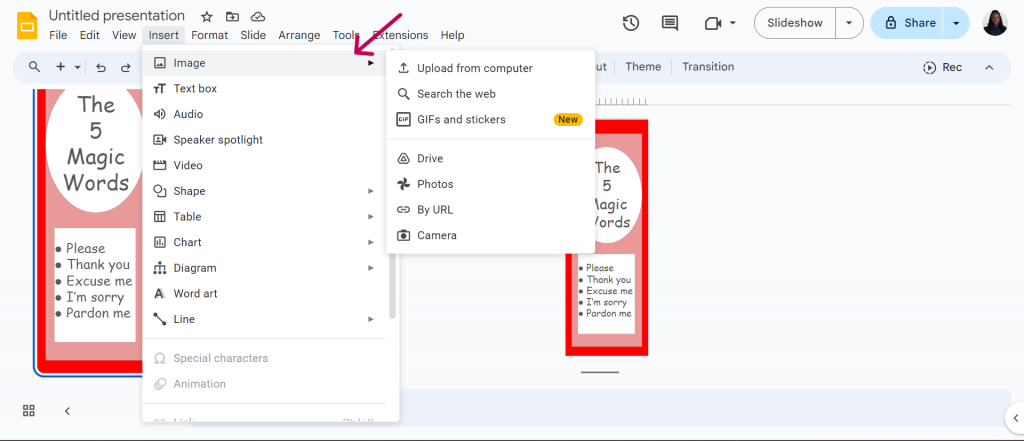
- Add images:
- Go to Insert > Image.
- Choose to upload from your computer, search the web, or use your Google Drive to add images.
6. Customize your infographic
Now that you have the basic frame of your infographic, you can proceed to customize it to your liking. Here, you can edit fonts, font sizes, colors, or icons to ensure readability and consistency.
To customize your infographic:
- Adjust colors and fonts:
- Use the Text color and Font options in the toolbar.
- Use icons and additional graphics:
- Insert icons or additional graphics as needed. You can upload from your computer or search from the web.
7. Add data visualizations
You can add graphs and charts to your infographic, especially if you deal with numbers and research data.
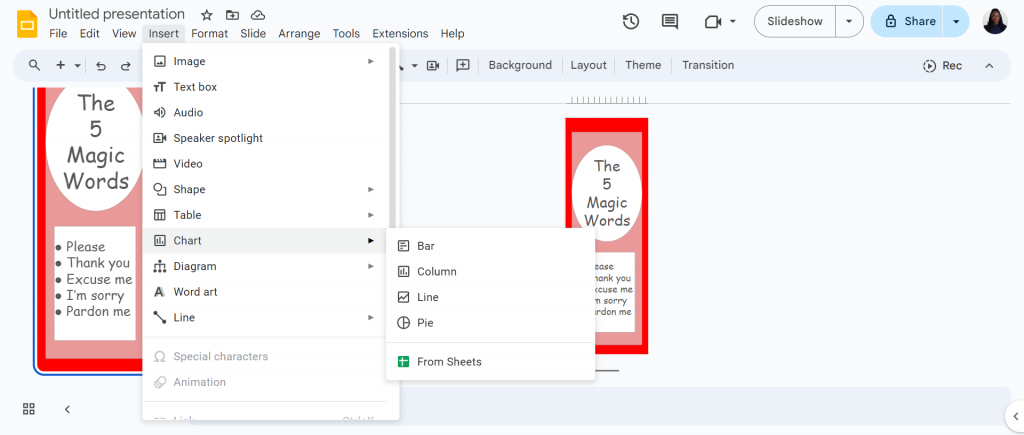
- Insert charts and graphs:
- Go to Insert > Chart.
- Choose from different types of charts such as bar, column, line, or pie charts.
- Customize the charts using the chart editor to fit your data.
8. Final touches
Your infographic is ready for download! Just a few more touches to ensure everything is aligned and looks good, and you’re good to go.
- Review and adjust:
- Ensure all text is readable and the design is visually appealing. Make any necessary adjustments to the layout or content.
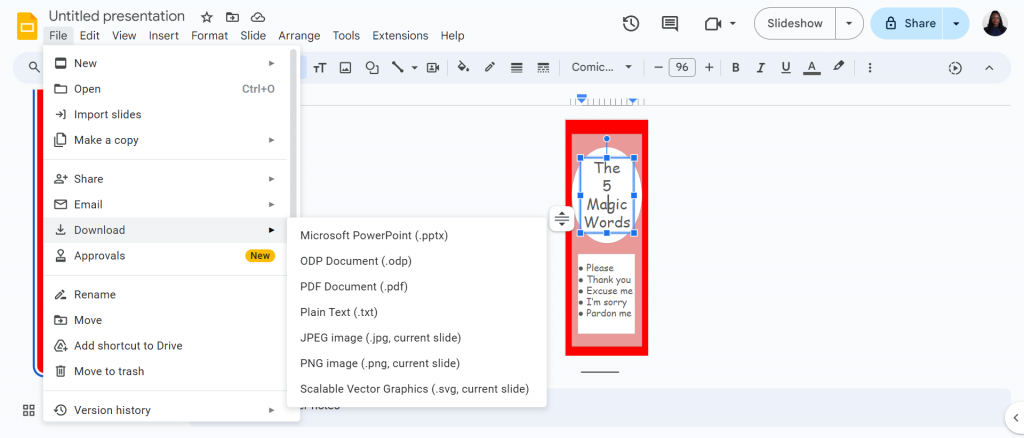
- Download your infographic:
- Once satisfied, download your infographic by going to File > Download and selecting a format like PNG or PDF.
Want to take your designs even further? Check out how Google Forms can enhance your infographic templates.
How to make infographics in Venngage?
Venngage offers thousands of pre-made infographic templates that you can choose from to create professional looking infographics in minutes! You can easily edit texts and images without worrying about ruining your infographic with our in-editor.
Here’s how to:
Step 1: Sign up for free!
Sign up for a free Venngage account using your Gmail, email address or Facebook account.

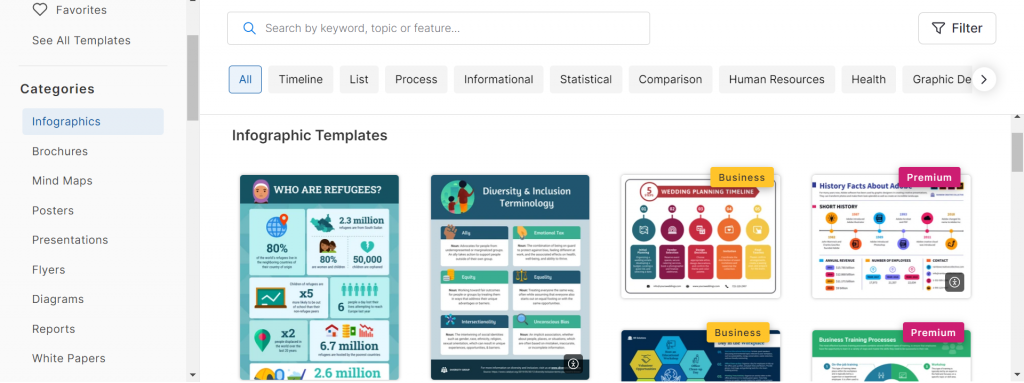
Step 2: Browse our infographics category
In the infographics category, browse through thousands of templates for whatever kind of infographics you want to create. From timeline to statistical and even list, there is an infographic for everyone.
Step 3: Customize your infographic
Once you find an infographic that appeals to you, you can proceed to further refine it to your taste. With Venngage’s drag and drop editor, you can easily make changes to your infographic in seconds without altering your design. We have a vast library of free images and icons that you can use in your infographic.

Let me show you how easy it is to edit an infographic with Venngage’s drag and drop editor:
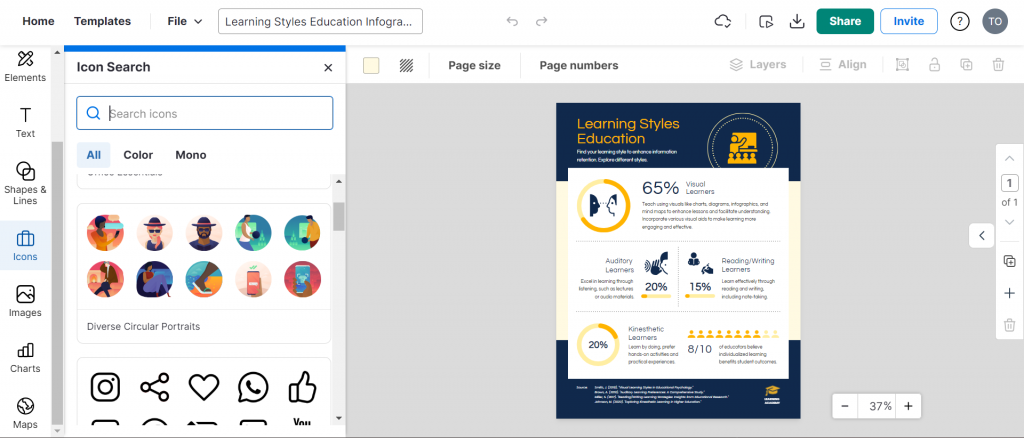
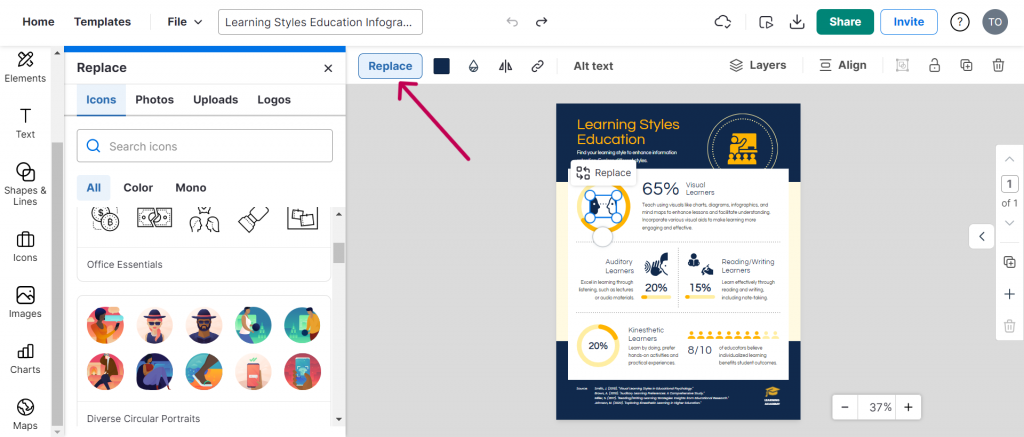
To change an icon or text, simply double click on it as shown:
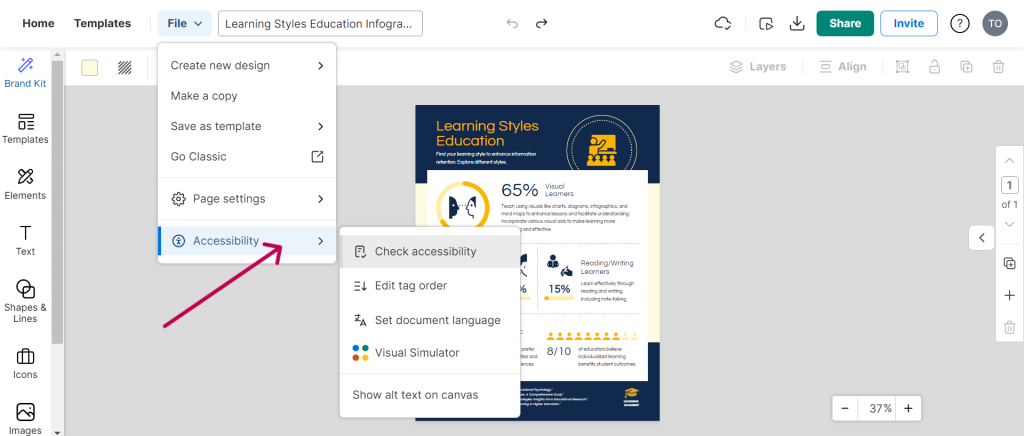
With Venngage, you can also be assured that your infographic will meet accessibility standards, which you cannot get with Google Slides. To check if your infographic is accessible, go to File> Accessibility > Check accessibility.
This is a great plus if you’re looking to create an inclusive design, which is very important in today’s world.
Create professional infographics with Venngage!
Although they are pretty easy to make and free to use, design options for infographics are pretty limited in Google Slides. So, what happens when you need to make professional infographics?
Create complex, professional and accessible infographics with Venngage’s drag and drop editor and choose from thousands of infographic templates that create stunning infographics in quick time!


