


So much of project management focuses on internal systems, and rightly so. It’s essential for organizations to perfect their own processes to stay competitive. However, it’s just as important to take a look at external factors that may impact your core structures.
This is where context diagrams can help. In this article, we’ll take a look at the benefits of this useful visualization tool and see what it can do for you and your projects.
We’ll also show how you can make your own context diagram using Venngage’s diagram maker. Our diagram templates are developed by experts and are customizable through a drag-and-drop Smart Editor, so you can easily create high-quality visuals even without diagramming experience.
What is a context diagram?
A context diagram is a high-level view of a system. It’s a basic sketch meant to define an entity based on its scope, boundaries, and relation to external components like stakeholders.

Otherwise known as a Level 0 data flow diagram, a context diagram provides a general overview of a process, focusing on its interaction with outside elements rather than its internal sub-processes. The latter is typically reserved for more advanced data flow diagrams.
Context diagram vs data flow diagram (DFD)
A context diagram is a high-level DFD that shows a system as a single process with external entities interacting with it. In contrast, a full DFD breaks the system into multiple layers of processes, data stores, and data flows, providing more detail.
Context diagram vs component diagram
A context diagram maps out system boundaries and interactions with external actors, focusing on data flow and communication. A component diagram, on the other hand, comes from UML and shows the internal structure of a system—specifically how software components are organized and interact.
Context diagram vs use case diagram
Context diagrams show system boundaries and data exchange between external entities and the system. Use case diagrams highlight user interactions with the system’s functionality, identifying who does what rather than how data flows.
What is a context class diagram?
A context class diagram combines aspects of context diagrams and UML class diagrams. It typically shows a high-level view of major classes in a system and how they relate to external systems or actors, often used in early-stage object-oriented design.
When should you use a context diagram?
Use a context diagram when you need to define the system scope, understand external interactions, or communicate the system’s boundaries with stakeholders. It’s ideal for early project stages and non-technical audiences.
What are the elements of a context diagram?
A context diagram comprises three key elements.
Central diagram (circles)
The project, system, or entity to be defined. It is symbolized by a circle that holds anything within its control (i.e. job roles and responsibilities, processes) inside. Circle diagrams are pretty much a standard for presenting topics as parts of a whole.
External entities or agents (rectangles)
Thia is the people, systems, and organizations that function outside but interact with the product in some way (i.e. decision-makers, suppliers, customers). These are represented by squares or rectangles.
Data flows (arrows)
Flow lines are usually represented by arrows, these depict data flowing between agents or the specific ways external entities interact with the product. The arrows are often accompanied by text to show the specific type of data being exchanged, or the action being carried out.
What are the benefits of making a context diagram?
A context diagram zeroes in on the external factors that must be considered when building a project or product’s internal architecture.
It is most helpful during the planning phase, when proponents are just starting to interpret the landscape they are working with.
At this point, a context diagram can ensure that the systems developed are relevant to the project’s requirements and constraints, helping reduce potential risks and design missteps early on.

Moreover, context diagrams are simpler and more straightforward compared to most complex schematics that require some technical knowledge to understand. It’s an excellent tool for sharing critical information with team members and helping them develop a better appreciation of projects.
In addition to setting a strong foundation, context diagrams offer several practical benefits:
Provide stakeholder clarity
Context diagrams simplify complex systems into a single, high-level view that shows how external entities interact with the system. This makes it easier for non-technical stakeholders such as clients, executives and project sponsors to understand the system’s purpose, scope and dependencies.
Identify project scope and boundaries
By showing what lies inside and outside the system, context diagrams help teams define and agree on the system’s limits. This is crucial for preventing scope creep, aligning on deliverables and ensuring that effort is spent on solving the right problems.
Reduce risk and rework
Outlining system boundaries and external interactions early in the project lifecycle reduces the likelihood of miscommunication and missed requirements. This proactive clarity minimizes the need for costly rework down the line.
Support requirements gathering
These diagrams often reveal unspoken assumptions or overlooked components. As stakeholders visualize how users and systems interact with the proposed solution, they can more easily surface gaps, dependencies, and integration points that need to be addressed in the planning phase.
Aid in compliance and documentation
For industries where documentation and regulatory compliance are required, context diagrams provide a clear, auditable record of how data flows between systems. This supports governance, privacy and security efforts by showing where sensitive information enters, exits or is processed.
Facilitate system integration planning
When planning integrations with third-party systems, internal tools or legacy platforms, context diagrams help clarify where and how these connections happen. This helps technical teams plan APIs, authentication, data formats and communication protocols more efficiently.
Context diagram examples
A context diagram can be used in a variety of industries and for different objectives. Below, we’ll take you through some examples, including a context diagram in software engineering, product development, and business and systems analysis.
System context diagram
A system context diagram represents the scope of a technical program or application like an automatic teller system software. Take the example below.

A little similar to a case diagram, system context diagrams depict an entire software system as a single process, with arrows indicating the different types of data flowing between its interacting elements.
Work context diagram
A work context diagram identifies the external factors and events that must be considered in order to design a product that will fit in and support its environment. Circle diagrams can be an excellent source for presenting topics as part of a whole, but for instance, the diagram below shows the give-and-take relationship anticipated between an online community (product) and the key players (external entities) in its surroundings.

Business context diagram
Business analysts use context diagrams to set expectations about the tasks that are within and without an enterprise’s scope. In turn, this also helps project stakeholders thoroughly assess the resources necessary for implementation. In this way, such diagrams also serve as a systems requirements document that can formalize and guide business processes.
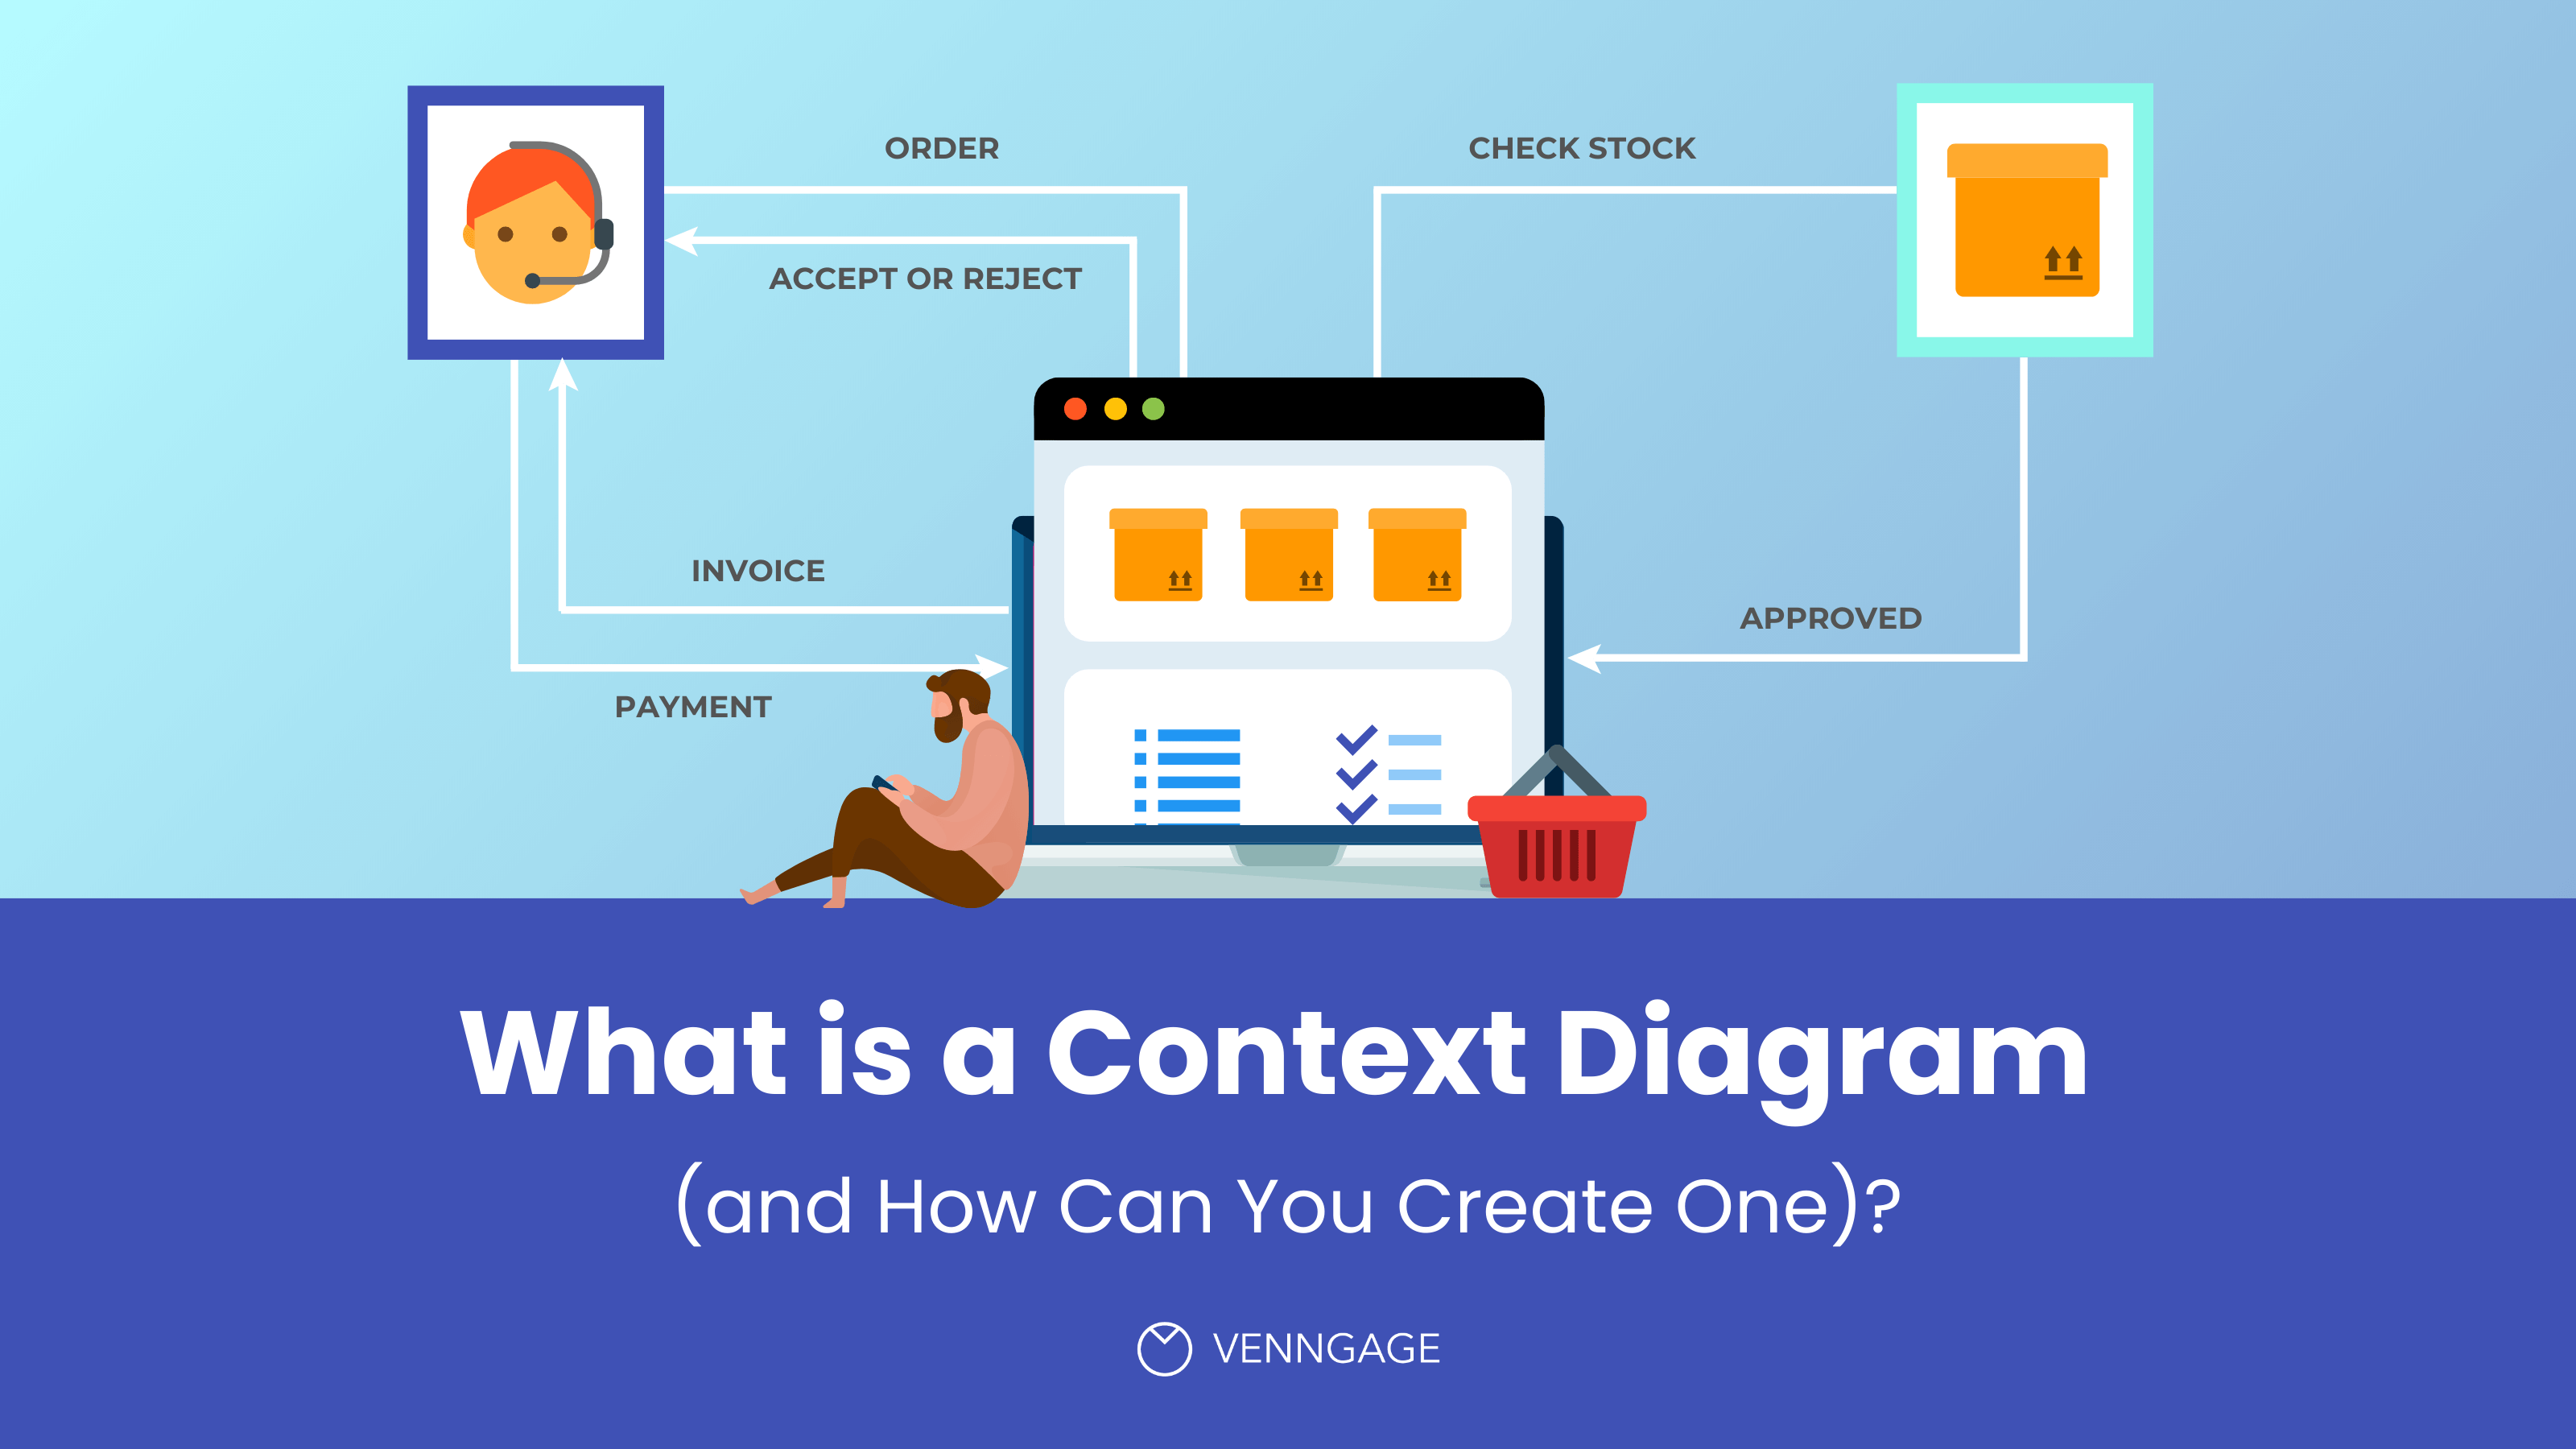
The following diagram shows the data flow between a computerized system for supply chain management and the sales channels it serves. More importantly, the diagram sets the range and limitations of the interacting systems by clearly identifying the tasks involved in each exchange.

How to create a context diagram
Follow these easy steps to create your own context diagram in no time.
1. Define the system you’re representing
Start by identifying the system or application at the center of your diagram. This is often referred to as the “process” or “system under consideration.” Place it at the center of your diagram and label it clearly (e.g., “Inventory Management System” or “Customer Portal”).
2. Identify external entities
List all external entities that interact with your system. These can include:
- Users or customer roles (e.g., admin, visitor, supplier)
- Other departments or teams (e.g., sales, HR)
- Third-party systems (e.g., payment gateways, external databases)
Position them around the system and label them clearly.
3. Determine the data flows
Map the data or information exchanged between the system and each external entity. Use labeled arrows to indicate the direction of data flow (input vs. output). Examples include:
- “Customer submits order”
- “System sends confirmation email”
- “HR uploads employee records”
4. Establish the system boundary
Draw a boundary around your central system to distinguish it from external elements. This visual boundary reinforces what’s inside the system (your area of responsibility) versus what lies outside (external influences).
5. Review for Completeness and Clarity
Double-check that:
- All relevant external entities are included
- Data flows are logical and accurately labeled
- The system’s role is clearly defined
- There is no unnecessary technical detail (remember: this is a high-level view)

Helpful tips to make your diagram more effective
Use clear symbols and labels
Use standard shapes and clear, descriptive labels to keep your diagram easy to understand. Stick to plain language so both technical and non-technical stakeholders can quickly grasp the system’s structure. Before finalizing, double-check that all entities and data flows are accurate and get a second pair of eyes if possible.
Collaborate with stakeholders
Involve key stakeholders and subject matter experts during the diagramming process. Their input helps ensure your diagram reflects real workflows and catches any missing components. This also builds alignment early in the project.
Try pen and paper first
Sketching your diagram by hand can help you quickly explore ideas and spot gaps before moving to a digital version. It’s a simple way to get organized and refine your structure before polishing it up in a design tool.
Use plain language for labels
Avoid jargon or overly technical terms. Use simple, consistent language for all labels and descriptions so that your diagram is accessible to everyone involved including non-specialists or external collaborators.
Use a design tool
A tool like Venngage makes it easy to create professional context diagrams with just a few clicks. Choose from a range of templates and customize elements, like colors, line weights and fonts using an intuitive drag-and-drop editor.
Whether you’re planning systems or presenting to clients, Venngage’s smart features helps you build clear, polished diagrams without any design experience.

FAQs about context diagrams
What is a context class diagram?
A context class diagram is an information system development tool used by software developers to represent the relationship between the main product and its various subsystems or components. In such a diagram, the subsystems and components are grouped according to structural and functional similarities.
What is the difference between a data flow diagram (DFD) and a context diagram?
A context diagram is a kind of data flow diagram (Level 0, the most basic). However, it is much less complex than the more advanced types of DFDs, which go into incredible detail as they illustrate a product’s interior structure.
What is the difference between component diagram and context diagram?
A component diagram shows the internal parts and how they connect in a system. A context diagram, on the other hand, gives a broader view, outlining how the system interacts with the outside world without diving into its internal workings. In short, one focuses on the inside, while the other looks at the big picture outside.
How can you create a context diagram in Word?
Follow these simple steps to build a context diagram on Word. Tip: Enable your grids and rulers to guide your layout. Apart from making sure everything is aligned, they can also ensure your elements’ sizes are consistent.
- On a blank Word document, select “Insert” on the toolbar. A drop-down menu will appear. From there, click “Shape.”
- The Shape menu will appear on the side of your screen. Choose a circle and use your cursor to place this in the middle of your page.
- Double click the circle and type your product name in the middle. You can use this same command to add names or labels elsewhere inside the circle (i.e. the roles, processes, etc. that are within your product’s scope). Alternatively, you can select “Text Box” from the toolbar and insert it where needed.
- To add your external entities and data flow arrows, repeat steps 1 through 3, only make sure to select the appropriate shape or figure for each element.
- To label data flows, select “Text Box” from the toolbar and insert them where needed.
- Lastly, to customize your diagram’s elements, simply double click the shape or figure you wish to modify and adjust using the options that will appear on your toolbar (i.e. “Fill,” “Line,” and “Transparency.”
- Once done, click “File,” “Save as..,” enter your preferred filename, select your preferred file destination, and click “Save.”
A context diagram is an excellent tool for defining a product or project’s scope and limitations. It’s also a great means to identify external factors and events that may have a significant impact on your core structures and processes.
Manage business systems more efficiently with context diagrams
By doing all of the above, this system diagram enables planners and managers to assess projects well enough to mitigate potential risks. Additionally, it enables stakeholders to better grasp and appreciate projects whose success depends on their support and implementation.
Develop your own context diagram with Venngage today. Sign-up for an account (it’s free!) and gain access to our library of pre-made templates that you can easily customize for your needs.
We also invite you to upgrade to a Venngage business account to access My Brand Kit, which lets you add your company’s logo, color palette, and fonts to all your designs with a single click.
A business account also includes the real-time collaboration feature, so you can invite members of your team to work simultaneously on a project.


