


Board reports are supposed to help company directors make decisions under pressure. But most of them miss the mark because they document what happened instead of what matters.
That turns the report into a company diary instead of a decision tool.
How do I know this? As a content analyst, I have analyzed 30+ public board decks and annual filings across different industries.
And the patterns that came out were clear: strong board reports center on risk, performance and direction.
In this guide, I’ll show you how to do that, with clear formats, useful templates and practical tips you can apply yourself.
The board report format structure
A board report either earns attention or gets ignored, depending on its formatting. Here’s what I recommend.
According to Convene’s board report guide, effective board reports follow a clear, consistent format with labeled sections, simple visuals and appendices.
This makes complex information easier for directors to scan and act on. For example, boards often recommend using consistent headings and subheadings, properly labeled charts, and clearly referenced appendices so that the report reads logically from summary to detailed information.
Another similar guide from Diligent recommends structuring board reports so that they give the board what it needs to make informed decisions, not just raw data.
Their best practices emphasize clarity and brevity, incorporating key performance updates, challenges and risks with mitigation plans, financial overviews and any approvals needed.
The 6 cores of a board report format
A board report works best when directors can scan it fast and still walk away informed. Aim for 2-5 pages, max. Use the same structure every quarter. And don’t surprise the board with a new layout.
Below is the core structure that shows up again and again in effective board decks.
1. Executive summary
This is the page everyone reads. A good board report exists to support executive decision-making, not to document internal activity.
Here, your job is to answer three major questions:
- What changed since the last meeting
- What needs a decision or attention now
- What risks or opportunities matter this quarter
Keep this to one page and stick to bullets instead of long paragraphs. A clean executive summary layout makes the content easier to skim and clear visual hierarchy does more work than extra words.
The goal of this format is simple: decision-ready reporting that helps directors act, not just interpret.
All in all, the executive summary should support strategic oversight by helping directors see what needs attention, what needs a decision and what can wait.
2. Company performance snapshot
Strong performance reporting focuses on trends and outcomes, not isolated numbers or one-off metrics.
Directors want signals, not data dumps. Show trends over time and limit yourself to one chart per metric.
KPI visuals are easier to read than tables and consistent chart styles make recurring reports much easier to follow.
Performance data should give the board transparent insights into what’s actually changing, not just what’s being tracked.
Here’s what to include in the snapshot:
- Revenue, growth rate and runway
- Customer metrics that map to revenue
- Headcount and operating efficiency
3. Financial overview
This section should help the directors with informed decision-making. Call out anomalies directly and add a short note next to the chart when context is needed.
Visual summaries work far better here than pasted spreadsheet screenshots. Include the following to make this section useful:
- Budget vs actual spend
- Cash on hand and monthly spend
- Forecast changes since the last board meeting
4. Key risks and issues
This section exists to support clear risk assessment, not to soften problems or delay hard conversations.
This is the section that sparks most boardroom discussions, so keep it clear and direct. Rank risks by how severe they are and how likely they are to happen. Use simple labels like red, yellow and green.
Avoid vague language since directors prefer straight answers. Clear language improves board accountability by making ownership, decisions and risk visible.
Here’s what you need to cover specifically:
- Strategic risks
- Operational risks
- Compliance or governance concerns
5. Strategic initiatives and progress
Roadmap-style visuals work best for the initiatives and progress section. A phased roadmap or initiative tracker helps to keep the conversation focused on results.
This section turns activity into strategic reporting by linking work directly to outcomes and direction.
For each initiative, make sure to include:
- Objective
- Current status
- Blockers
- Decisions required from the board
6. Governance and compliance updates
This section supports board governance by keeping directors aligned on policies, oversight duties, and regulatory responsibilities.
Keep this section short unless something has changed significantly or if the board needs to be informed.
Call out policy updates, regulatory matters or government actions in plain language. If there’s nothing new, state it clearly, because silence often leads to more confusion later.
Clear reporting supports corporate governance by making accountability and oversight visible in every board cycle.
A few things to include:
- Policy updates
- Regulatory matters
- Committee actions
Here’s a simple example of what a typical board report looks like when spread across 2 to 5 pages:
Board of Directors Report
1. Executive Summary
- What changed: Summary of major shifts in market position or milestones.
- Decisions required: Specific motions requiring a board vote today.
- Top Risks/Opportunities: Key items defining this quarter’s focus.
2. Performance Snapshot
Growth & Runway
- Revenue vs. Target
- MoM Growth Rate
- Cash Runway
Customer & Efficiency
- CAC / LTV
- Net Retention (NRR)
- Headcount Efficiency
3. Financial Overview
- Budget vs. Actual: Note any variance over 10%.
- Cash Position: Total cash on hand and burn rate.
- Forecast Updates: Data-driven adjustments.
4. Key Risks & Issues
- ● HIGH: Strategic Risk Description
- ● MED: Operational Risk Description
- ● LOW: Compliance/Governance
5. Strategic Initiatives
| Initiative | Status | Blockers |
|---|---|---|
| Market Expansion | On Track | None |
6. Governance & Compliance
- Policy updates and committee actions.
- Regulatory filings or government inquiries.
Venngage board report templates
Venngage board report templates come up with pre-defined structures that let you add your content. You don’t waste time obsessing over layout, font size or chart placement.
Venngage report templates reflect how directors scan reports, starting with summaries, then performance, then risk.
Each template starts with a clear visual hierarchy, specific sections and space for commentary next to data. This means you can nudge your audience to focus on decisions instead of narration.
Using Venngage templates also means ensuring consistency across reporting cycles. When you reuse the same board, monthly or functional report layout, directors spend less effort reorienting themselves and more time engaging with the substance.
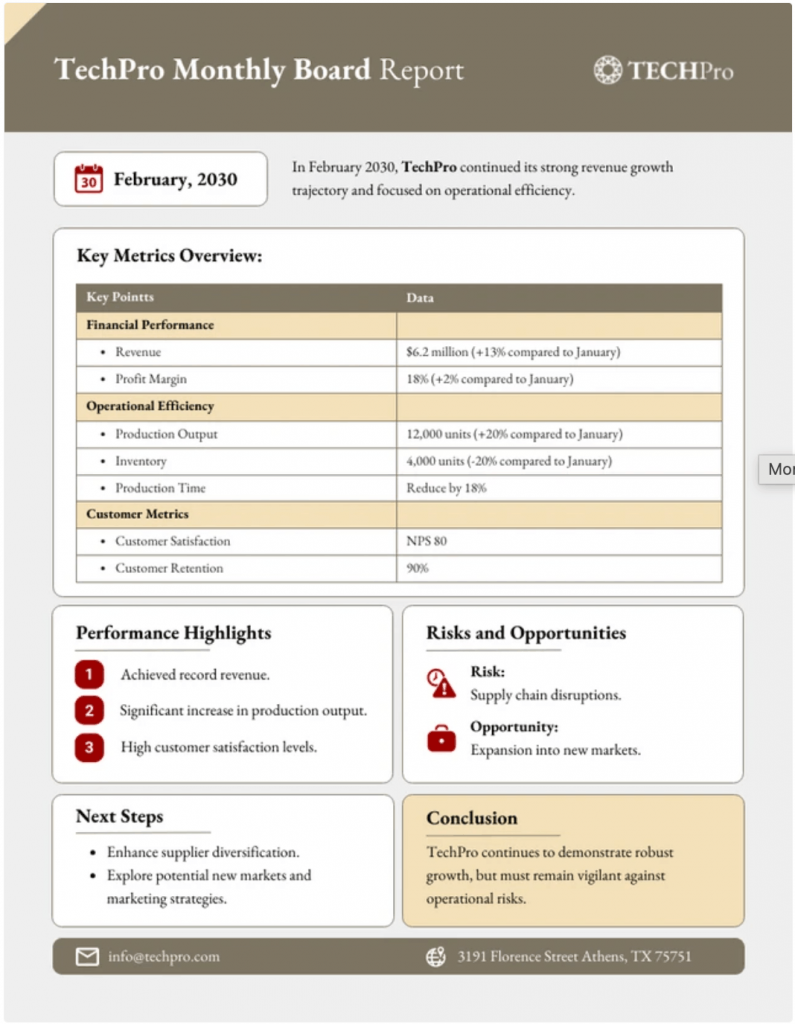
The board monthly board report template below makes this especially clear, since the design stays predictable while the numbers change.
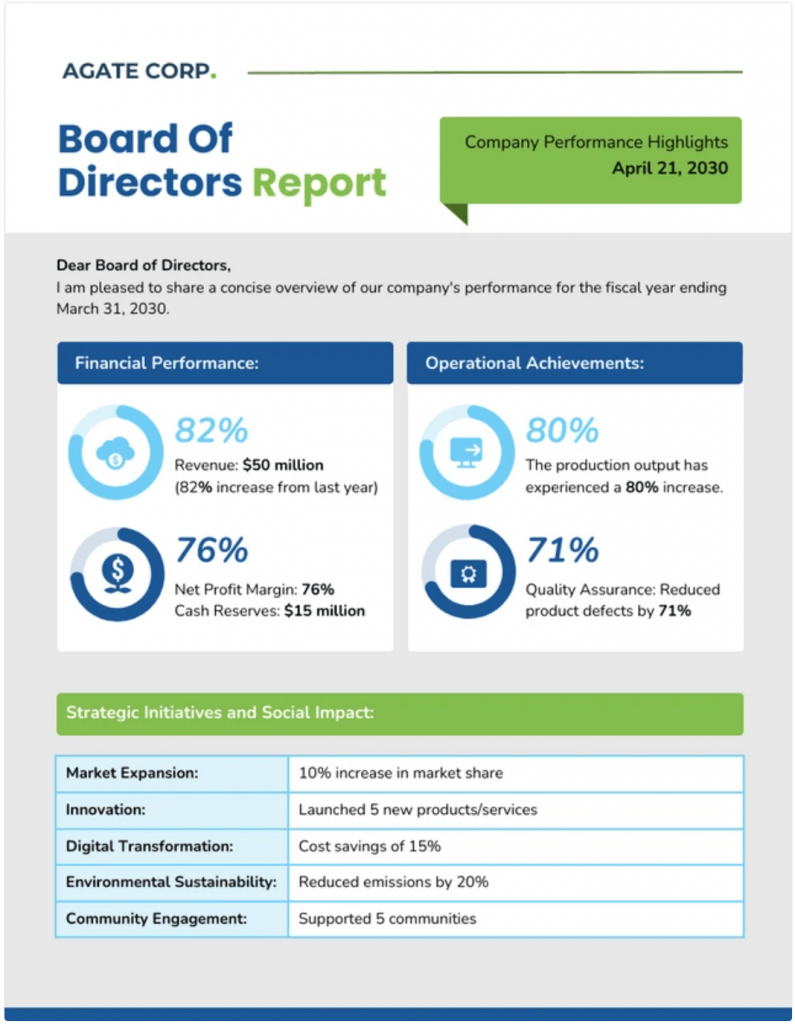
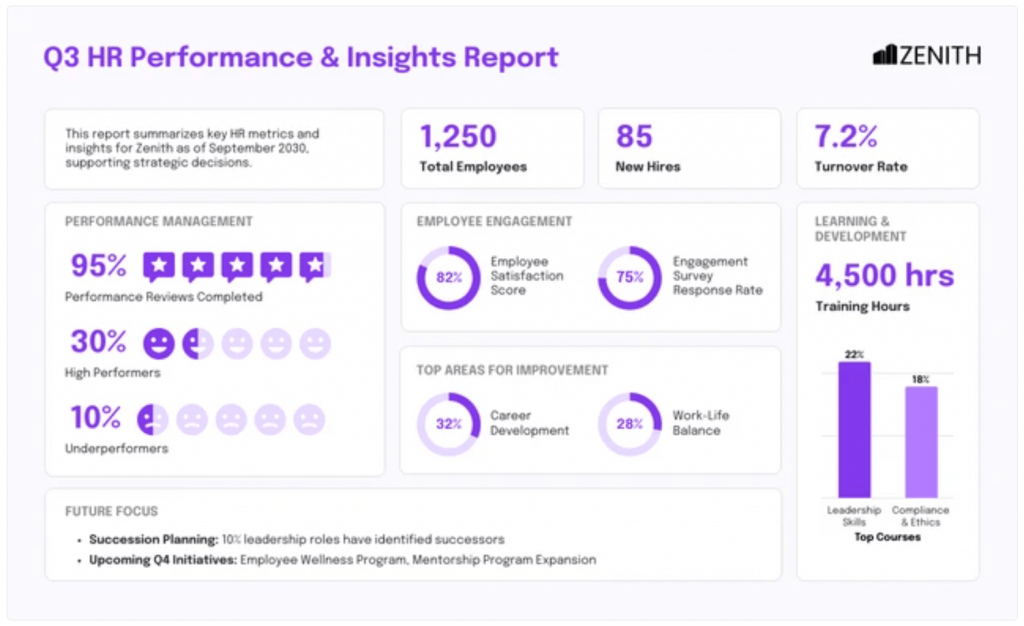
Another advantage is context. For example, the HR board report and general board report templates pair metrics with short explanatory blocks, so data never appears without meaning. That balance is hard to maintain in slide decks built from scratch.
If, for example, you need to prepare daily updates alongside board reports, the same structure-first thinking applies. Venngage has thousands of ready-to-use daily report templates that help you capture progress, issues and priorities quickly without turning updates into chaotic logs.
Why this report name structure works
After reviewing hundreds of board decks, I can tell you that this structure works better than most because it improves board communication by making priorities, risks and decisions easy to scan. The genius of this structure is that it mirrors how humans actually process information: top-down, visual-first, risk-aware and decision-oriented.
I break it down into four core pillars.
Pillar 1: Executive summary first
Venngage report templates put the summary up front because decision-makers are used to scanning, not reading line by line. They need the key changes, decisions and risks immediately. Leading with this section satisfies the “what do I need to know now?” instinct.
Pillar 2: Visualized metrics
Showing KPIs, growth trends and cost efficiency in simple charts makes it easy for your audience to process the information more easily.
Trends over time and one chart per metric allow them to grasp company health in seconds. This is why visuals beat tables every time.
Pillar 3: Early focus on risks and issues
Blockers and risks come next because obstacles shape strategy. Directors need to see the bad news first before they can celebrate the wins. Color-coded severity communicates urgency instantly and encourages pattern recognition rather than forcing directors to painfully decode dense text.
Pillar 4: Strategic initiatives and decisions
Once directors understand health and risks, they can focus on direction. This section links activity to outcomes and highlights decisions required. Using roadmap-style visuals or phased trackers leverages spatial memory, making it easy to recall priorities in discussions.
Tips to make your board reports actually work
A consistent reporting cadence builds trust and reduces friction across board cycles.
Here are practical tips based on research and reporting best practices that will help you use each section of your board report more effectively.
1. Highlight risks with context
Directors are programmed to spot threats early. Showing severity or likelihood (like simple color labels) helps them grasp urgency fast.
To do this, label risks clearly and explain why they matter now. Provide mitigation steps or decision points alongside each risk so the board can act instead of just react.
2. Balance visuals and narrative
Use charts and graphs to show trends, but always add a line or two of context. Research suggests that people recall visual information far better than text alone, especially under time pressure.
As a rule of thumb, avoid complex tables. One well‑designed chart per metric saves time and improves recall.
3. Deliver it ahead of time
Send the full report at least a few days before the meeting. This gives directors time to read and prepare questions, which leads to more productive discussions.
Alternatively, you can also create a reporting cadence that aligns with board cycles so reports arrive consistently and reliably.
FAQs
Still have questions about preparing a board report? You’re not alone. Here are the ones that usually come up.
1. How do you flag bad news without losing board confidence?
This is a common struggle. Our suggestion: be direct about risks and setbacks, but show that you have a plan. Directors want clarity on outcomes and decisions, not long-winded explanations that soften the blow.
2. What do I do when the data I have is incomplete or conflicting?
Call it out directly. Explain what’s missing, why it’s missing and when you’ll have a reliable update. Boards often hate reports that don’t align on data and numbers, especially when decisions depend on them.
3. How much operational detail is too much?
Include only what affects risk, performance or outcomes. If a detail doesn’t change a decision or raise a concern, it doesn’t belong in the board report.
4. How do I ask for a decision without sounding like I’m passing the buck?
Articulate your recommendations clearly, then explain the risks or tradeoffs. Boards expect you to take a stance, not just present options and step back.
Related reporting formats
If you often need to create reports, Venngage has a huge library of report formats you can choose from. And most of them are free to use.
Below are a few ones similar to board reports:.
- Free Monthly Report Templates
- Free Annual Report Templates
- Free Sales Report Templates
- Free Corporate Report Templates
- Free Executive Summary Report Templates
If you want a clearer way to create reports faster, get started with Venngage’s report templates. They give you a solid starting point without the need to think about layout from scratch.


