


If you are here, you’ve likely tried to create a flowchart manually or used a tool that made the process feel like a chore. The problem is that most software treats you like a graphic designer instead of someone just trying to document a process. You end up wasting time dragging lines and pixel-pushing boxes instead of actually mapping out your workflow.
The goal of a flowchart maker is to bridge the gap between a messy idea and a professional diagram that your team can actually follow. In this article, I’ll share the best flowchart software I’ve tested, focusing on tools that handle the formatting for you so you can finish your work and move on.
Related: 7+ Types of Flowcharts and How to Choose the Right One
Quick picks: The best flowchart tools
Here are the best flowchart software or different use cases:
- Venngage: Best for template-led, presentation-ready flowcharts
- Lucidchart: Best for advanced diagramming + Visio alternative
- Miro: Best for workshops and real-time collaboration
- diagrams.net (Draw.io): Best free flowchart software
- Microsoft Visio: Best for Microsoft 365/enterprise diagramming
- FigJam: Best for Figma teams
- Mermaid Chart: Best for developers (diagrams as code)
- yEd: Best free desktop diagramming tool
- Cacoo: Best for real-time diagram collaboration (Slack-friendly)
- SmartDraw: Best for ultra-fast diagramming + huge template library
- Creately: Best for all-in-one diagramming across web/desktop/mobile
Comparison table: Overview of best flowchart software
| Tool | Best for | Key features | Limitations | Pricing |
|---|---|---|---|---|
| Venngage | Template-led, branded flows | AI generator, smart auto-scaling editor, 40k+ icons, one-click brand kit. | No downloads on free plan; focus is on design over technical CAD. | Free; Premium: $19/mo; Business: $49/mo. |
| Jotform | Approval flows, onboarding steps. | AI generation from text, editable diagrams. | It focuses on simpler process mapping. | Free; Bronze: $34/mo; Silver: $39/mo; Gold: $99/mo. | Lucidchart | Advanced diagramming & Visio alternative | Live data linking, SQL/AWS imports, Visio compatibility, advanced layers. | Steep learning curve; free plan capped at 60 shapes/3 docs. | Free; Individual: $9/mo; Team: $10/user/mo. |
| Miro | Workshops & real-time collaboration | Infinite canvas, sticky-note-to-flowchart, collaborative cursors, Miro AI. | Can get messy on large boards; performance lags with thousands of objects. | Free; Starter: $10/mo; Business: $20/user/mo. |
| Draw.io | Free flowchart software | No account required, works offline, technical stencils, Visio compatible. | Dated UI; no native real-time collaboration; manual layout cleanup. | Free for all features. |
| Visio | Microsoft 365/enterprise | Deep Excel/PPT integration, Power Automate exports, BPMN/ISO compliance. | Web version is limited; desktop app is expensive and Windows-only. | Plan 1: $5/user/mo; Plan 2: $15/user/mo. |
| FigJam | Figma teams | Seamless Figma link, playful emotes, 24-hour open guest sessions. | Lacks advanced version control; not built for heavy technical architecture. | Free; Professional: $5/user/mo. |
| Mermaid Chart | Developers (diagrams as code) | Markdown syntax, version control friendly, renders in GitHub/Notion. | No drag-and-drop; requires learning code; limited visual styling. | Free; Pro: ~$6.67/mo. |
| yEd | Free desktop diagramming | Mathematical auto-layout algorithms, Excel/XML import, works offline. | Very dated interface; steep learning curve; no cloud collaboration. | Free (Desktop). |
| Cacoo | Real-time collaboration | Built-in video chat, deep Slack integration, shared team folders. | Free plan is restrictive; UI feels complex for new users. | Free; Pro: $6/mo; Team: $6/user/mo. |
| SmartDraw | Ultra-fast diagramming | 4,500+ templates, intelligent formatting (auto-align), CAD precision. | Annual-only pricing; no free version; rigid UI. | Individual: $9.95/mo (billed annually). |
| Creately | All-in-one across devices | Shapes act as “work items” with data, multi-app syncing, 1-click connect. | Mobile app can be glitchy; free plan has a 45-item canvas limit. | Free; Personal: $8/mo; Team: $8/user/mo. |
How we tested the best flowchart software
The most important factor in a flowchart maker is how easy it is to arrange shapes to actually create a flow. If I have to spend ten minutes fighting a drag-and-drop editor just to align three boxes, the tool is a bottleneck. I need an editor that lets me add shapes and text instantly so I can focus on the process, not the formatting.
When testing the best flowchart software, this is what I looked for. To stay objective, I tested every tool on this list by building the same 15-step “customer onboarding” workflow to see which ones actually saved me time.
Our testing criteria
- The drag-and-drop experience: I looked for “near-zero” friction. I prioritized tools that let me click a “plus” sign on an existing shape to automatically snap the next box and arrow into place.
- Smart connectors: I tested if the arrows actually stay attached when I move shapes around. A good tool should automatically reroute lines so they don’t cross over each other and create a cluttered mess.
- Inline text editing: I shouldn’t have to use a sidebar to label a step. I checked how fast I could double-click a shape, type a label, and have the text wrap perfectly without manual resizing.
- Alignment and grids: To make sure the final result looks professional, I looked for “snap-to-grid” features and visual guides that show me exactly when my boxes are centered.
- Speed to share: I tested how many clicks it takes to go from a finished diagram to a high-res export or a live link I can send to a stakeholder.
The best flowchart software for 2026
Here, I will review each flowchart maker in detail to help you pick the best one for your needs.
1. Venngage
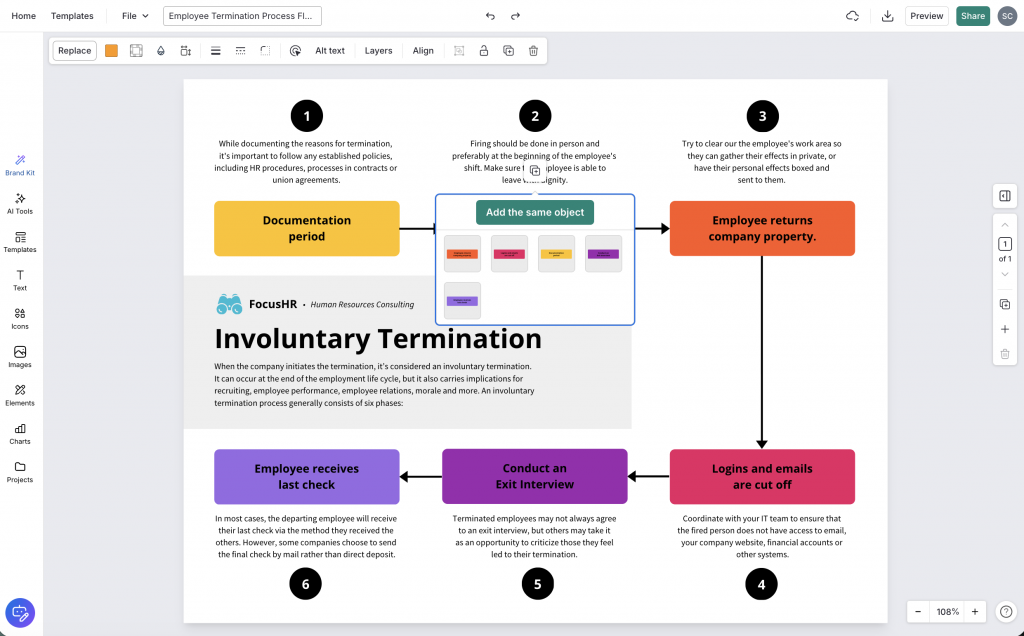
I’ll be transparent: I work at Venngage. However, I’ve held our tool to the exact same testing standards as every other piece of software on this list. Venngage is a design platform built for business professionals, which means you don’t need any design experience to create something with the Venngage Flowchart Maker.
You can choose from thousands of flowchart templates and customize them using the drag-and-drop editor.
Unlike standard design tools where you have to manually move every box, Venngage uses smart shapes with connection ports. When you click a port to add a new step, the software automatically snaps the next shape and arrow into place. If you decide to move a chunk of your flowchart to a different part of the page, the connectors automatically reroute and stay attached, so you never have to “fix” broken lines.
If you want to skip the manual setup entirely, you can use the Venngage AI Flowchart Generator. Simply enter a text prompt describing your process, and the tool builds the logic, shapes, and text for you in seconds.
Features
- Smart formatting: Shapes snap into place automatically and lines stay connected even when you rearrange the entire flow.
- AI flowchart generator: You can build a complete flowchart logic and layout from a simple text prompt.
- Professional templates: Access to thousands of business-specific templates so you never have to start with a blank page.
- Brand kit: One-click customization that applies your company’s specific colors and fonts to the entire diagram.
- Icon library: Over 40,000 icons to help make complex processes easier to scan and understand.
Limitations
- To access the full benefits of your created flowcharts, you’ll need to upgrade to a paid plan. This might be a drawback for those who are looking for free options to download their diagrams.
Pricing
- Free: Includes 5 designs and public sharing.
- Premium: $10 per month (billed annually) or $19 month-to-month. Includes unlimited designs, high-res PNG exports, and private sharing.
- Business: $24 per user/month (billed annually) or $49 month-to-month. Includes the AI flowchart generator, brand kits, team collaboration, and PowerPoint exports.
2. Jotform
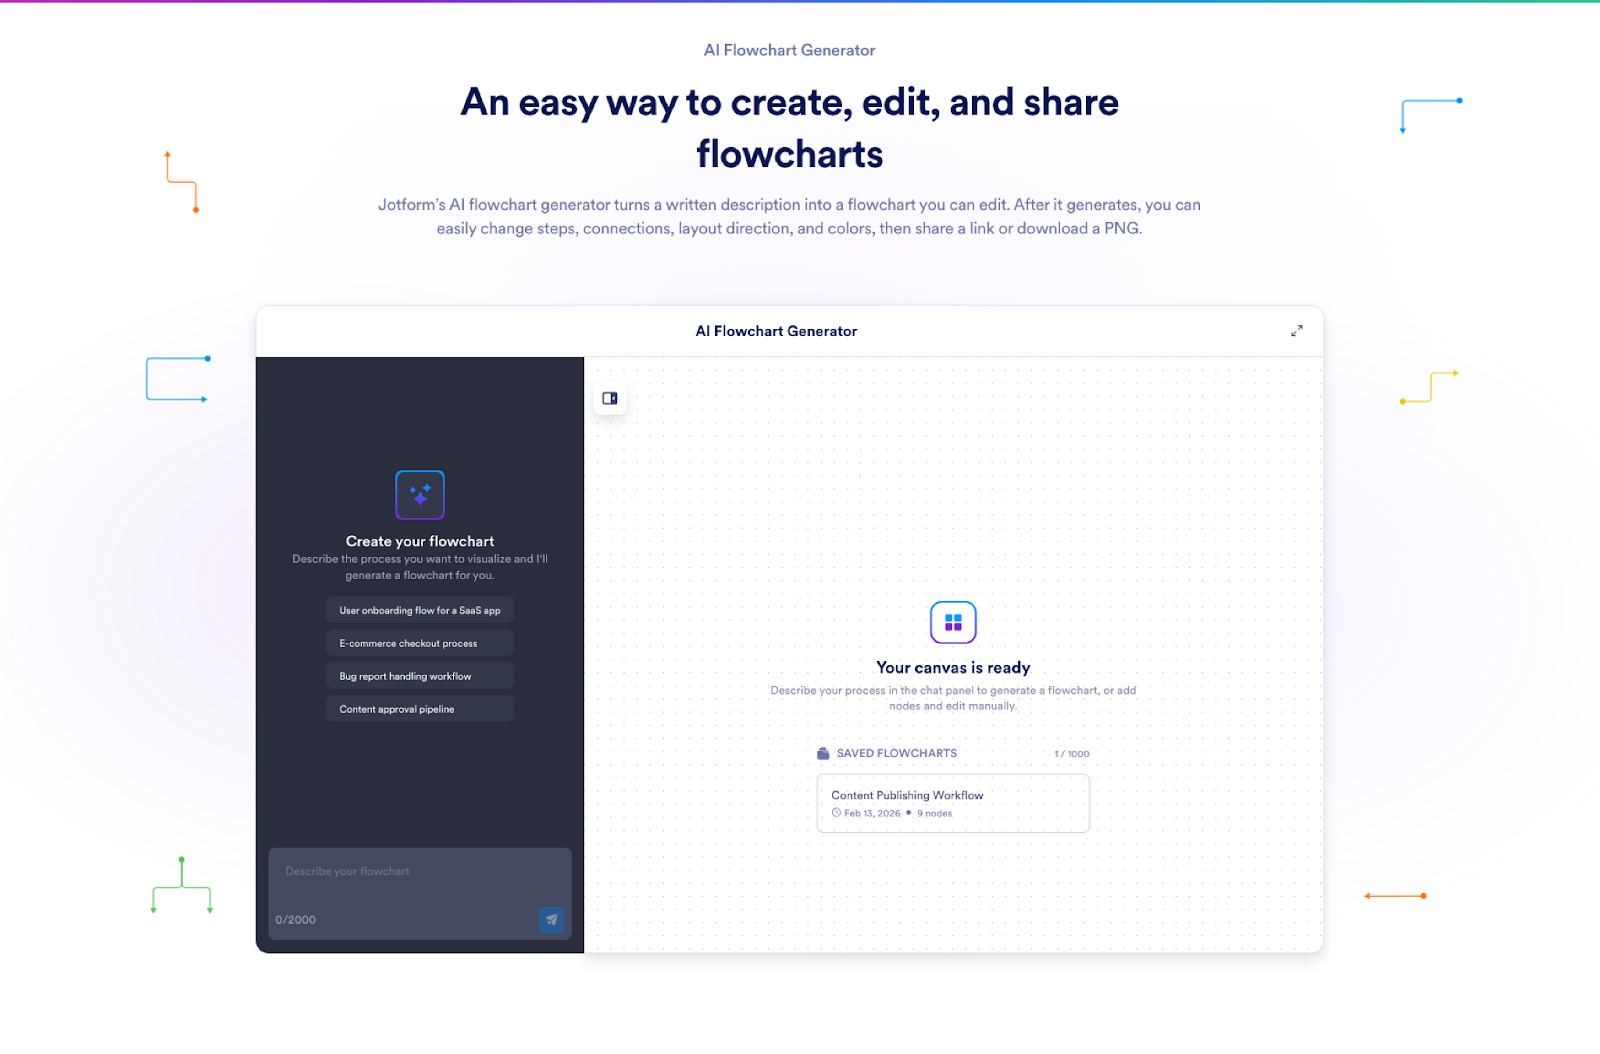
Source: Screenshot from Jotform
During my testing, I found Jotform quick and useful for documenting processes, approvals, and workflows that need a quick visual first draft you can refine. The Jotform AI Flowchart Generator can turn a plain-language description of your process into a fully editable flowchart, no drawing from scratch required. Once generated, you can fine-tune steps, change connections, adjust layout direction and colors, then export the chart as a PNG or share a link with collaborators.
Features
- AI generation from text: You can describe a process and get a flowchart instantly.
- Editable diagrams: After creation, you can edit steps, connections, structure, layout, and colors.
- Export & share options: Download your chart as a PNG or share a link so others can review or copy it.
Limitations
- It’s focused on simpler process mapping rather than deep technical notation or highly specialized diagram libraries.
- When you create something complex with its AI, it can take some manual editing to get it exactly where you want.
Pricing
- Free: Includes 5 AI flowcharts.
- Bronze: $34/month, includes 25 AI flowcharts.
- Silver: $39/month, includes 50 AI flowcharts.
- Gold: $99/month, includes 100 AI flowcharts.
- Enterprise: Custom pricing for unlimited AI flowcharts.
3. Lucidchart
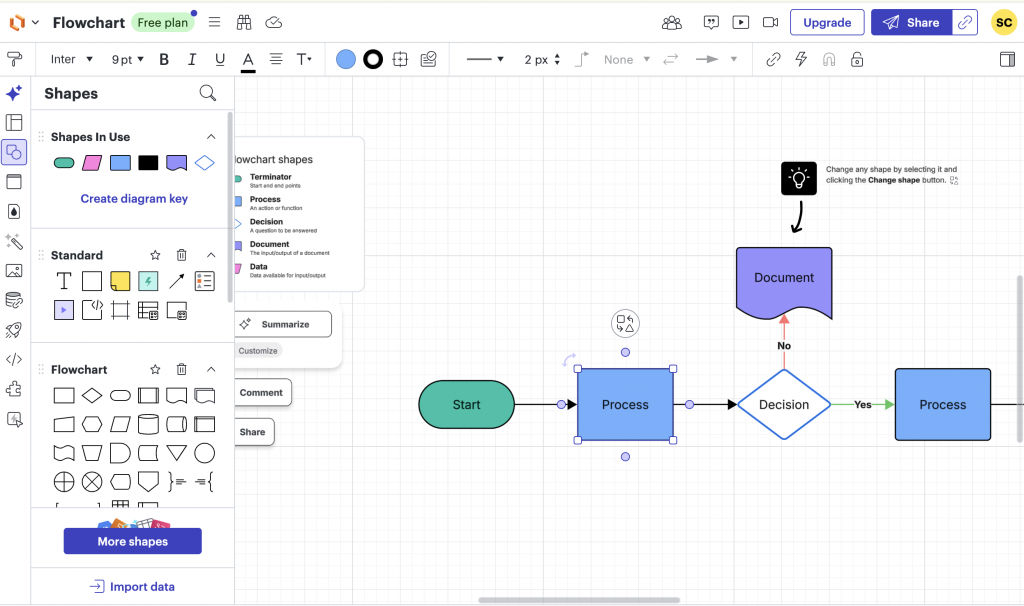
Source: Screenshot from Lucidchart
If you are mapping out a complex backend infrastructure or a relational database, Lucidchart is the most capable tool I tested. It feels more like a precise engineering canvas than a creative whiteboard. While other apps focus on making things look “pretty,” Lucidchart is built for documentation that doesn’t break.
The best part is that it doesn’t lag when your diagram hits 100+ shapes, and it has the most robust library for technical notations like BPMN 2.0 and AWS architecture.
Features
- Live data linking: You can connect your shapes directly to a Google Sheet. If a value changes in your spreadsheet, the data in your flowchart updates automatically.
- Automated ERD imports: For developers, you can import database schemas, and Lucidchart will automatically visualize the relationships between tables for you.
- Smart line routing: When you move a box, the arrows stay attached and automatically bend around other shapes to keep the diagram clean.
- Layers and hotspots: You can create “hotspots” that toggle different layers, allowing you to show a “before and after” process within a single file.
- Visio compatibility: It handles imports from Microsoft Visio better than any other cloud tool, preserving the formatting of legacy files.
Limitations
- The interface is packed with buttons and settings that can feel overwhelming if you just want to make a simple 5-step flow.
- It lacks the one-click design polish of a tool like Venngage. Making these charts look “on-brand” for a marketing presentation takes a lot of manual work.
Pricing
- Free: Includes 3 editable documents and 60 shapes per document.
- Individual: $9.00 per month. Includes unlimited documents and unlimited shapes.
- Team: $10.00 per user/month (minimum 3 users). Includes revision history and collaboration tools.
- Enterprise: Custom pricing for advanced admin controls and SSO.
4. Miro

Source: Screenshot from Miro
Miro is an infinite whiteboard, which makes it the best choice when you don’t actually know what the final process looks like yet. If you are in a meeting with ten people and everyone is shouting ideas, Miro lets you throw sticky notes and rough shapes onto the canvas in real-time. It’s built for the “messy” stage of process mapping before you move into a final, structured document.
What I like most is the collaborative energy. You can see everyone’s name moving around the board as they work, which makes remote workshops feel much more interactive.
Features
- Collaborative cursors: You can see exactly where your team is looking and editing in real-time, which is essential for live brainstorming.
- Sticky note to flowchart: You can start with a cluster of digital sticky notes and use the auto-align feature to snap them into a structured flowchart.
- One-click expansion: When you hover over a shape, arrows appear in every direction. Clicking one automatically adds the next shape and connects it for you.
- Miro AI: You can highlight a group of ideas and ask the AI to “generate a flowchart,” and it will build the logic based on your notes.
- Infinite canvas: You never run out of room, so you can keep your research, screenshots, and notes right next to your actual flowchart.
Limitations
- Because the canvas is infinite and flexible, it’s very easy to create a disorganized flow that is hard for an outsider to follow.
- While great for general business flows, it lacks the deep, specialized libraries for engineering and IT that you find in Lucidchart.
Pricing
- Free: Includes a single workspace with 3 editable boards.
- Starter: $10.00 per month. Includes unlimited boards and high-res exports.
- Business: $20.00 per user/month. Includes advanced diagramming shapes and guest access.
- Enterprise: Custom pricing for organization-wide security and support.
5. Draw.io
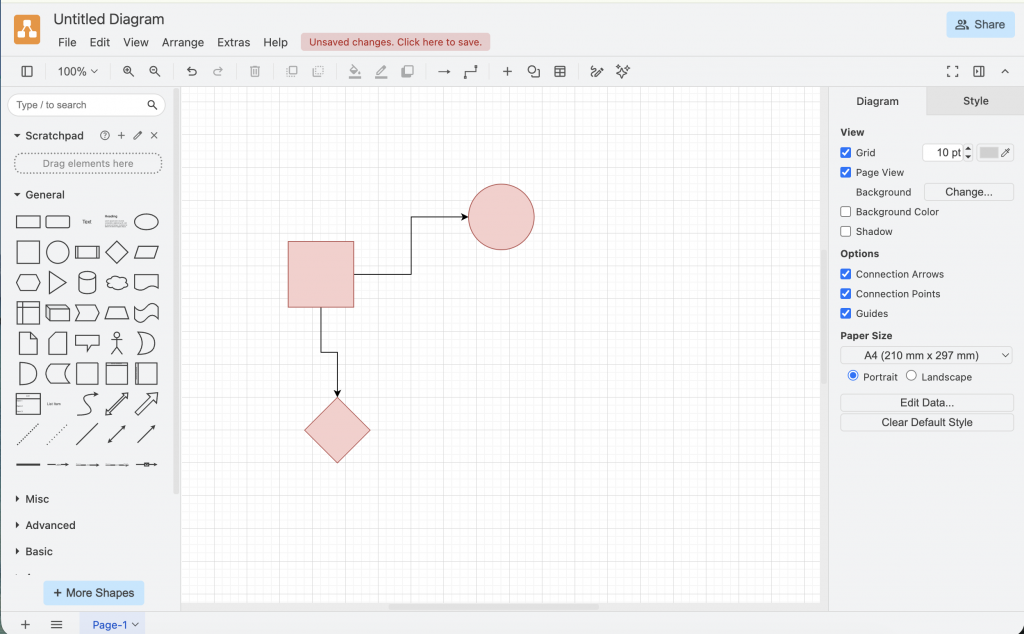
Draw.io is one of the only platforms that doesn’t lock your work behind a paywall or limit the number of shapes you can use. While the interface looks like software from a decade ago, the actual engine is surprisingly powerful.
During my testing, I found that it handles complex technical stencils, like Cisco network icons and electrical circuits, just as well as expensive enterprise tools. It is my go-to recommendation if you need to build a quick flowchart without creating an account or dealing with a subscription. It saves files directly to your device or cloud storage, meaning you own your data from the start.
Features
- Offline desktop app: There is a downloadable version for Windows, macOS, and Linux that works completely offline, which is a huge plus for privacy.
- Automatic layout tool: If your flowchart gets messy, you can use the “arrange” menu to automatically re-center and space your shapes in one click.
- Visio and Lucidchart viewer: It can open and edit
.vsdxand Lucidchart files, making it a great free alternative for viewing files from teammates who use paid software.
Limitations
- The UI is functional but clunky. It lacks the modern, polished feel of a tool like Venngage or Miro.
- While it has “floating” connections, moving large groups of shapes often requires you to manually adjust the arrows to keep the flow from looking tangled.
Pricing
- Free: No cost for individual use, including all features and export types.
- Paid (for Confluence/Jira): There is a per-user fee only if you want to integrate it directly into Atlassian products.
6. Microsoft Visio
If you work in a large corporation that already runs on Microsoft 365, Visio is likely already in your toolkit. I tested both the web and desktop versions, and it remains the heavyweight of the industry for technical documentation. It excels at documenting massive, standardized processes where every shape needs to follow strict compliance rules.
Its biggest strength is its ability to turn a diagram into a functioning automated workflow via Power Automate, essentially turning your flowchart into a piece of working software. While it can feel rigid and “corporate,” the precision it offers for technical mapping is hard to beat.
Features
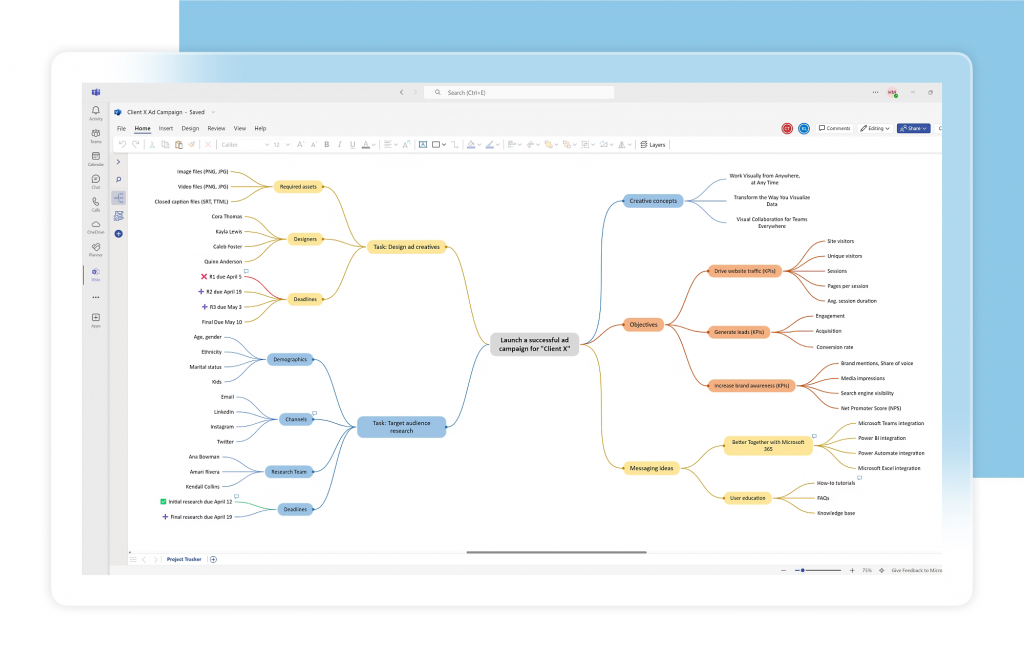
- Microsoft 365 integration: You can build a chart in Visio and embed it into Word or PowerPoint, where it stays updated automatically as you make changes.
- Data-linked diagrams: In the desktop version, you can connect your flowchart to live Excel data. As your spreadsheet updates, the shapes in your flowchart change color or status in real-time.
- Industry compliance stencils: It has the most accurate libraries for specialized standards like BPMN 2.0, Six Sigma, and ISO.
- Power Automate exports: You can design a business process in Visio and export it directly to Microsoft Power Automate to trigger real-world automations.
Limitations
- The web version is very limited. If you need advanced features like data linking or layers, you are forced to use the Windows desktop application.
- It is not a creative tool. Trying to make a unique or “on-brand” flowchart is difficult because the software is built for technical standardization.
Pricing
- Visio in Microsoft 365: Included for free in many business plans for basic web-based editing.
- Visio Plan 1: $5.00 per user/month. Includes the web app and basic features.
- Visio Plan 2: $15.00 per user/month. Includes the full desktop application and advanced data linking.
- Visio Standard 2024: $309.99 one-time purchase for the desktop app (no cloud features).
- Visio Professional 2024: $579.99 one-time purchase for the full technical suite.
7. FigJam
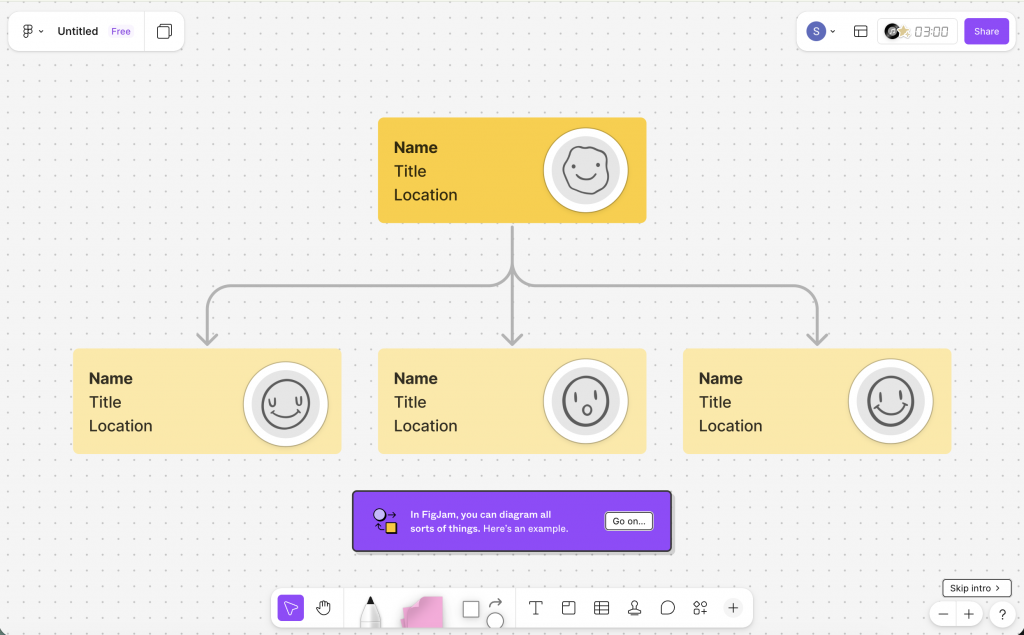
If your design team already uses Figma for UI/UX work, FigJam is the most logical choice. It is a collaborative whiteboard that feels more like a playground than a stiff diagramming tool. During my testing, the biggest advantage was the seamless “two-way” link with Figma.
You can copy a design component from Figma, paste it into FigJam to annotate it with your team, and then move those ideas back into your design file without any formatting issues.
Features
- Smart connector logic: When you draw a line between two shapes, it automatically sticks. If you rearrange the flow, the lines bend and move with you so you don’t have to manually redraw them.
- FigJam AI: You can use a simple text prompt like “make a flowchart for a user sign-up process,” and the AI will build out the logic and layout for you in seconds.
- Open sessions: You can invite external clients or stakeholders to a “24-hour open session” where they can edit and comment without needing to create a Figma account.
- Interactive stamps and widgets: It includes playful elements like “high-five” cursors and voting stamps that make live meetings much more engaging than a standard screen share.
Limitations
- It is a whiteboard first, which means it’s easy for a large flowchart to become disorganized. It doesn’t have the rigid “auto-alignment” power of a tool like Lucidchart.
- It doesn’t have the specialized icon libraries needed for deep technical work like network architecture or AWS mapping.
Pricing
- Free: Includes 3 active files and unlimited collaborators.
- Professional: $5.00 per user/month. Includes unlimited files and private team folders.
- Organization: $25.00 per user/month. Includes centralized file management and custom templates.
- Enterprise: $75.00 per user/month. Includes advanced security and dedicated support.
8. Mermaid Chart
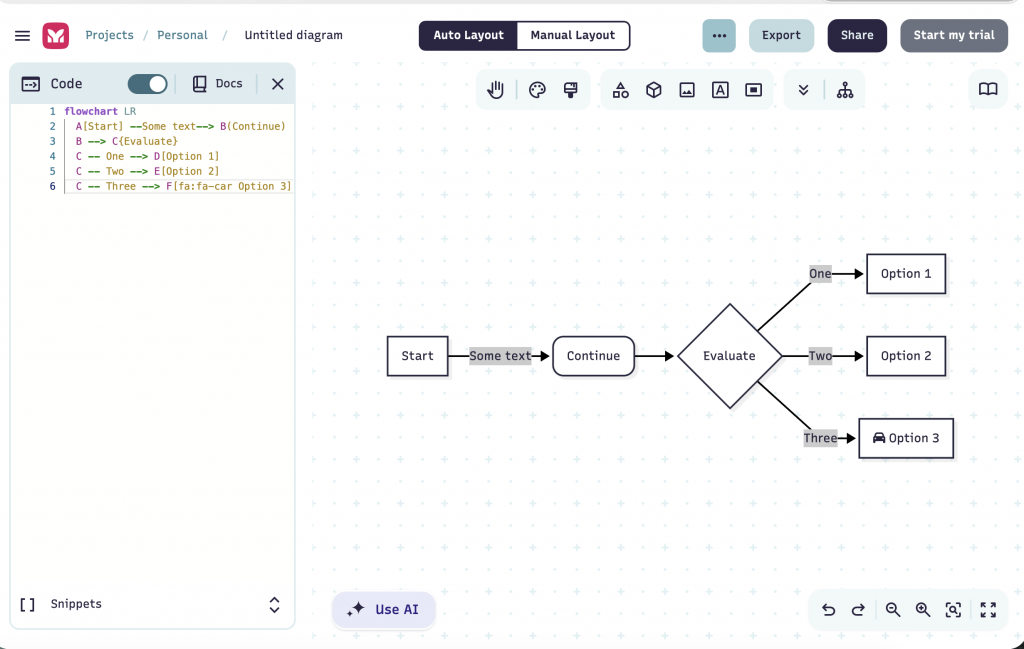
Mermaid Chart is entirely different from the other tools on this list because you don’t draw your flowchart — you write it. Using a simple Markdown-inspired syntax, you type out the logic of your process, and the software renders the diagram for you automatically. This is a game-changer for developers or technical writers who want their diagrams to live inside their code repositories.
I found it incredibly efficient because I could update a 20-step flowchart by just changing a line of text, rather than clicking and dragging boxes around for twenty minutes.
Features
- Version control friendly: Since your diagrams are just text files, you can track changes in Git just like you do with code. This means you can see exactly who changed a process and why.
- AI-assisted generation: It includes a “Mermaid AI” chatbot that can turn a paragraph of text into a perfectly formatted diagram code snippet.
- Wide documentation support: Mermaid diagrams render natively in GitHub, GitLab, and Notion, so your team can see the visuals directly in your documentation.
- Zero manual layout: You never have to worry about alignment. The engine handles the spacing and line routing for you based on the logic of your text.
Limitations
- f you aren’t comfortable with basic coding or Markdown, there is a learning curve. It is not an intuitive “click and drag” experience.
- You have very limited control over the “look” of the chart. If you need a pixel-perfect design for a marketing deck, this is not the right tool.
Pricing
- Free: Includes 5 diagrams and basic AI credits.
- Pro: $80.00 per year (approx. $6.67/month). Includes unlimited diagrams and advanced AI features.
- Enterprise: $200.00 per year. Includes team collaboration and advanced security features.
9. yEd: Best free desktop tool for massive, complex datasets
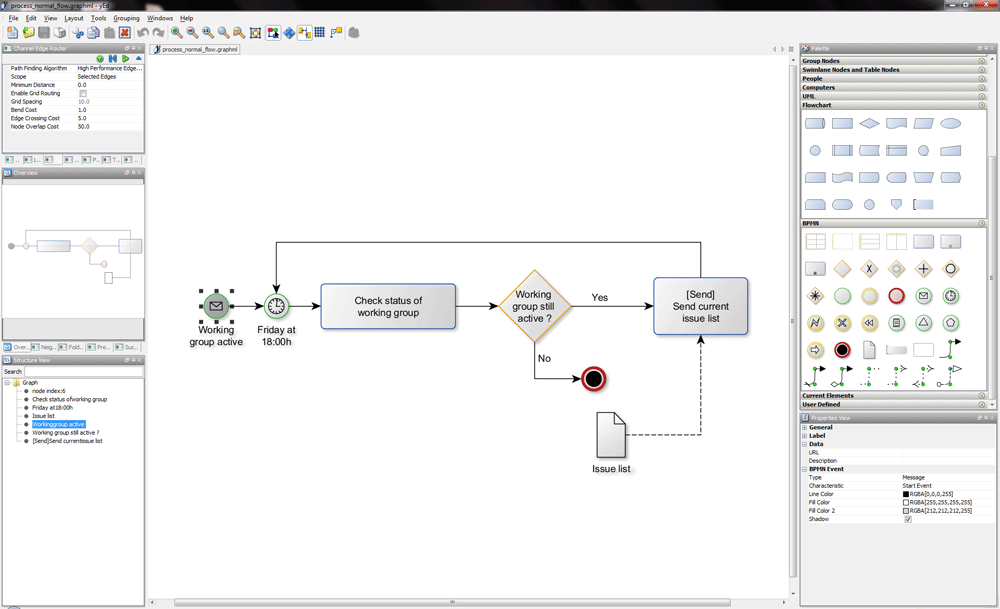
If you are looking for a powerful, old-school desktop application that is completely free for commercial use, yEd is the hidden gem of the industry. It doesn’t have the modern, colorful UI of a SaaS tool, but its mathematical auto-layout algorithms are some of the best I’ve ever tested.
It is specifically designed for people who have to deal with massive amounts of data. I’ve seen it take a chaotic Excel sheet of 500+ nodes and turn it into a perfectly organized hierarchical chart with the press of a single button.
Features
- Powerful auto-layouts: It has specialized algorithms (Organic, Hierarchical, Circular) that automatically organize your messy diagrams into a logical structure.
- Excel and XML import: You can import a spreadsheet directly, and yEd will build the flowchart for you based on the data columns you specify.
- Nesting and groups: You can create “nested” nodes that you can expand or collapse, which is essential for managing huge processes without overwhelming the viewer.
- Works offline: Since it is a desktop application (Windows, Mac, Linux), you can work on sensitive diagrams without ever uploading your data to the cloud.
Limitations
- The UI feels like a technical tool from the early 2000s. It’s not “pretty,” and it takes a while to find where all the settings are hidden.
- Since it’s a local file-based tool, you can’t have two people editing the same chart at once like you can in Miro or FigJam.
Pricing
- The software is free to download and use for any purpose.
10. Cacoo
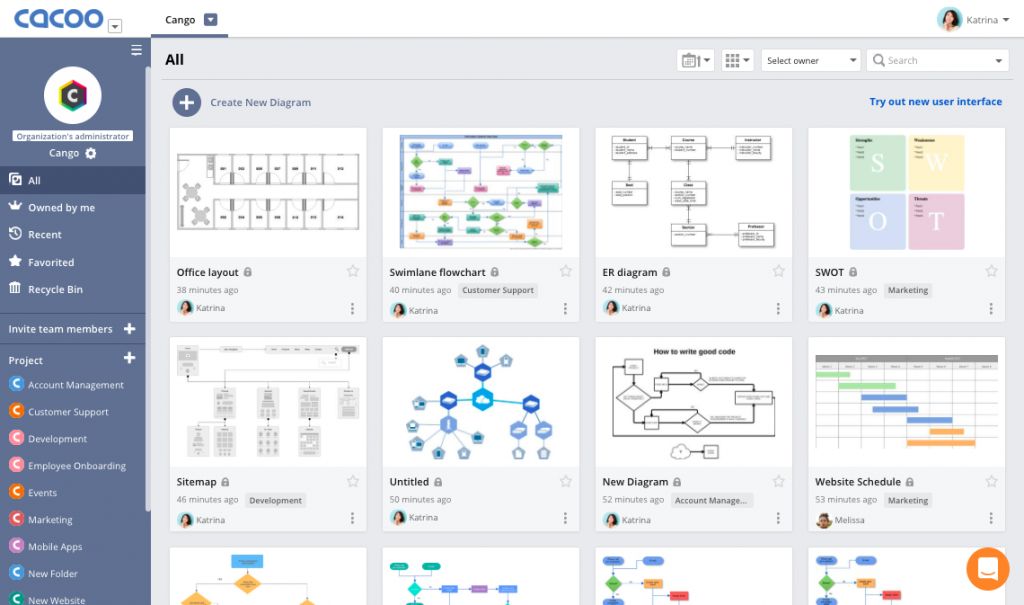
Source: Screenshot from Cacoo
Cacoo stands out as a dynamic flowchart and diagram tool that serves not just as a mere design platform but also as an interactive digital whiteboard. Its simple yet effective user interface encourages users to craft their designs from the ground up, streamlining creativity and collaborative brainstorming sessions.
Features
- Built-in video and chat: You can hop on a call directly inside the editor, which is much faster than switching back and forth between Zoom or Teams while trying to align shapes.
- Smart Slack integration: It sends a preview of the diagram directly into your Slack channel whenever someone makes a change.
- Multi-user cursors: You can see exactly what your colleagues are doing as they do it, making live brainstorming sessions feel smooth and lag-free.
- Dynamic charts: You can import data directly into Cacoo to create visuals that update automatically, which is great for tracking project metrics.
- Revision history: It keeps a detailed log of every change, allowing you to see who edited what and revert to a previous version if a collaborative session goes off the rails.
Limitations
- On very large or complex diagrams, I noticed a slight delay in shape movement, especially when multiple people were editing at once.
- While basic flowcharting is intuitive, some of the more advanced administrative and data-linking features take time to master.
Pricing
- Free: Includes 6 sheets, unlimited collaborators, and PNG exports.
- Pro: $6.00 per month. Includes unlimited sheets, 1:1 online training, and multiple export options (SVG, PDF, PPT).
- Team: $6.00 per user/month. Includes shared folders, advanced security settings, and priority email support.
11. SmartDraw
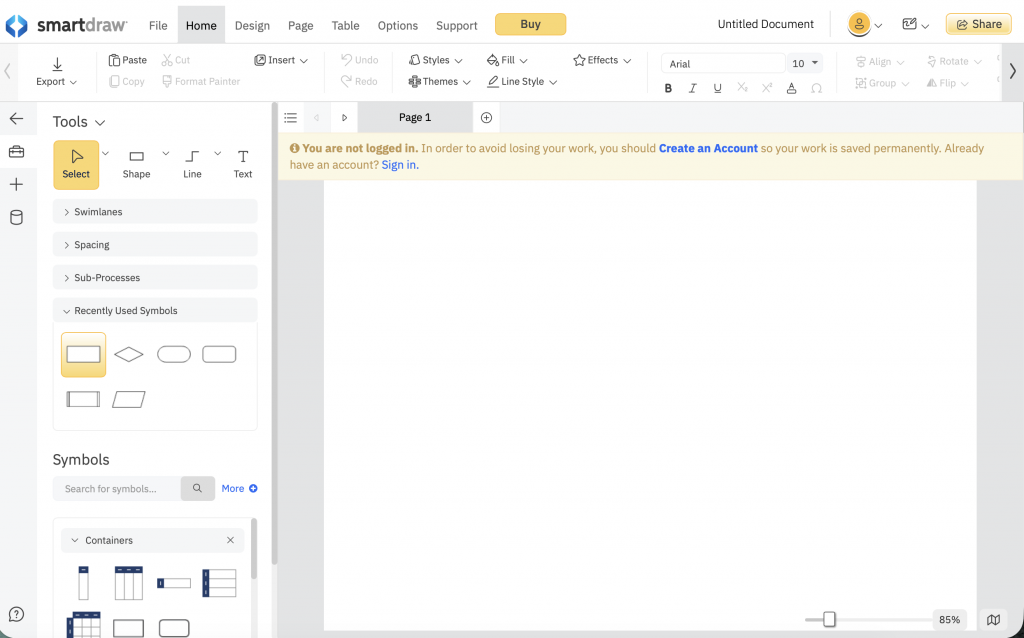
Source: Screenshot from SmartDraw
SmartDraw emerges as a leading visual asset creation tool tailored for individuals and businesses that regularly rely on detailed and diverse visual content. This versatile platform offers the unique advantage of being accessible online or as a standalone software application exclusively for Windows users. Catering to a broad audience, from designers to project managers, it acts as a one-stop solution for various diagrammatic needs.
Features
- Intelligent formatting: This is the standout feature. You can add, delete, or move steps, and the entire diagram automatically readjusts its spacing and alignment.
- CAD-level precision: It includes specialized tools for architectural and engineering diagrams, allowing you to create scaled drawings that most other flowchart tools can’t handle.
- Extensive integration stack: It works seamlessly with the entire Microsoft 365 and Google Workspace suites, plus Jira, Trello, and Confluence.
- Data-driven power: You can build diagrams by importing data from specialized sources, which is a major time-saver for enterprise-level documentation.
- Visual retention: It has a built-in “document retention” feature for teams, ensuring that important processes aren’t accidentally deleted when a team member leaves.
Limitations
- For individual users, there is no month-to-month option. You have to commit to a full year upfront, which is a high barrier if you only need it for a one-off project.
- Because the software is so focused on “intelligent” automation, it can sometimes feel a bit restrictive if you want to create a non-standard or highly creative layout.
Pricing
- Individual: $9.95 per month (billed annually). Includes all 4,500+ templates and advanced formatting tools.
- Team: $8.25 per user/month (billed annually, minimum 3 users). Includes administrative controls and shared team folders.
- Site: $5.00 per user/month (billed annually). Includes SSO and unlimited shared folders for the entire organization.
12. Creately
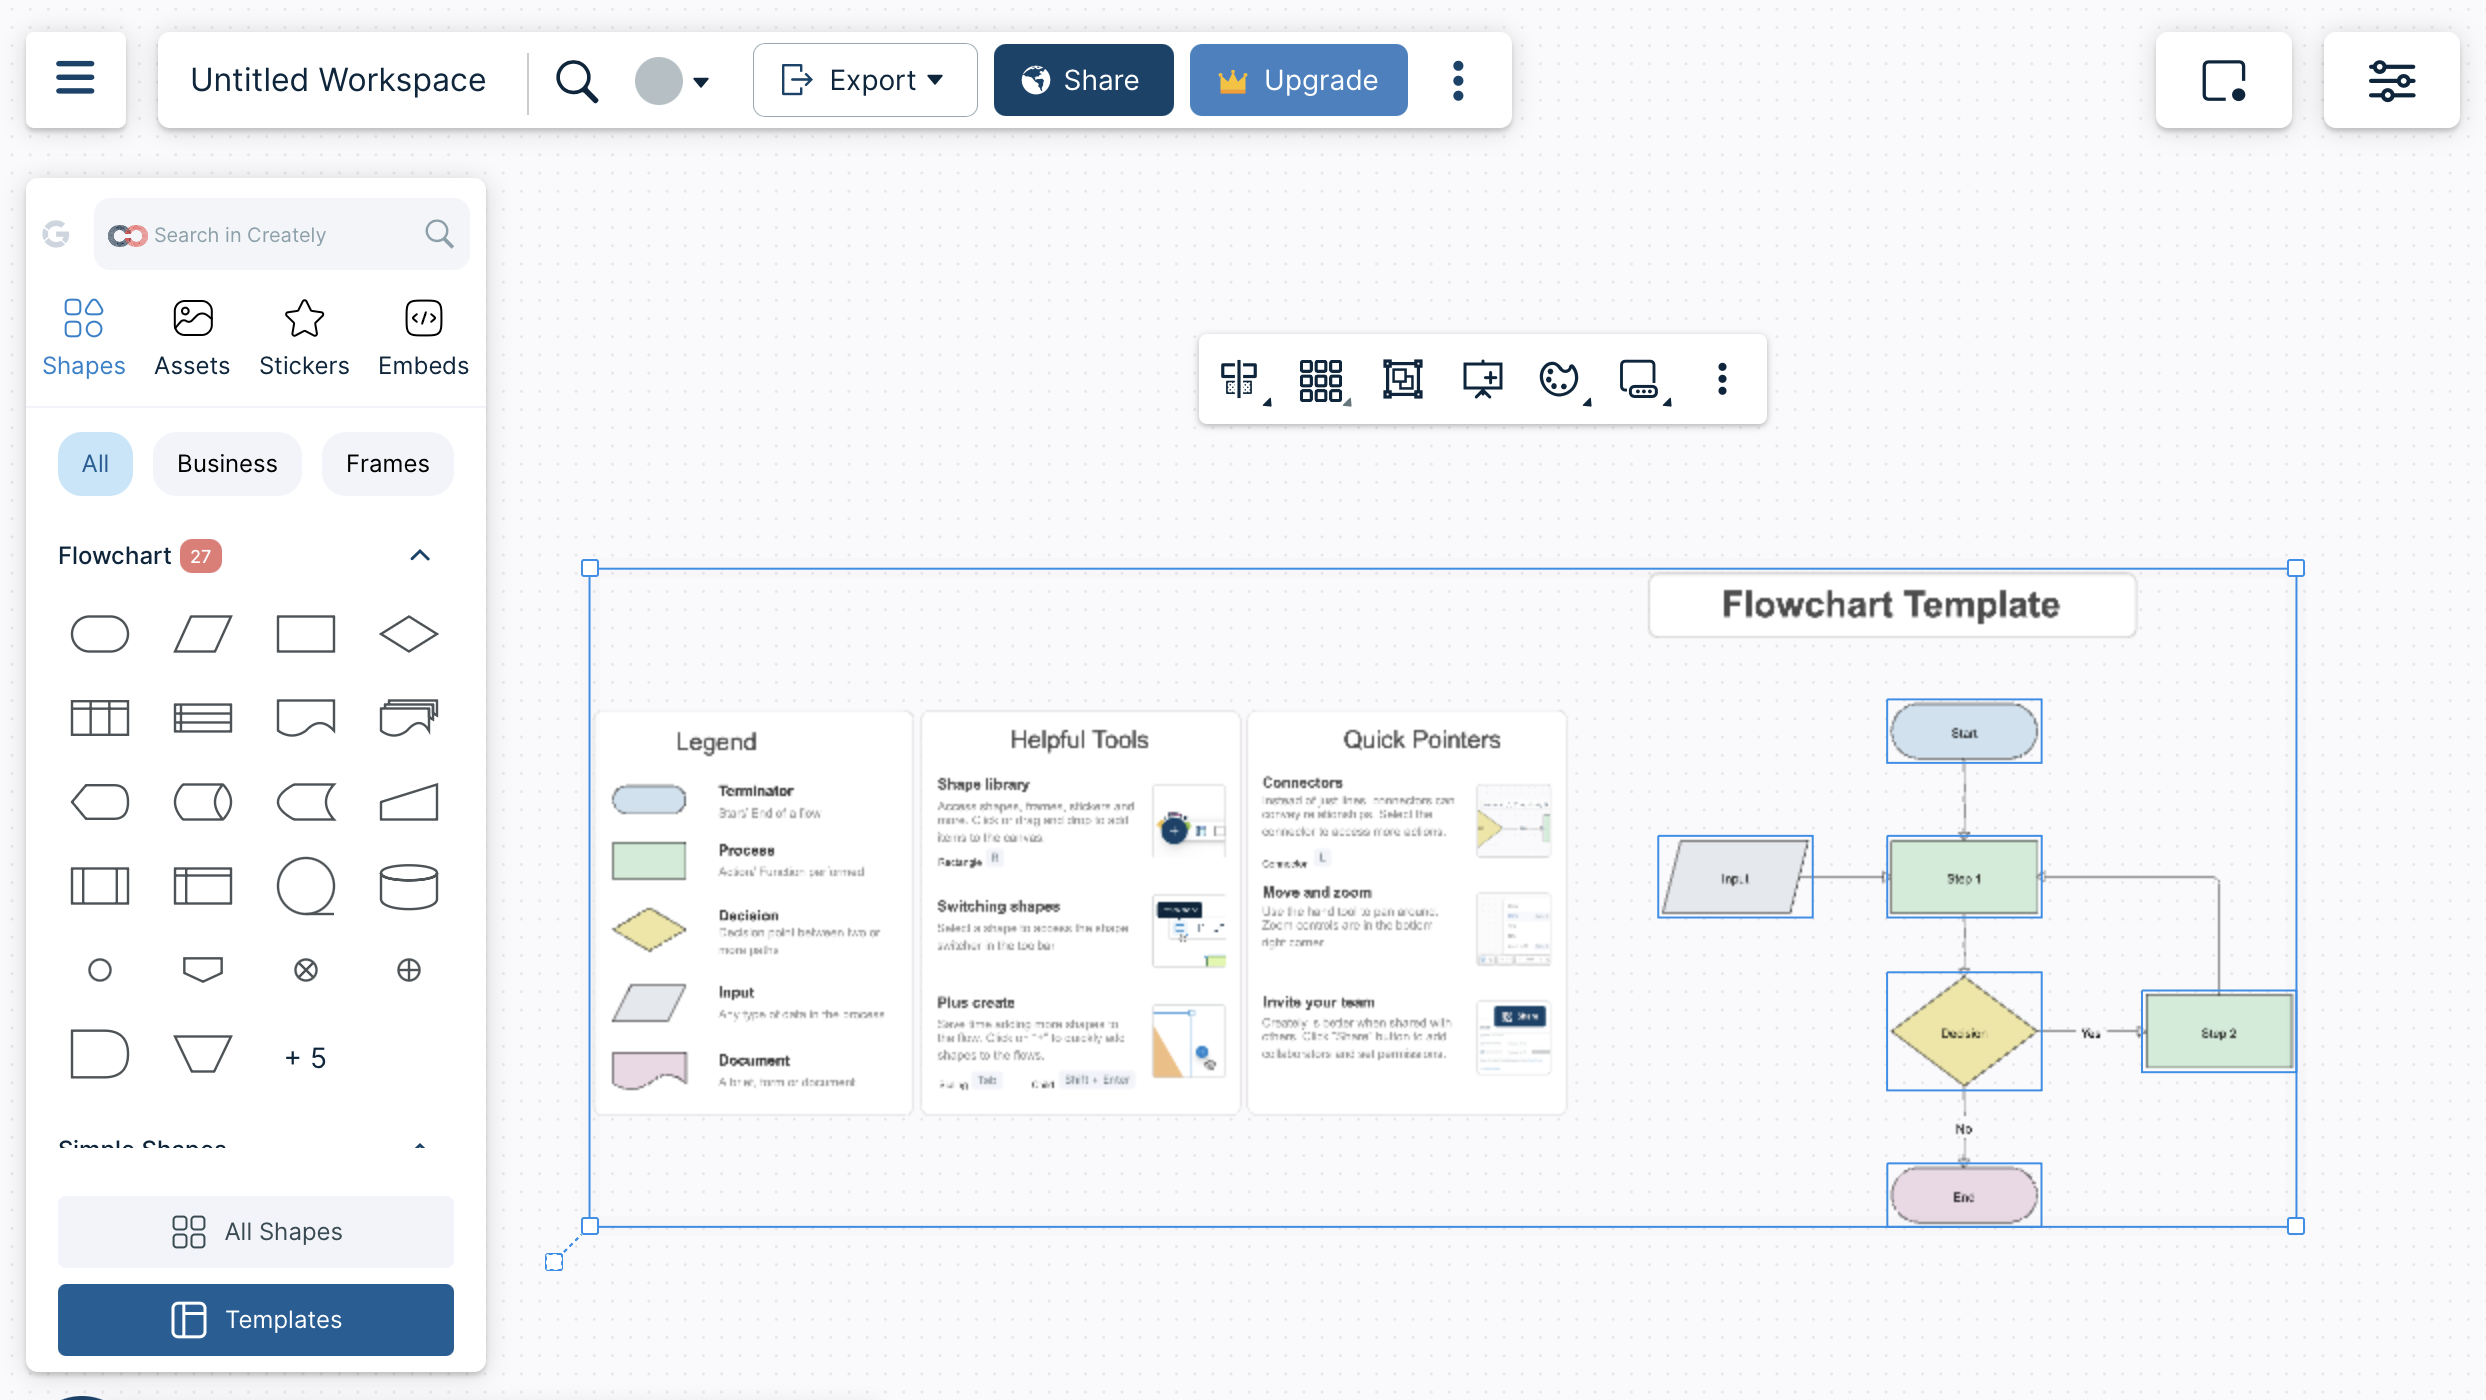
Source: Screenshot from Creately
Creately is a “visual collaboration” platform that bridges the gap between a simple flowchart maker and a full project management tool. I like it because it doesn’t treat a flowchart as a static image; it treats every shape as a “work item” that you can assign tasks and data to.
During my research, I found that it’s one of the few tools that offers a consistent experience whether you are on a web browser, a desktop app, or a mobile device.
Features
- 1-click create and connect: When you click a shape, it suggests the most likely next step and connects it automatically, which makes building a flow incredibly fast.
- Data-connected shapes: You can add “meta-data” to any box in your flowchart, like cost, owner, or status, effectively turning your diagram into a database.
- Multi-app syncing: It can pull in data from other apps like GitHub, Jira, and Slack, so your flowchart can reflect the real-time status of your projects.
- AI-powered generation: Similar to Venngage, it has built-in AI that can build diagrams from text prompts or suggest ways to expand your current flow.
Limitations
- While it has a mobile app, I found that editing complex flowcharts on a small screen is still quite difficult and prone to misclicks.
- Some users have reported minor glitches when using the “smart” connectors in very dense diagrams, requiring a manual refresh.
Pricing
- Free: Includes unlimited canvases but is limited to 45 items per canvas and basic collaboration.
- Personal: $8.00 per month. Includes unlimited items, unlimited storage, and all export formats.
- Team: $8.00 per user/month. Includes advanced collaboration tools and priority support.
- Enterprise: Custom pricing for advanced admin controls and unlimited data syncing.
How does flowchart software differ from other diagramming tools?
Flowchart software is specifically designed to create and represent workflows, processes and algorithms using standardized symbols and connectors, emphasizing sequence and decision points.
While other diagramming tools may cover a broader range of visual representations, such as mind maps, organizational charts or network diagrams, flowchart software is tailored to depict step-by-step procedural details, making it easier for users to visualize and understand complex processes or systems.
Microsoft flowcharting: Word vs Excel vs PowerPoint vs Visio
Most people don’t realize that almost every Microsoft app has basic flowcharting built in, but they are not created equal. Here is how they stack up based on my testing.
Which Microsoft program is best for flowcharts?
If you don’t have a Visio subscription, Excel is actually the best choice for flowcharts. Unlike Word, which forces you to work within the margins of a single page, Excel gives you an infinite “infinite canvas” feel. You can drag boxes anywhere, and it’s much easier to align shapes using the gridlines.
PowerPoint is the runner-up because it’s designed for visuals. It’s great for simple, high-level flows that need to look good in a presentation. Word should be your last resort; it’s a word processor, and trying to keep arrows connected while typing text is a recipe for frustration.
Does Office 365 have a flowchart tool?
Yes, all standard Office 365 plans now include a “light” version of Visio for the Web. It’s hidden in the “All Apps” menu of your Microsoft 365 dashboard. It’s significantly better than using SmartArt in Word because it actually has “smart” connectors that stay attached when you move shapes. It’s perfect for basic business processes, but it lacks the advanced engineering shapes found in the paid version.
Is Microsoft Visio free? How much does Visio cost per month?
The basic web version is free with most business-tier Microsoft 365 subscriptions. However, if you need the full-featured desktop app or advanced data-linking features, you have to pay extra.
- Visio Plan 1 (Web only): $5.00 per user/month.
- Visio Plan 2 (Desktop + Web): $15.00 per user/month.
AI flowchart generators (Text → Diagram) + ChatGPT workflows
The biggest shift in the last year is the ability to generate a flowchart without dragging a single box. If you have a long transcript or a messy process document, AI can now do the “logic” part for you.
Can ChatGPT make flowcharts?
ChatGPT cannot “draw” a flowchart file directly, but it can write the code that creates one. If you ask ChatGPT to “write Mermaid.js code for a login process,” it will give you a snippet of text. You can then copy that code and paste it into a free tool like Mermaid Live Editor or Eraser.io to instantly see the diagram.
Best AI flowchart tools
- Venngage: As I mentioned earlier, Venngage is the best for taking a simple text prompt and turning it into a polished, on-brand flowchart. It’s the fastest way to go from a prompt to a high-quality visual for a slide deck.
- Whimsical: Great for quick AI-assisted brainstorming. You can start with a central idea, and the AI will suggest the next logical steps in the flow.
- Taskade: Excellent for turning a project task list into a visual workflow diagram automatically.
Copy/paste prompt templates
To get the best results from an AI generator, be specific about the steps and the “decision” points. Use this template:
“Create a flowchart for [Process Name]. Start at [Step 1] and end at [Final Goal]. Include decision points for [Condition A] and [Condition B]. Keep the language simple and use a top-down layout.”
Safety note: Don’t paste sensitive data
Never paste confidential company data, client names, or proprietary code into a public AI tool or ChatGPT. Most AI models use your inputs to train their systems. If you are mapping out a sensitive internal process, use the “Private” or “Enterprise” modes of tools like Venngage or Lucidchart, which offer data encryption and don’t use your prompts for training.
Best flowchart software FAQs
Which flowchart software is the most user-friendly for beginners?
Based on our research and analysis, we highly recommend Venngage as it provides one of the most user-friendly flowchart tools for beginners. It also offers intuitive drag-and-drop interfaces, pre-designed professional flowchart templates and straightforward editing capabilities making them accessible for those new to flowcharting.
Can flowchart software be used for process mapping and business analysis?
Absolutely! Flowchart software is often used for process mapping and business analysis. Process mapping involves illustrating the steps involved in a process, making it easier to identify inefficiencies, redundancies or areas of improvement.
Flowchart software provides a visual means to map these processes, using standardized symbols to represent different activities, decision points and flow directions.
Business analysts frequently use this kind of software to visualize complex business procedures, which helps in understanding, communicating and optimizing these processes.
Related: 21+ Process Flowchart Examples for Business Use
Is flowchart software suitable for non-technical users?
Yes, many flowchart software tools are designed to be intuitive and user-friendly for both technical and non-technical users.
Can I integrate flowchart software with other business tools?
Yes, many flowchart software solutions offer integrations with other business tools, such as project management platforms, CRM systems and collaboration tools.
Can flowchart software be used for educational purposes, such as in classrooms or online courses?
Yes, flowchart software can be used for educational purposes in both classrooms and online courses. It aids in visually representing and explaining complex concepts, processes or ideas, enhancing students’ understanding and engagement.
Can I use diagramming tools to create flowcharts, mind maps, org charts, and other types of visual representations?
Yes, plenty of diagramming tools offer versatility in creating various visual representations, including a variety of flowcharts such as problem-solving flowcharts, cross-functional flowcharts, mind maps, organizational charts, and even tree diagrams, all within the same platform.
What is the best flowchart Software For Mac?
The best flowchart software for Mac can vary based on individual needs, preferences, and budget but Lucidchart emerges as a popular choice among Mac users as they are known for their user-friendly interfaces, extensive template libraries, and powerful features.
Which are the popular open-source flowchart software options?
Draw.io (also known as diagrams.net) is a popular open-source online diagramming tool that supports various types of charts and diagrams, including flowcharts, and allows for integration with various cloud storage solutions.
Bottom line
Flowcharts are invaluable for streamlining the visualization of processes, project workflows, and innovative ideas. By understanding what each software offers, you can make an informed decision when selecting the best tool for your requirements.
Ready to transform your ideas into visual masterpieces? Start your journey with Venngage’s Flowchart Maker & Venngage’s Flowchart Template today!


