


Whether at school or work, I’m you’ve used bar charts or histograms to present complex data in an easy-to-understand format.
These charts are loved for their simplicity, clarity, and are widely used to share financial or sales analysis, market research, or ensure quality control.
And though they may look really similar, bar graphs and histograms actually have different use cases.
So how can you determine when to use one over the other?
In this post, I’ll go over what a bar chart and histogram are and then do a breakdown of bar charts vs histograms or histogram vs bar graph to help you understand the similarities and differences.
Before I move on, remember that making a bar chart is incredibly easy with Venngage’s Bar Graph Maker or check out our bar chart templates to make one in minutes.
Let’s get started!
Note: Some of our bar chart templates are free to use and some require a small monthly fee. Sign-up is always free, as is access to Venngage’s online drag-and-drop editor.
What is a bar chart?
A bar chart, also known as a bar graph and column chart, is a type of chart that uses rectangular bars of varying lengths or heights to represent and compare numerical data.
Bar charts are great for data sets made up of distinct categories, like survey responses or product types. Each data point belongs to a clear, separate group. Here’s how:
- Vertical bar chart – Best for comparing values across categories like product sales or survey results.
- Horizontal bar chart – Ideal when you have long category labels or limited vertical space.
- Stacked bar chart – Useful for showing how sub-categories contribute to a whole within each main category.
- Grouped bar chart – Great for comparing multiple related variables across categories (e.g., sales by product and region).

When should you use a bar chart?
Bar charts work best when you want to compare and display data across different categories.
Choosing the right chart helps make patterns in your data set more visible and your message more accurate. It’s all about matching the visual to the w
ay your data is built.
Here are some situations where you’ll want to pick a bar chart:
Compare and contrast data
If you want to compare data or values associated with different categories, a bar chart is a natural go-to choice.
The rectangular bars of various lengths and heights make it easy to visualize and evaluate differences at a quick glance.

Track changes
Trying to track changes or trends over time?
Well, you’ll want to go with a bar chart as it lets you plot data over time to see changes.
The use of bars allows easy identification of patterns, shifts, or fluctuations. Also, you can enhance your analysis by using colors or trend lines to highlight the direction and magnitude of changes.
This makes a bar graph the perfect tool for tracking sales figures, market trends, or any other time-based data.

Visualize qualitative data
Besides numbers, bar charts can also help you visualize qualitative data.
For example, let’s say you wanted to present global access to HIV treatment.
Well, with a bar chart, you can actually use qualitative points such as those who had access and those who didn’t and plot it on a chart. The height of the bar would then represent the frequency.

Advantages and limitations of bar charts
Although bar charts are useful at times, they do have limitations as well.
By recognizing their advantages and limitations, you will be able to make better decisions when picking a type of chart.
Let’s take a look:
Advantages
- Easy to understand
Bar charts provide an easy-to-understand visual representation of data. The presence of bars makes it simple to compare different categories or variables.
- Flexible presentation options
With many types of bar graphs, such as vertical, horizontal, and stacked bar charts, there are endless ways to present your data.
Limitations
- Less effective for large datasets
As the number of categories or data points increases, the bars can become crowded and make it challenging to interpret or compare the data accurately.
- Lack of preciseness
The lengths of a bar only give a general sense of relative values and are not exact numerical measurements. This makes it hard to make precise comparisons between different bars.
What is a histogram?
A histogram is a visual representation of the distribution of data.
It consists of adjacent rectangular bars, where the width of each bar represents a range of values, and the height shows how many data points fall within that range — that’s the frequency. Depending on how it’s set up, a histogram can show raw counts or relative frequencies (like percentages), which makes it flexible for comparing distributions across different datasets.
One important thing to note is how the x-axis works: in histograms, it displays continuous intervals, like age ranges or income brackets. In contrast, bar graphs use the x-axis to show distinct categories, like job titles or product names.
They may look almost identical to bar graphs at first glance, so it’s easy to get them mixed up — but they tell very different stories about your data.
Here’s an example:

In histogram terminology, the range of values along the x-axis is divided into bins, also known as class intervals. Each bar in the histogram represents one of these intervals and shows how many data points fall within that range. So if you’re charting something like ages, one bin might cover ages 20–29, the next 30–39, and so on.
These bins are usually equal in width to keep things consistent and make the distribution easier to read. It’s a small detail, but it plays a big role in how clearly your data comes across.
Before creating a histogram, it’s common to organize your data into a frequency table. This table lists each bin or class interval alongside the number of data points that fall within it. It’s a simple but powerful step — giving you a clear overview of your distribution and making the plotting process much smoother.
When should you use a histogram?
Histograms are useful when dealing with continuous data or when data points are limited to a numerical range.
For example, temperature readings, time measurements, and weight measurements are all types of continuous data.
Here are some scenarios where a histogram is the better choice:
Distribution analysis
Ever faced a scenario where you need to understand the shape of data?
This is a common situation in various professions such as finance, insurance, and market research.
For example, let’s say a financial analyst wants to analyze the shape of data related to stock returns in terms of a normal, skewed, or another distribution pattern to analyze portfolio performance and measure risk assessment.
Well, there’s no better way than a histogram.
In this example, a histogram helps scientists determine the average height of two different varieties of wheat.

Statistical analysis
Histograms are also extremely useful in any type of statistical analysis work.
By providing a visual representation of data, it becomes easy to spot patterns and variability, allowing for more informed decision-making.
For example, a government agency may use a histogram to analyze the distribution of income in a population to visualize points such as mean and median to assess the effectiveness of its policies.

Identify outliers
Sometimes unusual or outlying data which may have significant implications gets missed by bar charts.
But a histogram allows easy detection of any extreme values or outliers that fall outside a typical range.
Again, this has a practical application in many professions.
For example, a company’s marketing team might want to find outliers in customer behavior, such as unusually high or low spending patterns, to identify fraud or target segments that require unique marketing strategies.

Advantages and limitations of histograms
Advantages
- Easy to identify patterns
Histograms make it easy to visualize patterns and understand the shape, symmetry, and skewness of data, which gives unique insights into the data.
- Detection of outliers
Detecting anomalies in data or extreme values outside a typical range is easy with a histogram.
Limitations
- Manual statistical calculation
Histograms require you to manually calculate statistical measures such as mean, median, or standard deviation. This can not only be time-consuming but also lead to errors.
- Restrictive data type
Histograms are only effective for data that falls within a range and not when you have qualitative variables to study.
What is the difference between a histogram and a bar graph?
The main difference between a histogram and a bar graph is the type of data they visualize. Although both use vertical bars, they serve distinct purposes.
When working with any data set, the first step is understanding its structure — are you dealing with categories or continuous numbers? That choice directly affects whether a bar chart or histogram is the better fit.
A bar graph is used to compare discrete or categorical variables — like types of fruit (apple, banana, orange) or job titles (manager, assistant, analyst). Each bar represents a separate category, and there are clear gaps between them to emphasize that the categories are unrelated.
A histogram, on the other hand, shows the frequency distribution of continuous data. That means it groups numbers into ranges (or bins) and shows how many values fall into each range. For example, a histogram could display how many people fall into different height ranges — like 150–159 cm, 160–169 cm, and so on. The bars touch because the data is part of a continuous scale.
In short: bar graphs = categories, histogram = number ranges.
Not sure whether to use a histogram or bar graph? Here’s a detailed breakdown:

Want to explore more ways to visualize your data? Check out our guide to different types of graphs to see which one fits your data best — from pie charts to scatter plots and everything in between. It’s a great next step if you’re trying to level up your data storytelling.
Real-world use case examples
Here are real-world examples that highlight when to use bar charts versus histograms, based on whether you’re working with categorical or continuous data.
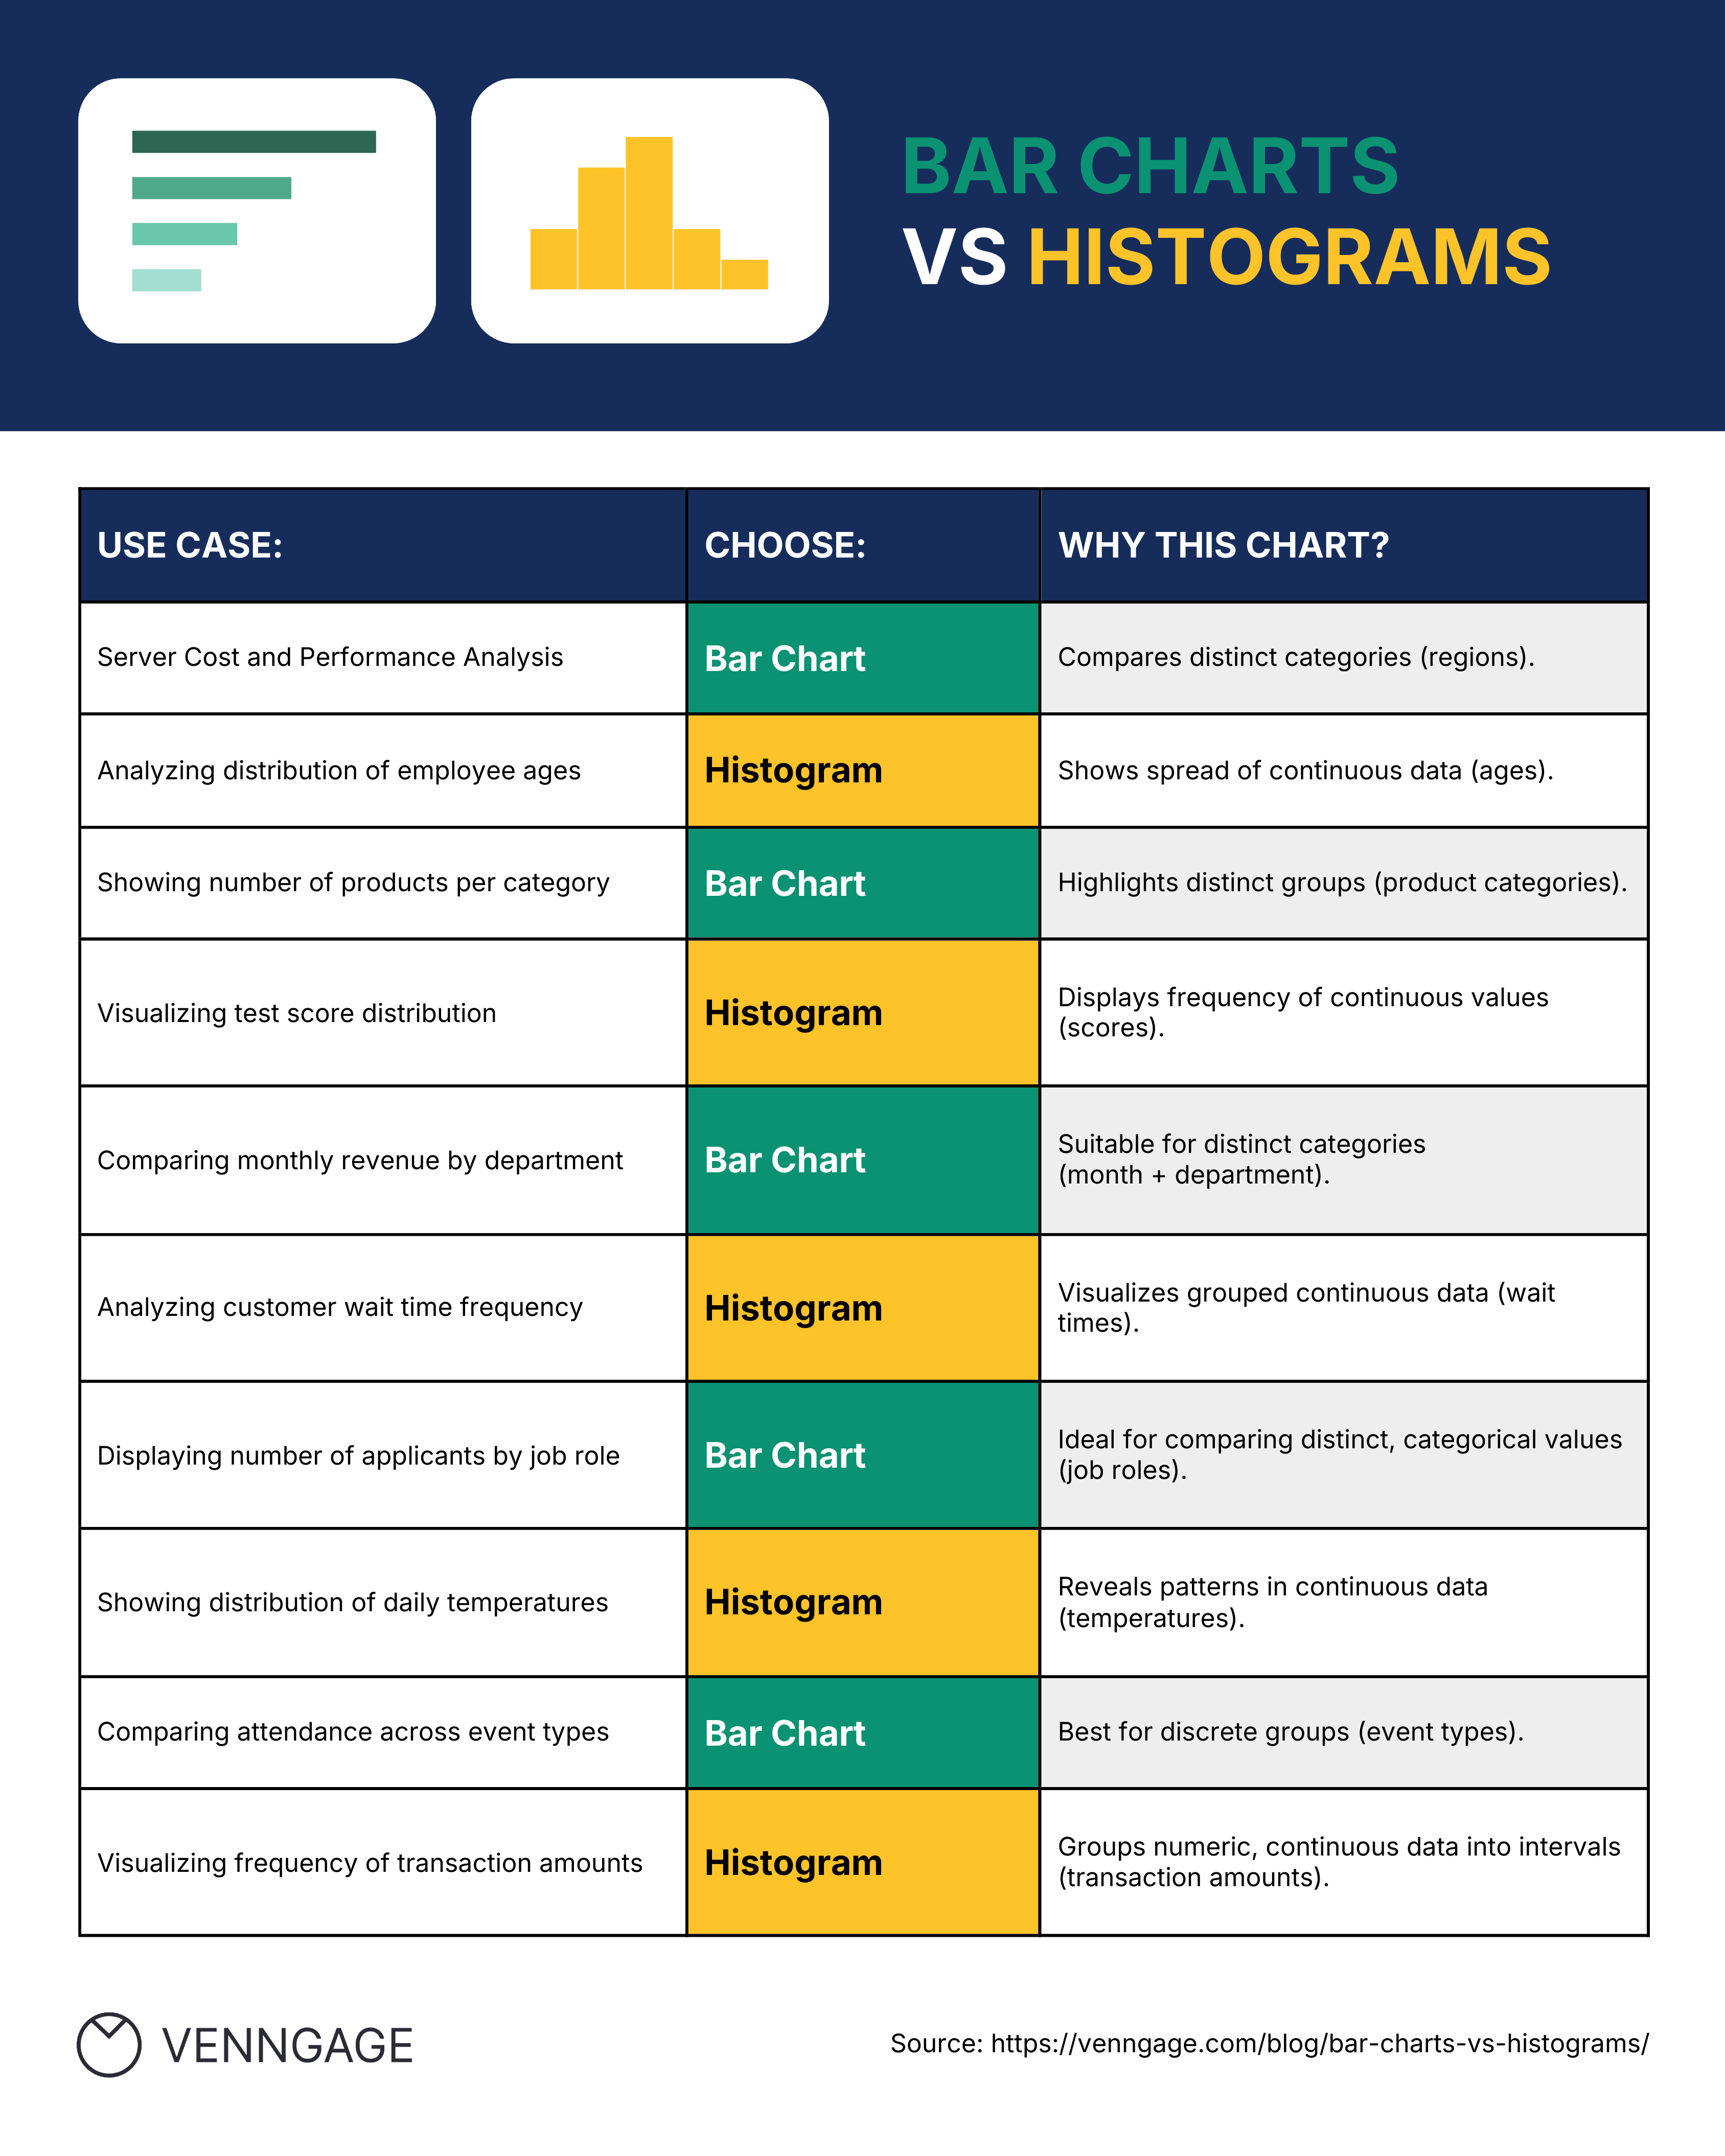
Categorical vs. continuous data
One of the most important things I’ve learned when working with data is that how you visualize it really depends on the type of data you have — specifically, whether it’s categorical or continuous.
- Categorical data is made up of named groups or labels — like colors, job roles, or survey responses. These aren’t measured with numbers; they’re sorted into distinct categories. A bar chart is ideal here because it shows how each group compares.
- Continuous data, on the other hand, involves numbers that flow along a scale — like height, weight, or time. These values can fall anywhere within a range. That’s where histograms come in. They let you group data into intervals (or bins) to see how it’s distributed.
If you’re ever unsure which to use, just take a step back and ask: Am I comparing categories or analyzing number ranges? That simple check can make a big difference in how clearly your data story comes across.
How to create a bar chart with Venngage
Due to their popularity, there’s no shortage of ways to make a bar chart.
The options include drawing it out by hand, using Office tools like Word or Excel, or turning to Google Sheets or Docs. But while these are familiar, they can be limiting when it comes to customization, styling, or ease of use — not to mention the learning curve.
By far, your best bet is Venngage.
Creating a bar chart with Venngage is simple and intuitive. With a user-friendly drag-and-drop interface, anyone can design a professional-looking chart — no design background needed. You’ll find a variety of customizable bar chart templates to get started quickly. I’ll walk you through a few simple steps in the section below.
But if you want to show data changes over time, try creating an animated bar chart to bring your visuals to life. It’s a powerful way to show growth, trends, or shifts in rankings in a more engaging way.
Just plug in your data, tweak the design to match your branding, and you’re good to go!
Step 1 – Sign up for a free account
Start by signing up for a Venngage account using your email, Gmail or Facebook account.
Remember, it’s completely free!
Step 2 – Select a template from our library
Besides the examples I shared above, you’ll find many other bar chart templates to choose from. Just pick one you like to start editing.

Step 3 – Use our editor to edit your bar chart
Our bar chart templates let you replace the filler data with your own to make the process as painless and fast as possible.
Other items you can change or replace include the colors, text, and layout. Just drag to move elements around and experiment!

Here’s a better look:
Step 4 – Bring your bar chart to life with icons, illustrations and branding
Venngage offers 40,000 icons and illustrations to help you visualize and bring bar charts to life.
If you upgrade to a Business account, you can also enjoy My Brand Kit — the one-click branding kit that lets you upload your logo and apply brand colors and fonts to any design.
And that’s all there is to it. Creating a bar chart has never been easier!
FAQ
Why choose a bar chart over a histogram?
You should choose a bar chart when you want to compare different categories or types of data. But if you want to understand the distribution and frequency of a single set of data, go with a histogram.
Do histograms and bar graphs look the same?
Although histograms and bar graphs look similar, they are not different names for a single type of chart. They are different since a bar chart is used to compare categorical data while histograms are used to analyze the distribution of data.
What makes a histogram misleading?
Histograms can give you the wrong impression if the bins (or intervals) aren’t chosen carefully. For example, using bins that are too wide can hide important patterns, while uneven bins can exaggerate or downplay parts of the data. It’s a good reminder that how you frame data really matters.
Can histograms have gaps?
Not usually. Histograms represent continuous data — think measurements like age, weight, or time — so the bars should touch. If you see gaps, it might mean something’s off, unless a bin has zero values.
When should I use a histogram instead of a bar chart?
If you’re working with continuous numerical data and you want to understand how it’s distributed (like test scores or sales amounts), go with a histogram. Bar charts are better when you’re dealing with categories like product types or survey responses. I like to think of it as: Histogram = ranges. Bar chart = labels.
What is the difference between a histogram and a vertical bar chart?
This is one of the most common mix-ups I’ve seen. Histograms show how data is spread across intervals — and the bars touch because the data is continuous. Vertical bar charts, on the other hand, show categories and have space between bars. A quick side-by-side visual can really help here.
What is the difference between a histogram and a line graph?
They look similar, but they serve very different purposes. Line graphs are great for showing trends over time — like stock prices or monthly expenses. Histograms show how often values fall within certain ranges. One tracks change, the other shows distribution. I like using them together sometimes to tell a fuller story.
Is a bar chart the same as a bar graph?
Most people use the terms interchangeably — and that’s totally fine in everyday conversation. Technically, some experts use “bar chart” to describe the visual more formally, but either term works. What matters most is clarity and consistency in your communication.
Do the bars in a histogram touch?
Yes, and that’s one of their defining features. Since histograms deal with continuous data, the bars should touch to show that there are no gaps in the range. It’s a small detail that makes a big difference in how people read the chart.
Is a histogram a type of bar chart?
Kind of — they both use bars, but their purpose and structure are different. Some folks call histograms a subtype of bar chart, especially in informal settings. But histograms specifically show frequency distributions of continuous data, so they really deserve their own spotlight.
Can bar charts show frequencies too?
Absolutely. Bar charts can show how often different categories appear — like the number of customers per region. The key difference is that histograms show frequencies for data grouped into intervals, while bar charts show them for distinct categories. A quick tip: If your data has names or labels, go with a bar chart. If it has measurements or ranges, use a histogram.
In conclusion: Understanding the differences between bar charts and histograms leads to effective data visualization
Better data interpretation starts with choosing the right chart type. Knowing when to use a bar chart versus a histogram isn’t just a technical detail — it’s key to making your data clear, accurate, and impactful.
It might feel a bit confusing at first, but once you’ve worked with both, it becomes second nature to recognize which one fits your dataset best.
And if you’re ready to create bar charts that stand out, Venngage’s Bar Graph Maker and bar chart templates are here to make the process easy — so your presentations and reports get the attention they deserve!


