


I’ve been in the content marketing industry for over six years now, first as a writer and now as a content strategist. And for most of the journey, SEO has mainly meant one thing: optimizing text.
Most brands followed a similar SEO checklist: Add the primary keyword in the introduction, hit that 2% keyword density and add NLP terms for context. Some even made it mandatory to meet the Yoast transition word score even if that meant forcefully adding words. (Yikes!)
But images weren’t considered too important for seo, until recently. They were, of course, useful for breaking up text or getting the occasional click from Google Images, but rarely optimized beyond basic alt text.
That’s changing now with the rise of multimodal search and LLMs. AI tools are pulling visuals directly into search responses. Browsers like Atlas are displaying images, videos, and links together in one feed. Your images now share the same responsibility as your words in helping content get discovered.
In this article, I’ll explain why optimizing visuals matters, how LLMs retrieve and interpret images and how to make your visuals searchable, visible, and on-brand.
Why should you focus on visual SEO
The year has been a rollercoaster for marketers. SEO has become an alphabet soup — AIO, AEO, GEO — each trying to define what optimization means in the age of AI. But if you strip away the jargon, it all points to one thing: making your content easier for large language models to read, interpret and share.
AI search is driving more traffic
Here’s what most people miss: AI search isn’t just growing. It’s fundamentally different from traditional search in ways that create massive opportunities for visual content.
According to Semrush’s study on AI search and SEO, LLM visitors are 4.4x more valuable than traditional organic visitors in terms of conversion, and AI search is projected to overtake traditional search entirely.
Being visible in AI results is extremely important now. If you’re not optimizing your visuals, you’re missing out on opportunities to appear in AI search.
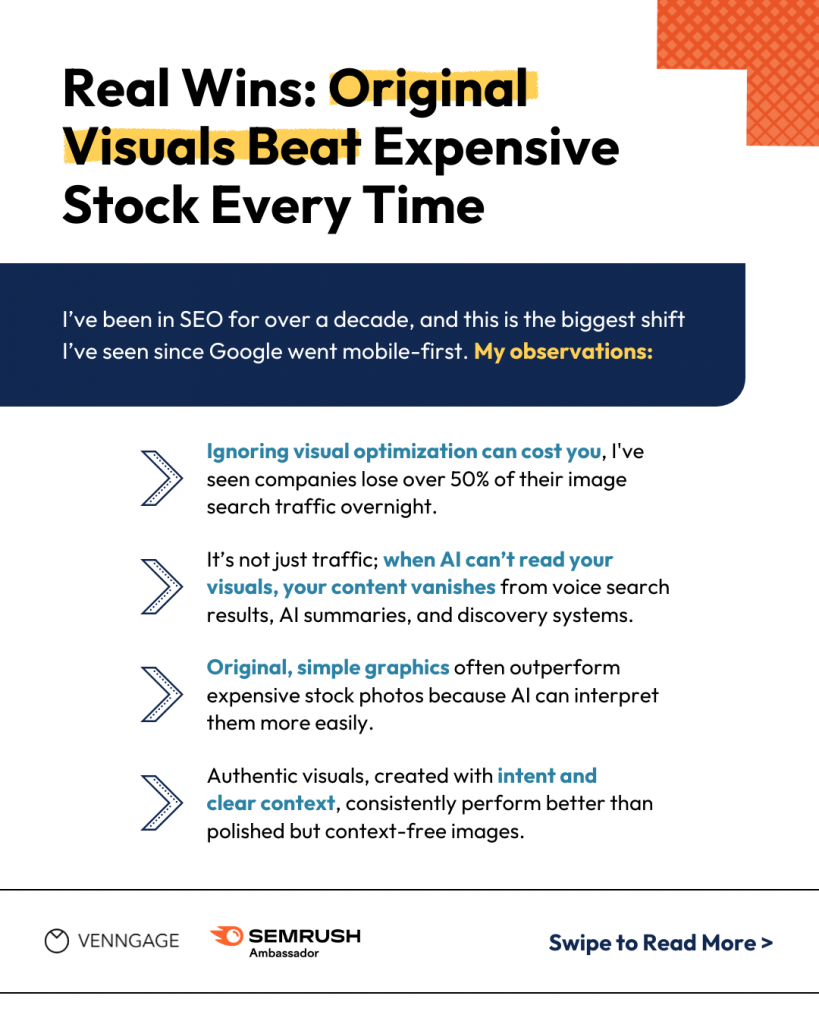
Shubham Sharma, the SEO lead at Tru and a Semrush Ambassador, says that “We’re facing the biggest shift since Google went mobile-first.”
“The real cost? I’ve watched companies lose 50%+ of their image search traffic overnight. But it’s deeper than traffic. When AI can’t interpret your visuals, you’re excluded from voice search answers, AI summaries, and the future of how people find information.”
Shubham Sharma, SEO Lead at Tru and Semrush Ambassador
Related: Design & Marketing Trends 2026 — The Shifts That Will Shape What’s Next
Multimodal search is increasing
Multimodal means AI can process more than one type of input at once — combining text, images and even video, to understand a query better.
While tools like ChatGPT, Gemini, or Perplexity might not always display visual content for every query, Atlas does. That alone signals a shift toward multimodal search, where text, visuals and data all work together to deliver richer answers.
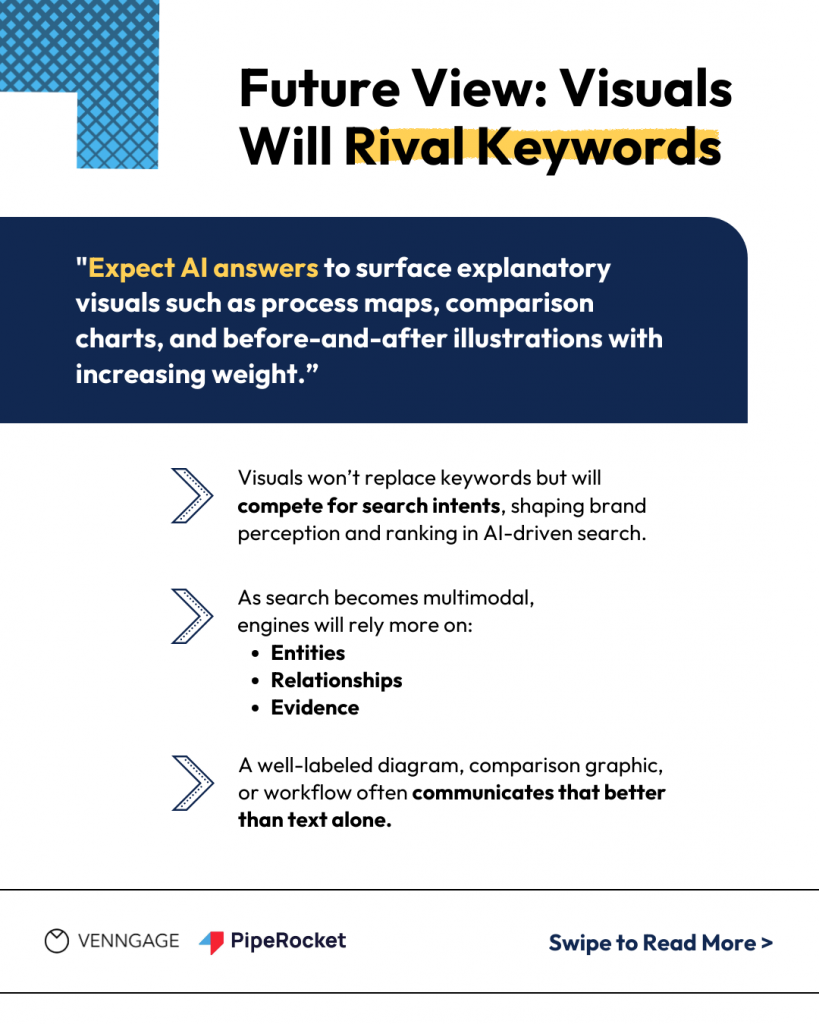
Vignesh D., SEO specialist at PipeRocket Digital, says that with multimodal search, visuals will rival keywords for many intents.
“As search becomes multimodal, engines lean on entities, relationships, and evidence; a well-labeled diagram or workflow often communicates that better than text alone. Expect AI answers to surface explanatory visuals (process maps, comparison charts, before/after).”
Vignesh D., SEO Specialist at PipeRocket Digital
Visuals can also increase LLM visibility. For example, I wrote an article on how to create a B2B white paper a while ago.

Atlas does not cite the article link, but the visual checklist I created for designing a B2B white paper appears at the top in the images section.

How do LLMs retrieve visuals?
ChatGPT, Gemini, or any other LLM model doesn’t have its own live database of visuals. It relies on the same visual ecosystem that powers traditional search — Google, Bing, and other engines that crawl and index images across the web.
Here’s how that process works in practice:
Step 1: Query Interpretation
The model first understands your intent. If you ask for “social media marketing infographics,” it breaks that down into semantic components (topic + format + context) to form a search-friendly query.
Step 2: Web search API call
The AI doesn’t have images stored internally. Instead, it actively searches the web in real time using integrated search tools:
- ChatGPT uses a web search function (often powered by Bing) that queries live search engine indexes.
- Claude uses a similar web search tool that retrieves current results from search engines.
- Perplexity and Copilot rely on Bing and internal indexes.
This happens instantly, within seconds of your request.
Step 3: Search results processing
The model evaluates which images best match the intent, using signals such as:
- File names and alt text relevance
- Structured data (
ImageObject,primaryImageOfPage) - Page authority and content alignment
- Freshness and safety filters
Step 4: Image display
Once filtered, the model displays visuals in the chat interface by embedding live URLs from the search engine results. It also provides attribution links to the source websites.
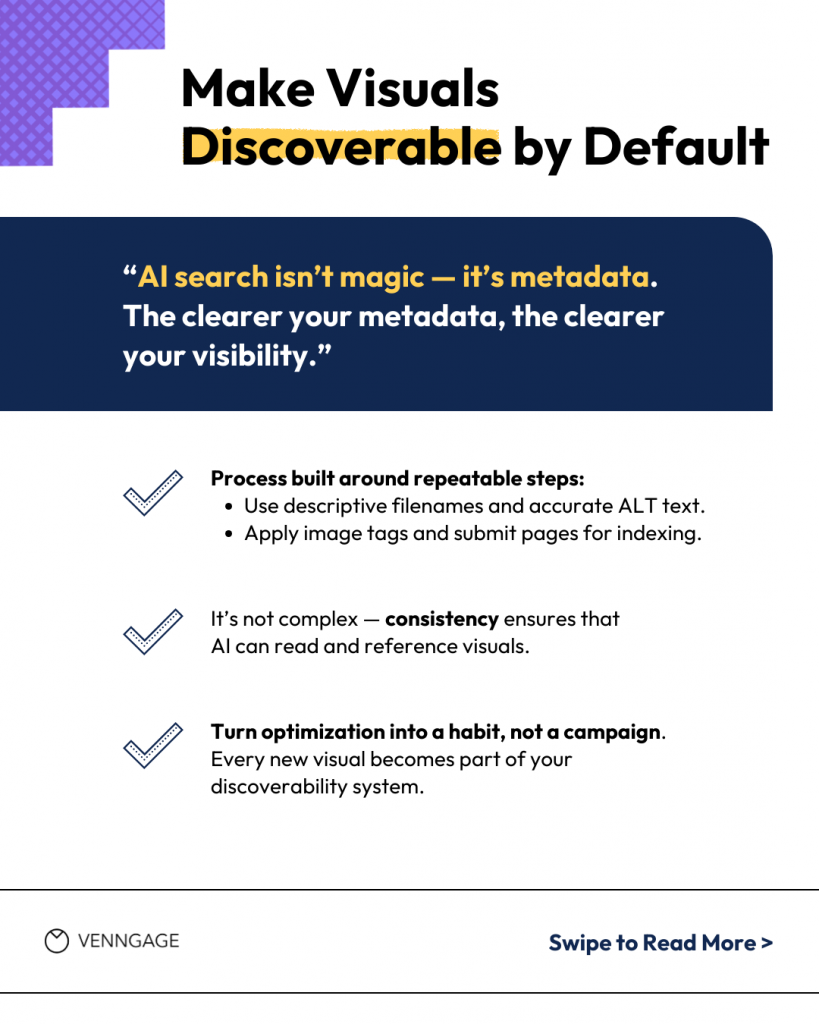
Divyanshu Jangid, SEO lead at Venngage, says, “AI search isn’t magic — it’s metadata. The clearer your metadata, the clearer your visibility.”
Why this matters for your SEO
Since these AI tools search the web actively, your images can appear if they’re:
- Properly indexed: Search engines must have crawled and indexed your images.
- Rank well: Your images need to appear in the top search results for relevant queries.
- Load correctly: Broken links, slow servers or blocked resources prevent display.
- Have proper metadata: Alt text, filenames and surrounding content help match to queries.
- Meet technical requirements: Proper formats, sizes and accessibility standards.
How to optimize visuals for search engines and LLMs
Now that you know how LLMs process and retrieve images, let’s understand the best ways to optimize visual content for SEO and AI search.
1. Use descriptive Alt text
AI systems parse alt text along with page context to understand the visual. Google prompts you to write useful alt text and in context, not stuffed with keywords or generic labels.
A poor example shows “puppy dog pup…”, while a strong one reads “Dalmatian puppy playing fetch.”
- Aim for about 80 to 125 characters. Keep it concise yet descriptive. Here’s a weak label: chart.png alt=“chart”
- Stronger label: alt=”Bar chart showing Q4 SaaS revenue growth of 25% year-over-year.”
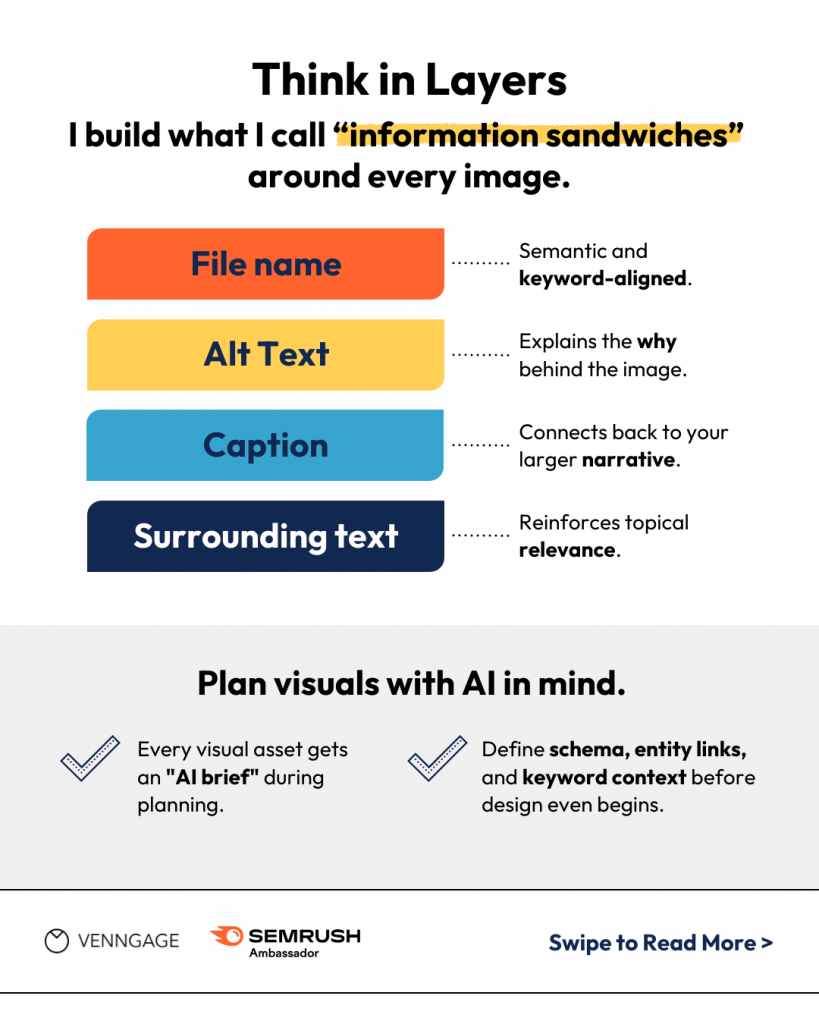
Tip the balance toward actual meaning, not just naming. A good image alt text ties the visual into your article’s idea. Screen readers and AI both reward clarity and context.
“Stop describing, start explaining. Don’t tell me your image shows “a woman using a laptop.” Tell me it shows “remote work productivity techniques for distributed teams.” AI systems need context, not just descriptions. Think in layers. I build what I call “information sandwiches” around every image.”
Shubham Sharma, SEO Lead at Tru
2. Schema markup for visual content
Structured data signals help AI recognize the importance of your visuals. Use ImageObject schema for charts, infographics and diagrams.
For ecommerce, combine Product schema with ImageObject so the image ties to a recognized concept. Place the markup in JSON-LD for clarity. It might look like this in your code:
{
  "@context": "https://schema.org",
  "@type": "ImageObject",
  "contentUrl": "https://example.com/product.jpg",
  "caption": "Front view of X-series running shoe showing cushion design",
  "representativeOfPage": true
}
That caption and flag tell Google and AI assistants “this image matters.” Schema can earn rich snippets, boost CTR and get images into AI overviews.
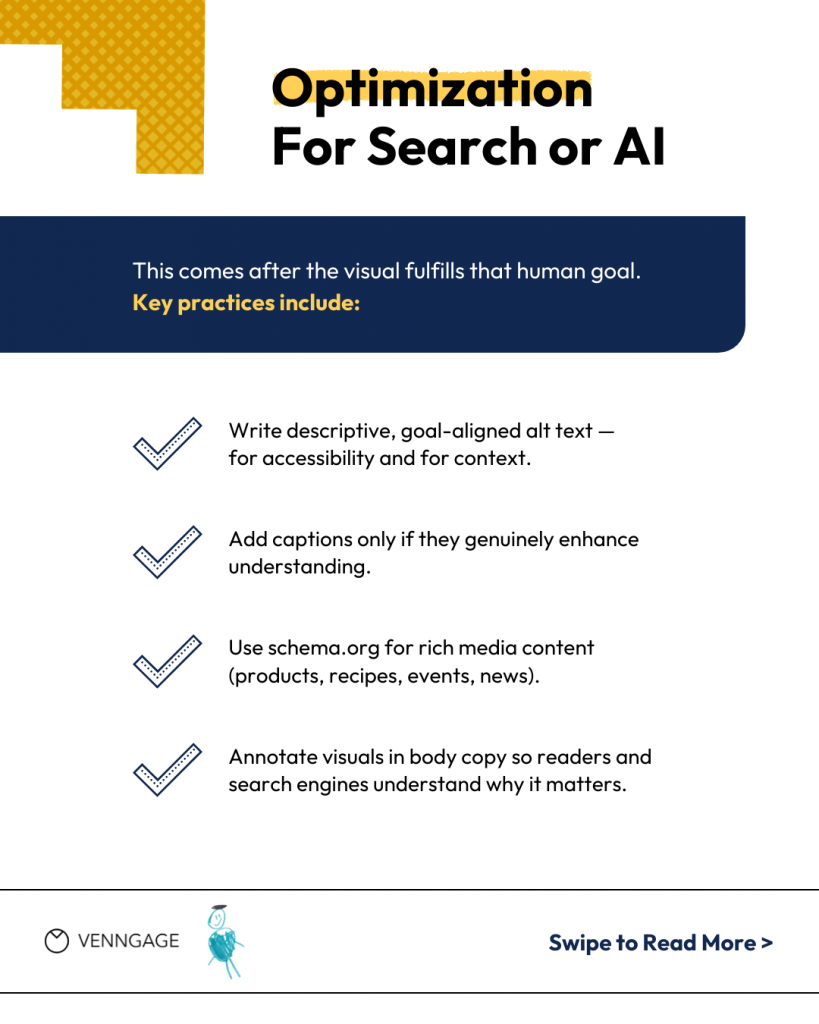
“Schema.org is usually critical when dealing with content that produces rich snippets, such as products, recipes, events, or articles/news that might be featured in a carousel.”
Steve Liu, SEO and Content Consultant
3. Core web vitals optimization for images
AI and human users favor pages that load smoothly and keep layout shifts minimal. Content structured for clarity and directness also performs better in optimize content for google ai overviews, where machine learning models prefer concise, citation-ready formats that can be extracted and referenced accurately. Use modern image formats like WebP or AVIF instead of older JPG or PNG files.
Compress with tools like TinyJPG or Compress PNG. Always set width and height attributes to eliminate layout shifts and improve LCP performance.
4. Mobile and accessibility requirements
Visuals must be readable across devices and inclusive to all audiences. For charts and infographics, keep fonts at least 14 px and use high-contrast colors.
Provide visible captions or transcripts for data-heavy visuals. Make sure images resize properly on any screen. Accessible designs benefit AI just as much as humans because screen readers and AI agents rely on many of the same signals.
5. Natural integration through AI-powered design tools
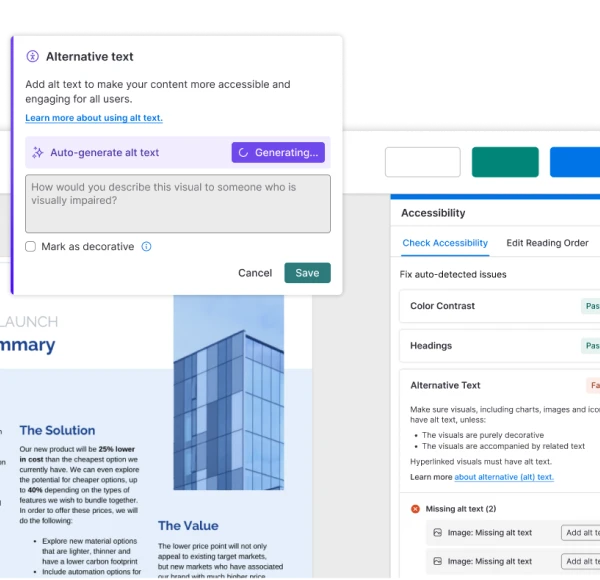
The easiest way to keep visuals AI-ready is to make them accessible. You can use AI-powered accessibility tools that help you add alt text on the go, offer colour-blind-friendly palettes and export files with metadata-friendly names.
Venngage takes care of most of these details so you can spend less time fixing and more time creating. It also makes optimization less manual and more built-in.
What visual content actually works in AI search
Not too long ago, we used visuals only for aesthetic value. But in the AI era, every chart, photo or diagram you publish is raw material for algorithms. Optimize it and it turns into a valuable citation. Ignore it, and it just stays there as a decorative add-on.
1. Charts with clear labels
Machine learning models and AI overviews prefer visuals that distill data directly. Think different types of charts with labels. This format helps AI extract specific figures and trends.
2. Infographics that summarize data
AI tools cite visuals that organize facts visually. Infographics that pair concise numbers with context are far more likely to get referenced by AI engines. Structured visuals are exactly what Generative Engine Optimization (GEO) encourages; formats AI can interpret and include in answers.
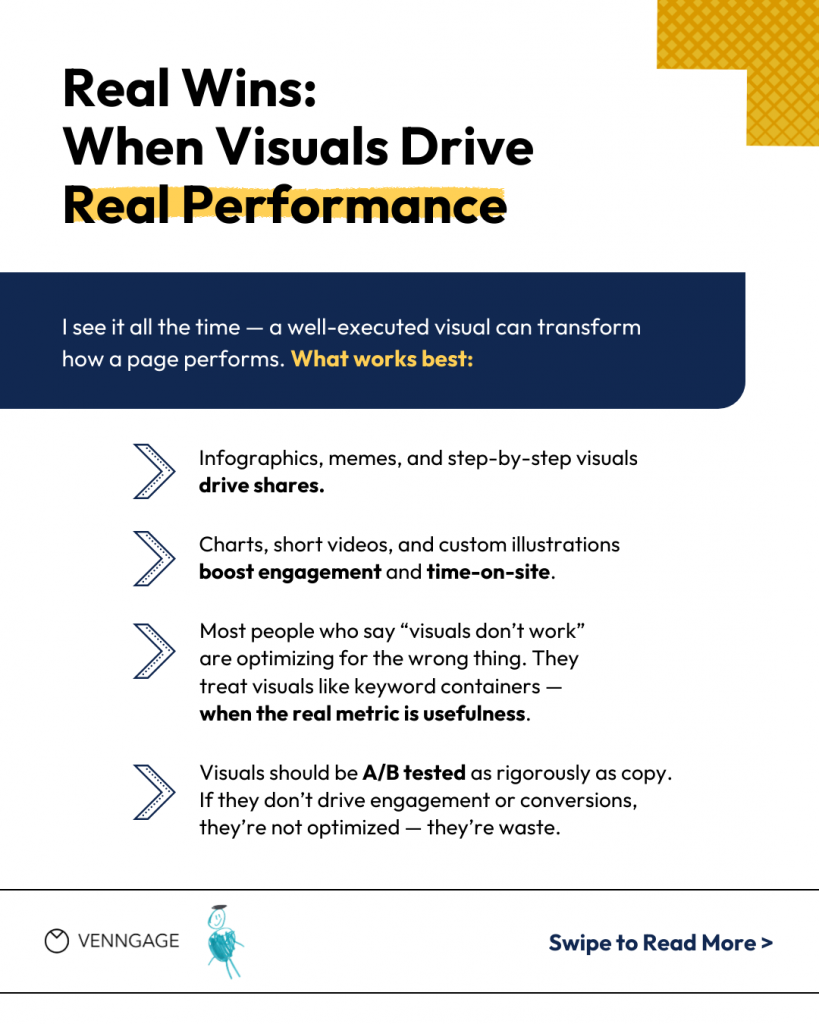
According to Steve Liu, SEO and Content Consultant, “Infographics, memes, and step-by-step visuals tend to be most likely to drive shares, while short-form videos (even a few seconds long), charts and data visualizations, and custom illustrations are most likely to result in higher time-on-site and engagement.”
3. Annotated product photos
If you tag images with descriptive alt text and overlay labels, AI assistants like ChatGPT can describe them accurately. Without those, the image may be ignored. This mirrors how image-based queries need structured visuals to be fully understood.
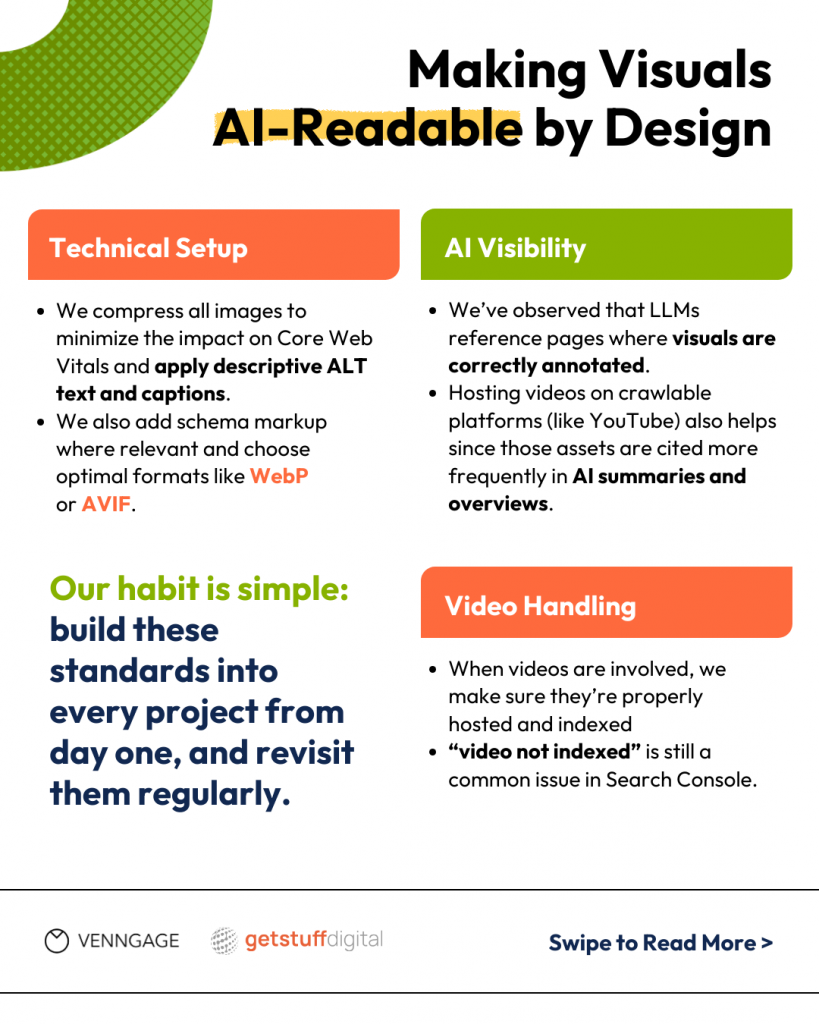
Nik Vujic, Founder of Get Stuff Digital, explains that annotated visuals have higher chances of appearing in LLMs.
“We’ve already seen that LLMs pull from pages where visuals are properly annotated. Hosting videos on YouTube or other crawlable platforms can also extend visibility, since those assets get cited more often in AI overviews. The habit we rely on is strict yet straightforward: treat visual optimization as core SEO, not a nice-to-have, where applicable and justified from an ROI standpoint – as I said, for e-commerce businesses, visual SEO is a must.”
Nik Vujic, Founder of Get Stuff Digital
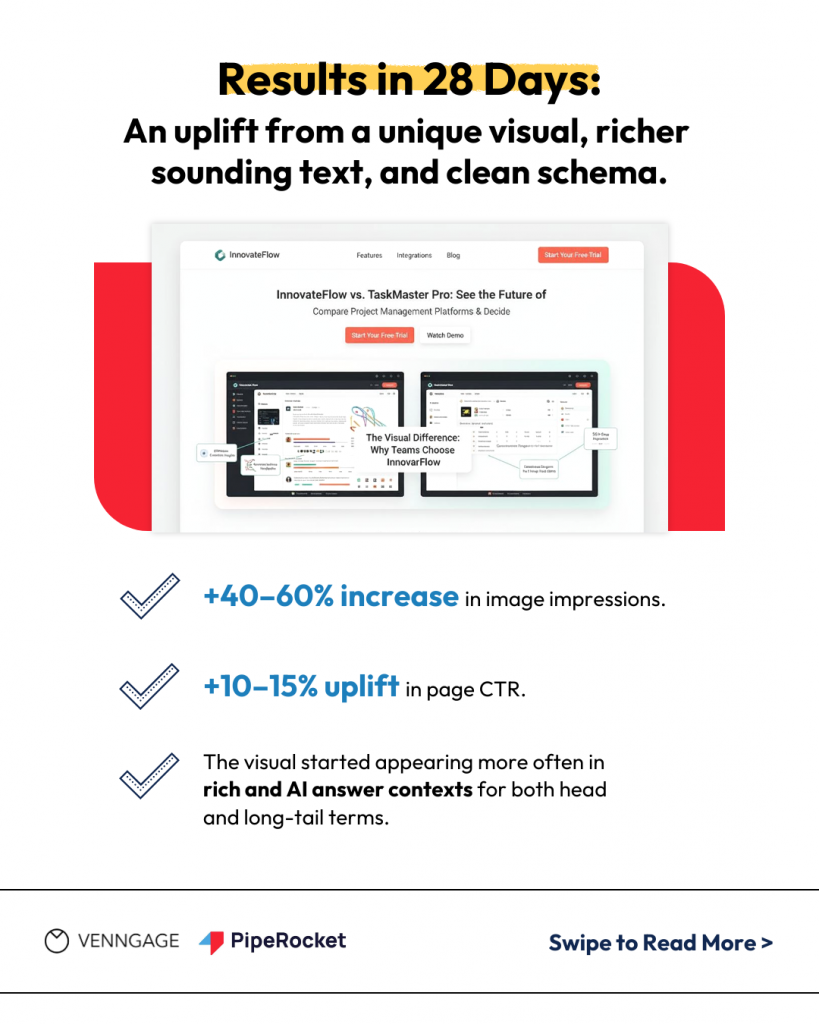
Vignesh D., optimized an image on a BOFU comparison post, and the impressions increased from 40% to 60% in just 28 days and the graphic started appearing more often in AI answer contexts for the head term and long-tails.
“On a BOFU comparison page (SaaS, procurement niche), we replaced a generic screenshot with a custom, annotated comparison graphic (SVG + WebP fallback), wrapped it in <figure><figcaption>, added ImageObject schema (with name, description, caption, contentUrl, license) and set it as primaryImageOfPage for the Article. We also submitted an image sitemap.”
Vignesh D., SEO Specialist at PipeRocket Digital
4. Custom diagrams with branded elements
Custom visuals that include brand-relevant elements and label what’s important get picked up by AI, especially when visuals illustrate processes or concepts clearly.
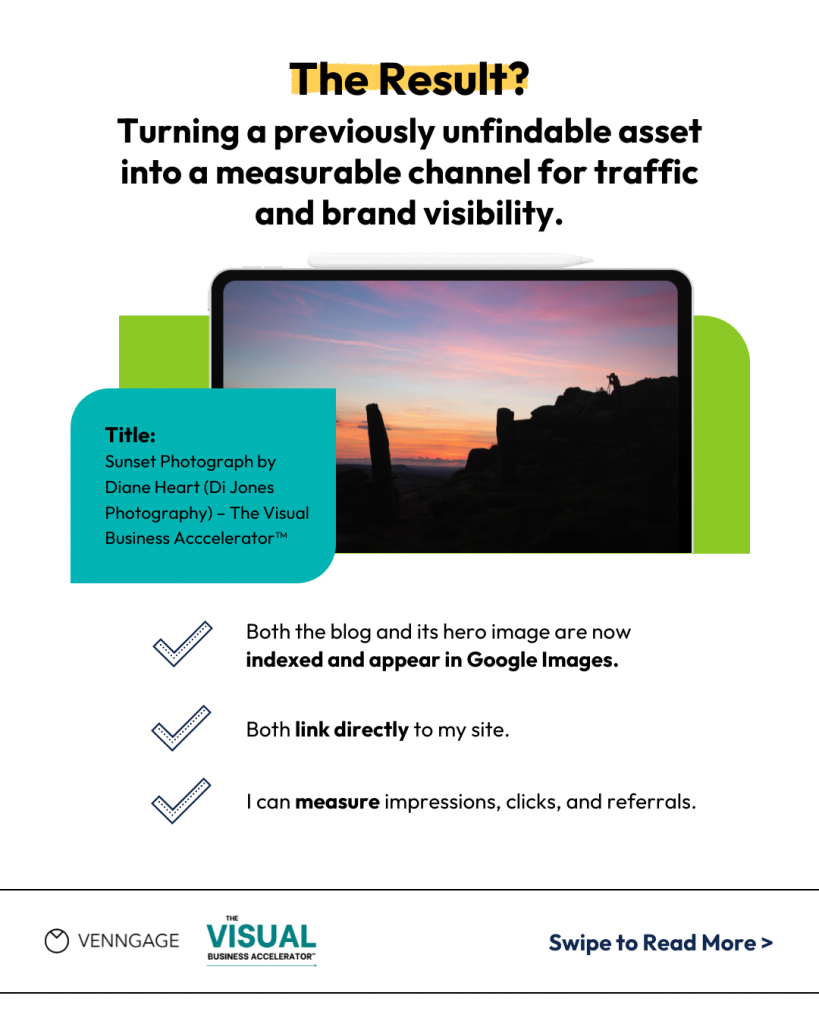
Diane Emily-Rose Heart, founder of the The Visual Business Accelerator, shares her win:
“My ‘single-asset win’ was moving a hero image from invisible to fully discoverable in Google. By adding human descriptive alt text, a clear one-line caption, relevant schema (ImageObject as primaryImageOfPage), removing lazy-loading, and ensuring sitemap inclusion, I made the image machine-readable and ready for both SEO and AI.
After verifying indexing in Search Console (search type: Image, page filter), both the blog and its hero image were indexed — and the image now appears in Google Images, linking directly to my website.”
I then verified indexing in Search Console (search type: Image, page filter).
The direct result: both the blog and its hero image are now indexed in Google, and the image itself appears in Google Images, linking visitors directly to my website.”
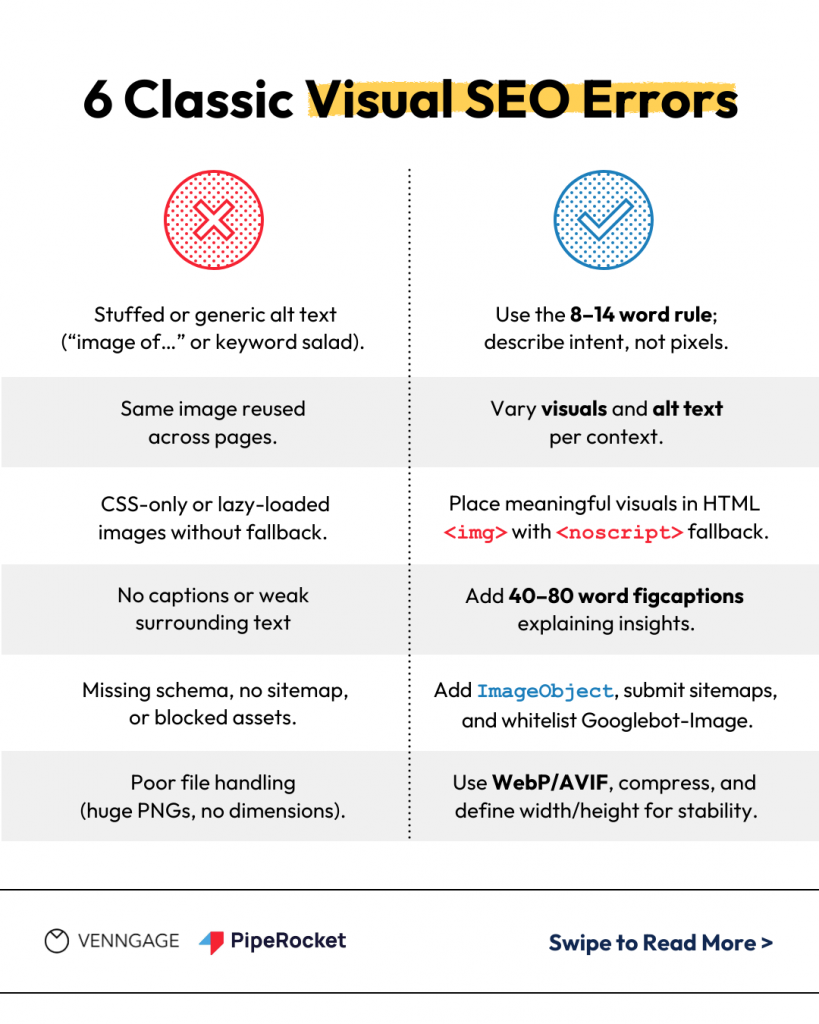
Common Visual SEO mistakes (and how to fix them)
Most brands still treat visuals as decoration instead of communication. If your visuals don’t help your readers, they won’t help your rankings either. Skipping alt text, captions, or schema is a missed opportunity to signal meaning and credibility.
Below are the most common visual SEO mistakes teams make, why they happen, and how to fix them.
1. Stuffed or generic alt text
Alt text filled with phrases like “image of…” or “AI trends infographic design 2025 keywords” doesn’t help anyone — not search engines, not readers.
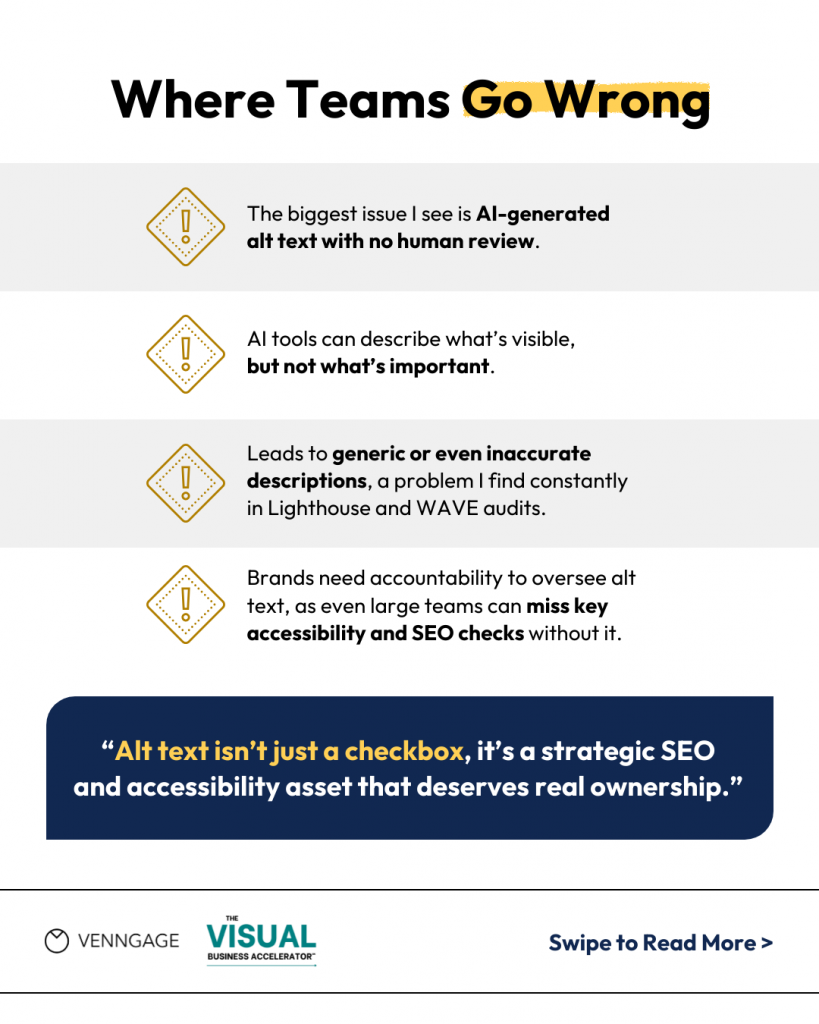
AI-generated alt text is another growing problem. It’s often fast but rarely accurate. Without human review, it misses intent and context, leading to generic or wrong descriptions that hurt accessibility and discoverability.
Fix:
- Keep alt text between 8–14 words.
- Describe intent, not pixels — e.g., “Infographic comparing AI tools for designers in 2025.”
- Always review AI-generated alt text before publishing.
Diane Emily-Rose Heart sees this constantly: “AI tools can speed up alt text creation, but they often lack the nuanced understanding needed to accurately describe an image’s content and context. This leads to generic or incorrect descriptions that misrepresent the image, undermining both SEO and AI discoverability.”
Pro Tip: Audit your image archive and batch-add alt text, captions, or schema to high-traffic pages. It only takes a few minutes and can make legacy visuals AI-friendly again. You can use Venngage’s alt-text feature to make this process faster and more consistent.
2. Reusing the same image or alt text across pages
Duplicate visuals and identical alt text confuse crawlers. When multiple pages share the same image, it’s harder for search engines to decide which one to rank.
Fix:
- Use unique visuals wherever possible.
- If reuse is necessary, vary the alt text to reflect the page’s context and keyword focus.
3. Background images that aren’t crawlable
Many sites hide key visuals inside CSS or lazy-load them without fallback code, meaning they’re never indexed.
Fix:
- Place meaningful images in HTML using the <img> tag.
- Add a <noscript> fallback for lazy-loaded visuals.
4. Missing captions or weak surrounding text
Images surrounded by empty space or vague captions waste an opportunity to add relevance and meaning.
Fix:
- Add a 40–80 word caption that explains the insight or takeaway behind the visual.
- Reinforce the same topic or keyword family in nearby copy.
5. No schema or sitemap coverage
Without structured data, crawlers don’t fully understand or prioritize your visuals. Many brands also block their CDN images from Googlebot-Image.
Fix:
- Add ImageObject schema for key visuals.
- Submit an image sitemap.
- Ensure robots.txt allows Googlebot-Image to access your files.
6. Poor file handling and performance issues
Huge PNGs, missing width/height attributes, or uncompressed images slow down pages and hurt Core Web Vitals.
Fix:
- Use WebP or AVIF formats when possible.
- Set explicit image dimensions.
- Compress images to balance quality and speed.
Vignesh D., sums up the most common visual SEO errors and how to fix them.
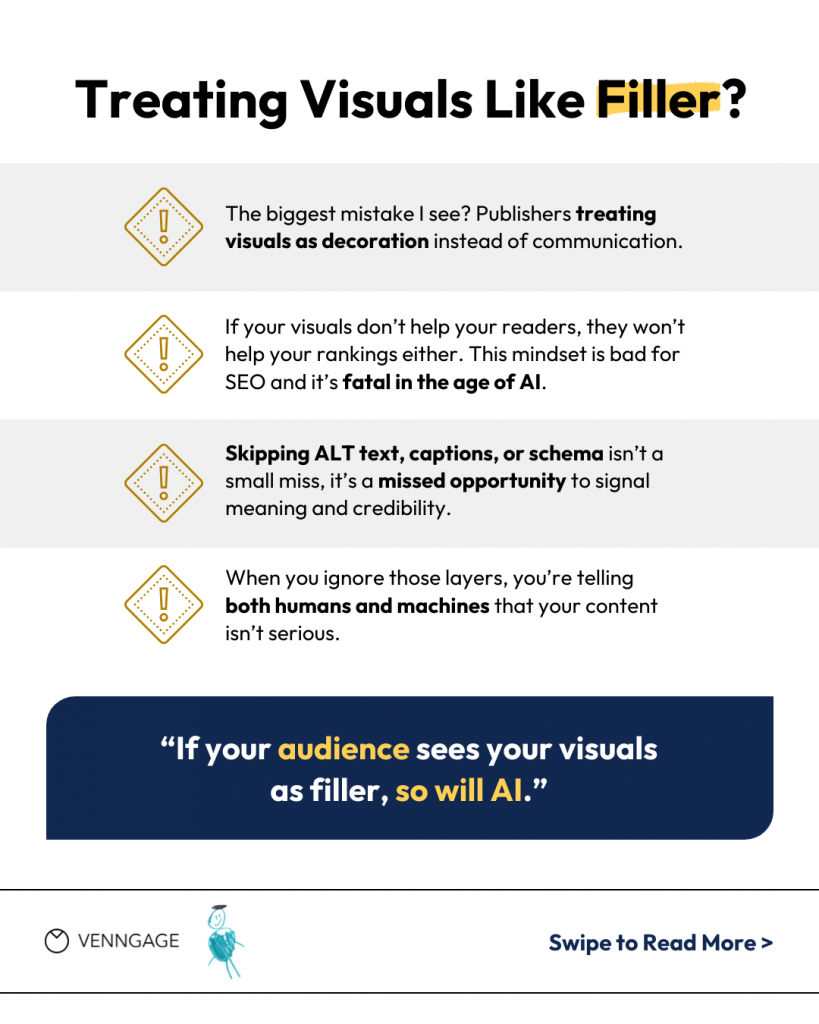
7. Treating visuals as filler content
This is the biggest mistake of all. Visuals that don’t add value signal to both humans and machines that the content isn’t serious. You can’t fake relevance with decoration. AI models now interpret visuals as part of the content. If your audience sees them as filler, so will AI.
Steve Liu, SEO & Content Consultant, is blunt about this: “The biggest misstep I see is publishers treating images as “filler” or “a necessary evil. The goal of AI optimization isn’t just to “show up in the SERP.” It’s to establish credibility in the eyes of the reader (which now includes the LLM).”
Fix:
- Treat every image as part of your message.
- Align visuals with the text goal: explain, compare, or clarify.
- Prioritize quality visuals on high-value pages even if not every asset gets optimized.
Scaling visual content creation
Optimizing visuals is not a one-off job. And in the AI era, when most teams are used to creating content at scale, you need ways to scale optimization too.
That way, your images stay time-saving, platform-ready, and audit-free from the start.
1. AI-assisted content creation workflows
AI speeds up visual systems. Let tools generate alt text in batches. Let them suggest captions that repeat key insights in plain language. Let them annotate visuals (e.g., add arrows, labels or icons) to add context.
Example workflow:
- Generate annotated visuals (say, 10 charts) using your design tool.
- Export them.
- Run an AI tool to auto-generate alt text (e.g., Venngage).
- Let human editors review and tweak the visuals, where needed.
That blends human insight with AI’s speed.
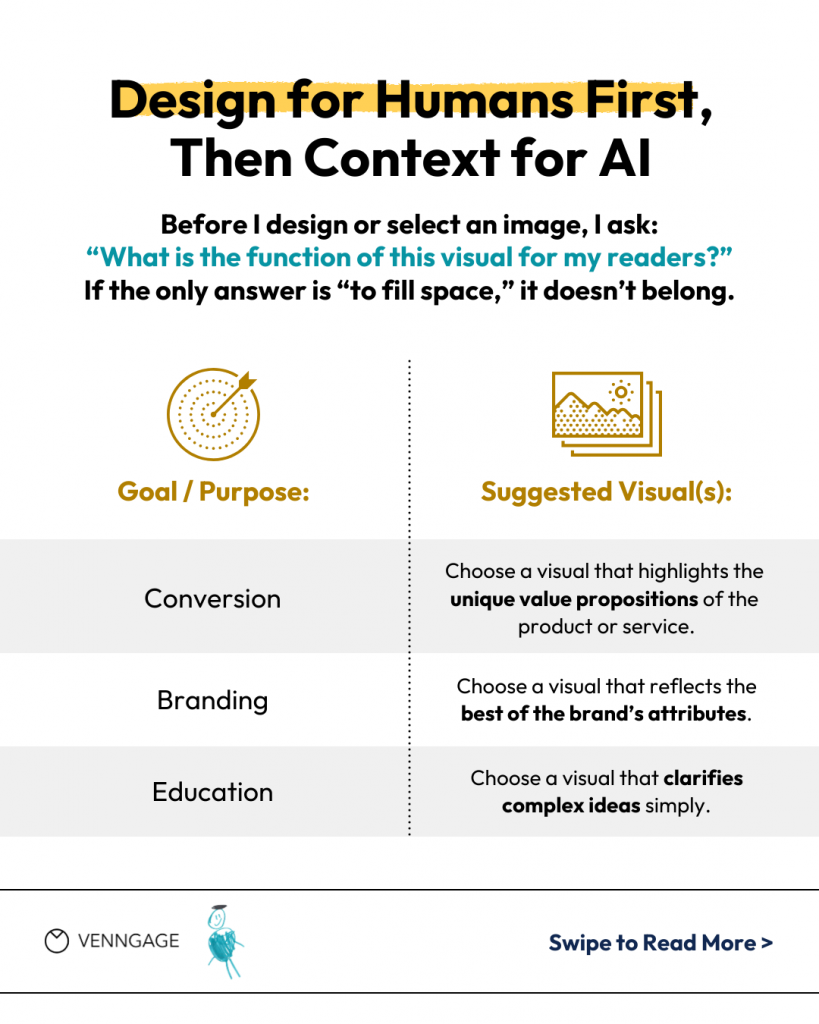
“The most important step in my workflow is asking myself: what is the function of this visual for my readers? If the only answer is “to fill space,” something is wrong. That means the visual isn’t really necessary and may even get in the way. Once I have a clear goal, my process is to produce a visual that optimizes for that goal — for humans.
Steve Liu, SEO & Content Consultant
Venngage templates are built with optimization best practices already baked into them. Each template encourages accessible design, structured layouts and text prompts. Teams can roll out hundreds of visuals that come metadata-ready by default.
That means optimization doesn’t become optional; your template makes it a norm.
2. Template systems for consistent optimization
Optimizing one visual at a time is a waste of everyone’s time. Instead, create metadata-friendly templates so every chart or infographic includes slots for alt text, captions and filenames. That brings speed, consistency and fewer human errors.
Templates work because most of us hate repetition. We benefit more from building once and using it often.
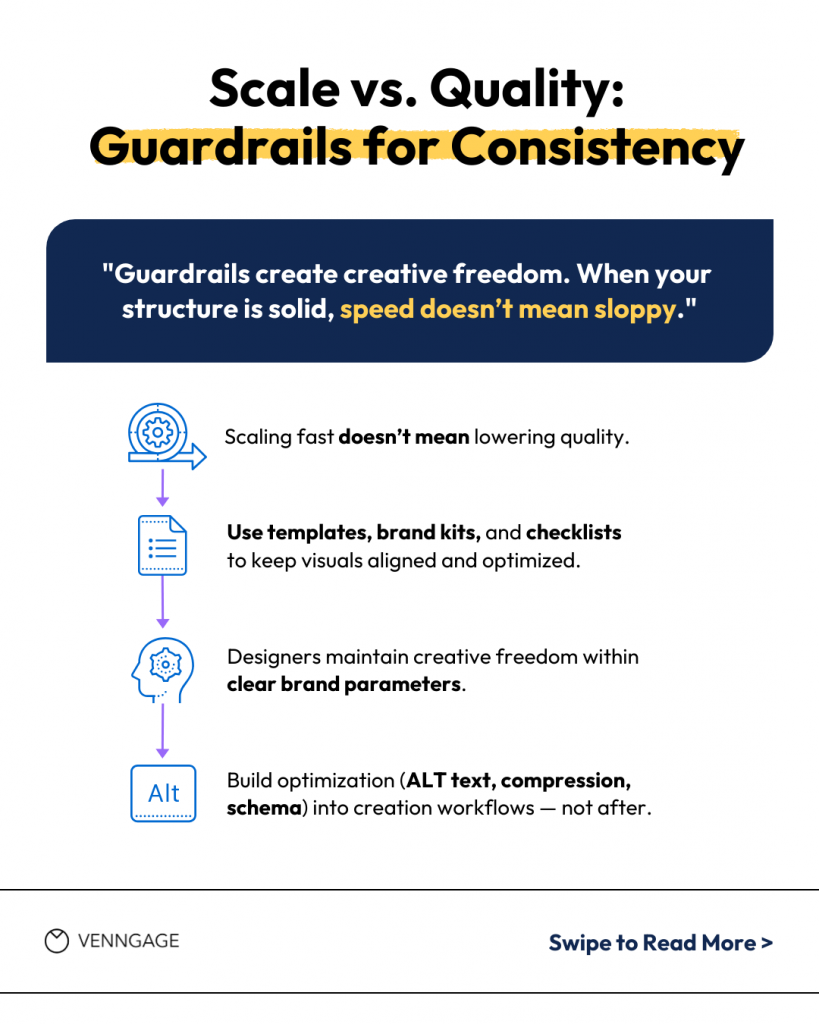
Divyanshu Jangid, SEO lead at Venngage, suggests using templates, brand kits, and checklists to keep visuals aligned and optimized.
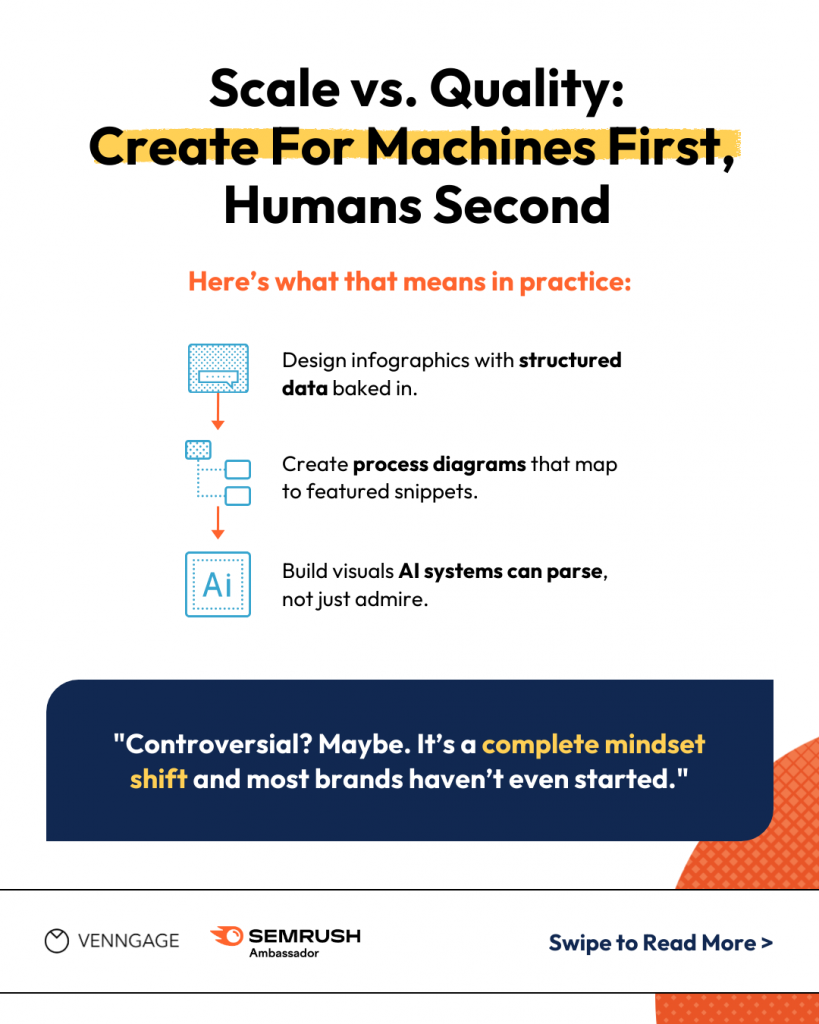
Shubham Sharma focuses on creating content for machines first and humans second.
“I’m designing infographics with structured data baked in, creating process diagrams that map to featured snippets, and building visual content that AI systems can actually parse and understand.
The teams winning at this aren’t just adding it to their workflow…they’re rebuilding their entire content creation process around AI-first thinking. It’s a fundamental shift, and honestly, most companies haven’t even started yet.”
Shubham Sharma, SEO Lead, Tru
3. Quality control at scale
Scaling without QA means scaling mistakes. Guard quality with a checklist:
- Alt text included
- Schema markup added
- Images compressed
- Captions present
Set roles: one person creates, the other reviews. Use tools like Lighthouse or Screaming Frog to detect missing metadata or large image files. Automating QA means your system scales cleanly, not messily.
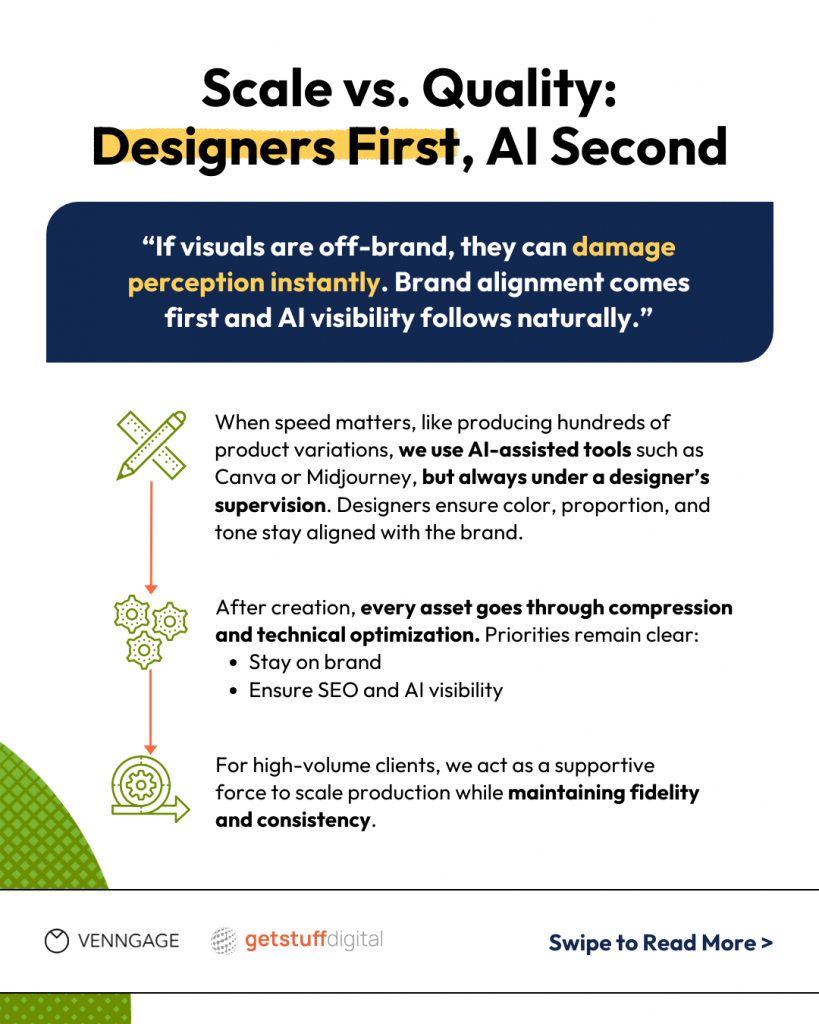
“We rely on designers to safeguard brand consistency. When speed is required, say, producing a high volume of product images or variations, we use AI-enhanced tools (Canva, MidJourney, etc), but under the guidance of designers who know how to prompt and refine outputs to stay aligned with brand colors, proportions, and style. That balance between speed and fidelity is critical.”
Nik Vujic, Founder, Get Stuff Digital
4. Platform-level insight from research
Image SEO guides consistently stress the value of structure and speed. Backlinko lists descriptive filenames, alt text, responsive behavior and compression as key factors for visibility and user experience in search results.
Google confirms that using proper image elements, responsive design, sitemaps and supported formats like WebP and AVIF is essential for visibility and speed.
There are also other research findings that highlight AI tools’ role in scaling tagging and optimization tasks, thus freeing human teams for creative strategy.
Implementation roadmap for visual SEO
If you want your visuals to show up in AI search, you need a clear roadmap: a system that makes sure every image, chart, or diagram is built to be found, read and used at scale.
Here are three phases on how to carry out the implementation:
Phase 1: Conduct an SEO audit for images
Start by understanding where your visuals stand. Conduct a visual SEO audit that checks:
- Alt-text presence and quality
- Schema markup for images (ImageObject, Product, etc.)
- Image performance (file size, formatting, Core Web Vitals)
- Accessibility based on contrast, captioning and responsive behavior
This audit reveals opportunities and sets a benchmark. Then apply core fixes:
- Add meaningful, concise alt text across your content
- Implement image schema on key visuals
- Compress images and set width/height to reduce layout shift
- Ensure mobile readability with accessible fonts and clear captions
This groundwork ensures your visuals are visible, discoverable, and readable by AI systems and users alike. It lays the foundation for scaling.
Phase 2: Scale image optimization
Once your foundation is solid, automate and standardize:
- Build templates (in tools like Venngage) that include branding, alt-text prompts and metadata slots
- Create workflows where visuals go from design to batch AI alt-text generation to human review
- Use checklists for every visual: alt text, schema, compression, captions, responsive test
Structure reduces error and speeds execution. You move from scattered visuals to consistent, optimized content that’s more likely to land in AI overviews and clips.
Phase 3: Automate the process
After scaling comes intelligence:
- Use AI tools to suggest alt text, caption variations or accessible palettes.
- Track visual citations in AI platforms: Identify which visuals earn attention or AI citation and replicate their traits.
- Use performance data to predict which new visual types perform best and pre-optimize them before creation.
Phase 4: Measure success
Visual SEO performance in the age of AI goes beyond rankings — it’s about visibility, engagement, and impact.
Start by tracking how often your content or visuals are cited in AI-generated answers (your new form of “ranking”). Pair this with engagement metrics like time on page, scroll depth, and return visits from AI-driven sessions.
To tie results to business impact, tag links from AI platforms with UTMs and build dashboards that combine Google Analytics, Search Console, and AI visibility tools. Look for patterns: which visuals earn AI mentions, which ones drive traffic or conversions, and which formats consistently perform better.
Treat this like a feedback loop. Update content, refine visuals, and monitor whether your citation rates or engagement improve over time. The goal isn’t just to appear in AI search — it’s to stay visible, relevant, and measurable.
Visual SEO checklist for marketers
Here’s your go-to list: a clear, skimmable set of visual best practices that AI and humans both respect.
Descriptive alt text
- Write concise, accurate alt text that inherently uses your primary keyword.
- Avoid stuffing keywords. Google calls it “useful, information-rich content that uses keywords appropriately and is in context.”
- Use “red-rose.webp” instead of “image1001.webp”
High-quality visuals
- Use clear, focused images; not blurry or overly decorative ones.
- Charts and infographics must have readable labels and strong contrast.
- Every visual should serve an information purpose, not just decoration.
Compression and modern formats
- Convert large images to WebP or AVIF using tools like Google Squoosh or TinyJPG.
- According to academic testing from 2023, WebP reduces load times by ~21% and AVIF by ~15% compared to JPEG.
- Fast pages rank better and keep readers around.
Descriptive filenames and captions
- Choose filenames with hyphen-separated keywords, like golden-gate-bridge-sf.jpg.
- Include captions or nearby text that reinforce what the image shows.
Structured schema data
- Use ImageObject for visuals like charts or infographics.
- Use Product schema alongside ImageObject for product visuals.
- Schema helps search engines and AI systems understand and surface your visuals.
Contextual placement
- Place visuals near the key point they support. Provide captions that reference your argument directly.
Unique graphics
- Use branded diagrams or charts rather than plain stock imagery.
- If using stock visuals, make them unique—annotate, label, or overlay them to add context.
Mobile-friendliness
- Always set width and height to prevent layout shifts and improve Core Web Vitals.
- Test on devices to make sure visuals appear properly and are legible on small screens.
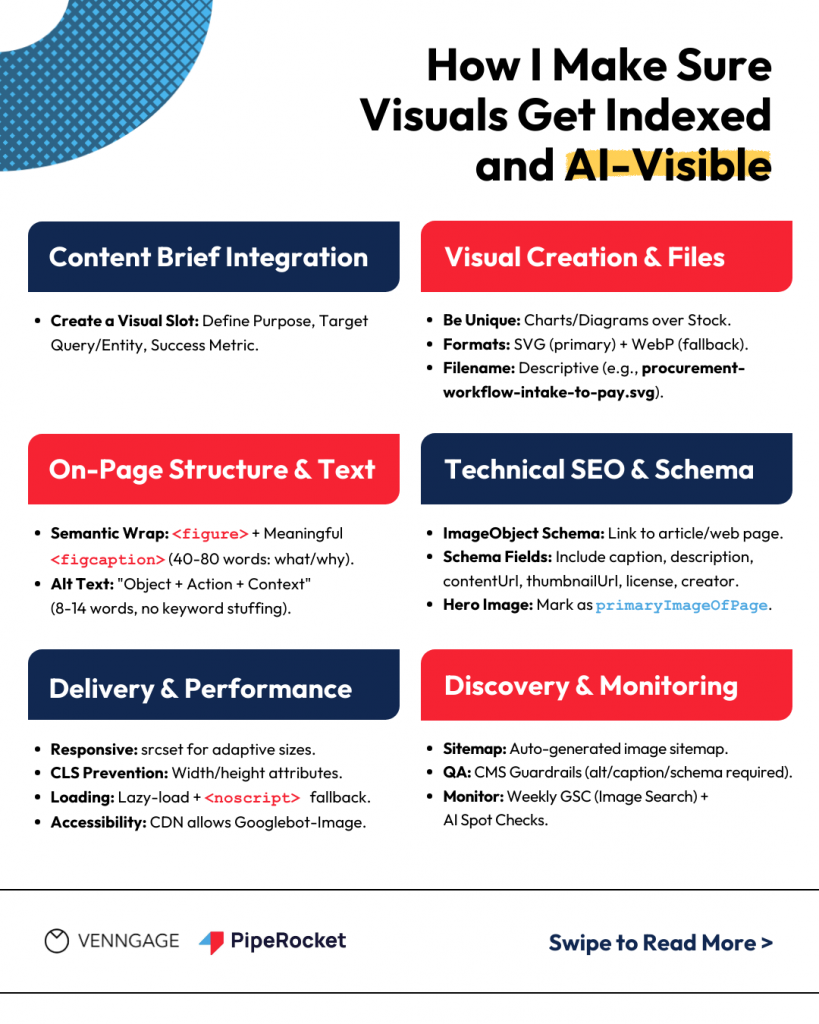
Here’s a detailed visual SEO checklist shared by Vignesh D.
Scale your reach through visual SEO
Visual SEO isn’t a trend, but how discovery now works. The same visuals that once supported your story now are the story. They surface in AI answers, carry your brand into new search experiences, and shape how users perceive your authority.
Most teams still treat this as optional. But visibility will belong to those who make optimization part of creation.Start with your most important pages. Refine the visuals that matter most. Build the habit before it becomes the standard. Your visuals already speak for your brand. It’s time they’re heard in search too.


