


Back in the day, annual reports used to be static PDFs no one liked reading.
Fast forward to today, people expect interactive, data-driven reports you can update and share instantly. That’s why picking the right annual report software in 2026 is more important than you think.
In this post, you’ll find out what an annual report really is, how to pick the right software and eight best tools I tested to help you decide.
What is annual report software?
Annual report software, also known as financial reporting software, is a dedicated category of reporting tools that helps you create a complete, ready-to-publish annual report.
It’s different from general financial reporting platforms because it combines design, layout, narrative content, audited numbers, charts and branded visuals under the same roof.
As businesses digitalize, annual reports should evolve from compliance paperwork to storytelling.
From the USE Agency blog
For example, you’ll get structured sections for your CEO letter, financial statements, KPIs, ESG updates and governance disclosures and you can import data from spreadsheets without manual re-entry.
You’ll also get collaboration tools that keep version control clean and export options that suit both print and digital audiences through PDF or an interactive microsite.
The goal for using annual report software is simple: to create a report that looks polished, reads clearly and communicates your results without being tangled in a web of static word processors or messy spreadsheets.
If you want to make your annual reports more visual and engaging, you can use Venngage throughout your build. It has a rich library of annual report templates that come with charts, financial highlights and timelines to make dry data interesting and help readers process key information quickly.
8 popular annual report software options
Most annual report tools fall into three groups: nonprofits, small businesses and enterprises.
Each faces different constraints. For instance, nonprofits need simple, impact-focused layouts, small businesses rely on familiar spreadsheet workflows and enterprises require data controls, audit trails and regulatory-ready outputs.
This list covers all three groups, with each tool description highlighting which type of organization it’s best suited for.
1. Venngage
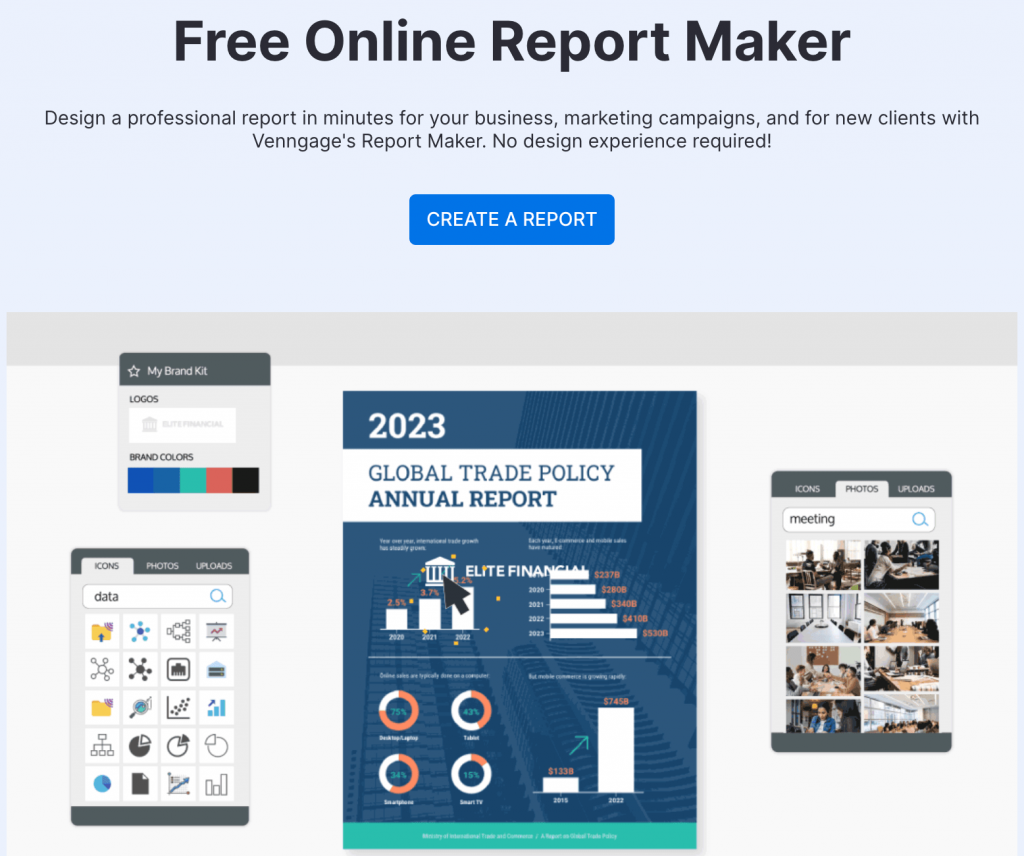
Venngage is a design-first annual report maker built for teams that need polished, visual reports without hiring a designer. It offers a rich library of ready-to-use annual report templates, editable financial page layouts and an AI Report Generator that structures your content, applies layouts and formats charts automatically.
Venngage also comes with additional helpful features like AI-assisted drafting, a simple drag-and-drop editor, My Brand Kit, clear data visualizations and flexible export options either as PDF, PowerPoint or HTML.
Pros:
- Easy for non-designers
- Strong visual templates tailored for annual reports
- AI speeds up layout and copy generation
Cons:
- High-resolution exports require a paid plan
- Limited offline functionality
Best For: Nonprofits and small businesses that want to publish polished, visual annual reports.
Pricing: Free plan available; paid plans start at $10/user/month.
2. Storyraise
Storyraise is built specifically for nonprofit organizations that want to build impact-rich, donor-facing annual reports. Its drag-and-drop builder supports narrative modules, from stories and numbers to images and embedded video.
The platform also comes with engagement analytics so organizations can see what sections donors actually read.
Pros:
- Intuitive even for first-time users
- Built specifically for storytelling
- Strong support for digital-first donor engagement
Cons:
- High-resolution exports (e.g., PDF) can be difficult
- Hefty pricing
Best For: Nonprofits that want to engage donors through visual stories and impact reporting.
Pricing: Pricing starts at US$2,900/year.
3. Microsoft PowerPoint
PowerPoint isn’t a purpose-built annual report tool; it’s more well-known as a leading presentation maker. However, its popularity across the world makes it a practical choice for many teams already working in the Microsoft 365 ecosystem.
With PowerPoint, you can build slide-based report pages, pull in Excel charts with live linking and apply brand themes consistently across sections. It also offers flexible layout control for visuals and an easy export to print-ready PDF.
Pros:
- Familiar Microsoft interface makes it easy to use
- Flexible layout options
- Easy learning curve
Cons:
- Doesn’t sync with live financial data
- Not built for collaborative version control on large reports
Best For: Small teams or startups using PowerPoint already and who don’t need live data integration.
Pricing: Included in Microsoft 365, plans start at $9.99/month.
4. QuickBooks Online
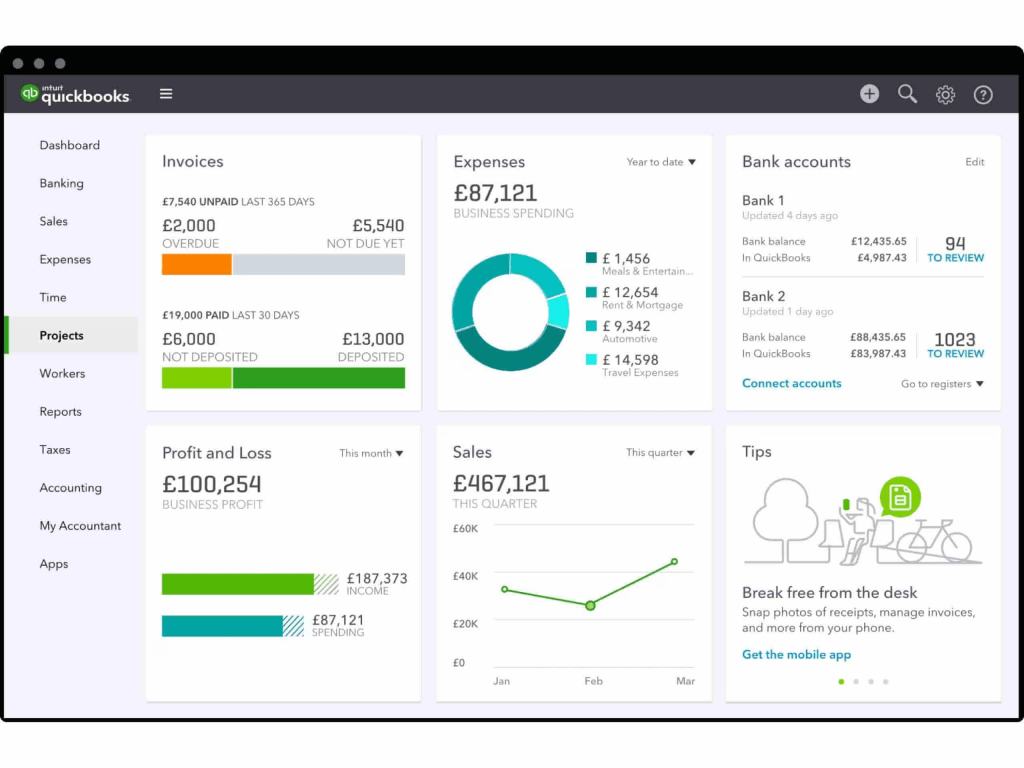
QuickBooks Online is an accounting-driven platform that lets you create financial statements every annual report relies on, including profit & loss (P&L) statement, balance sheet and cash-flow summaries.
Since it pulls data directly from your live books, QuickBooks ensures the numbers are accurate and up to date without the need to export them manually. While it isn’t built for narrative design, it gives teams a reliable financial backbone they can later format in a dedicated report-design tool.
Pros:
- Reliable, real-time financial data
- Trusted by finance teams
- Easy to pull standard reports
Cons:
- No narrative design or branded layout support
- Design/report exports require a separate visual/reporting tool.
Best For: Small businesses that want reports grounded in accurate accounting data.
Pricing: Plans start at $11.40/month; free trial for 30 days.
5. Xero
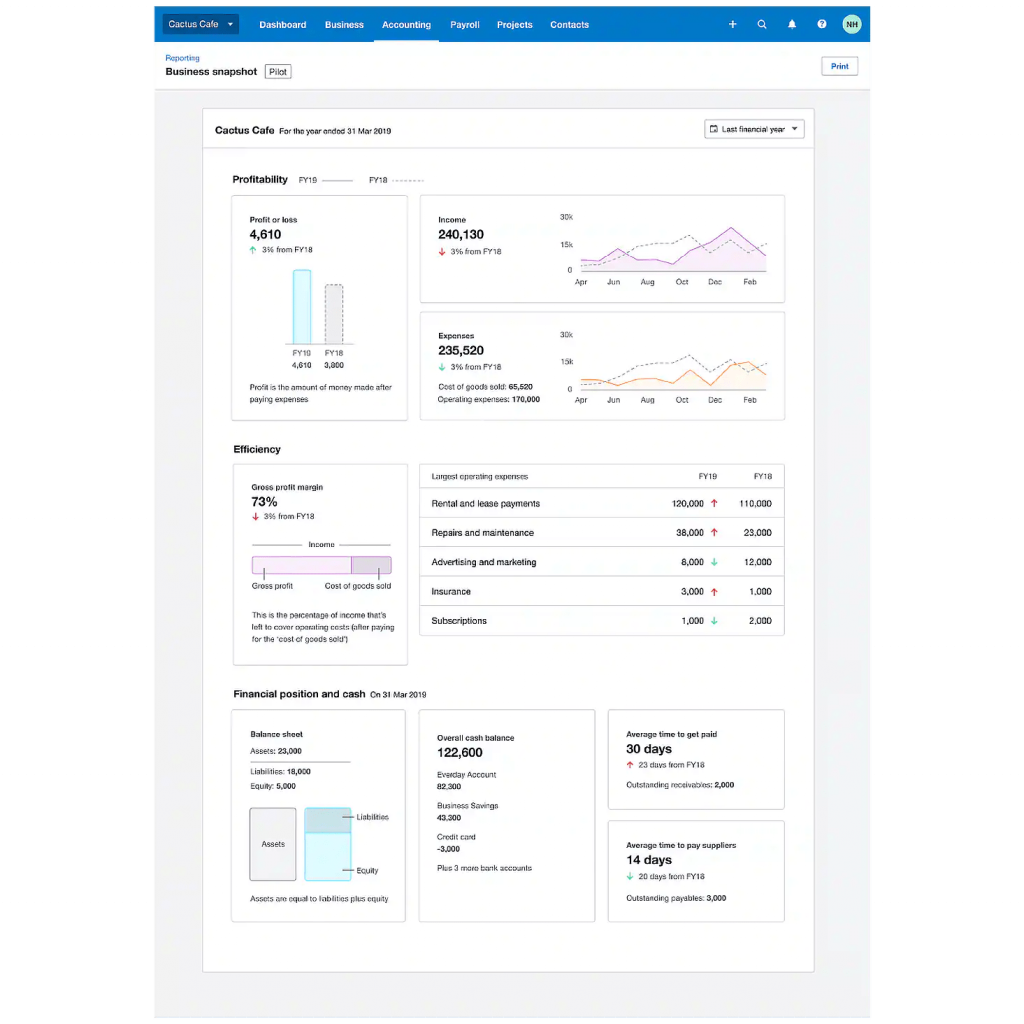
Xero is a cloud accounting platform that comes with clean, reliable financial statements, such as P&L, balance sheet, cash flow and custom management reports.
Xero provides a solid backbone for the financial section of an annual report. Its real-time data and multi-user access help teams and accountants collaborate easily. While it isn’t designed for narrative storytelling or visual layouts, its structured exports give you accurate numbers to refine in a dedicated design tool.
Pros:
- Dependable accounting data
- Easy multi-user access for accounting and finance teams
Cons:
- Lacks design tools for narrative storytelling
- No built-in interactive or web-based report publishing
Best For: Small and medium businesses that want strong financial reporting paired with a separate design/report builder.
Pricing: Starts at $29/month; free trial not available.
6. Tangelo
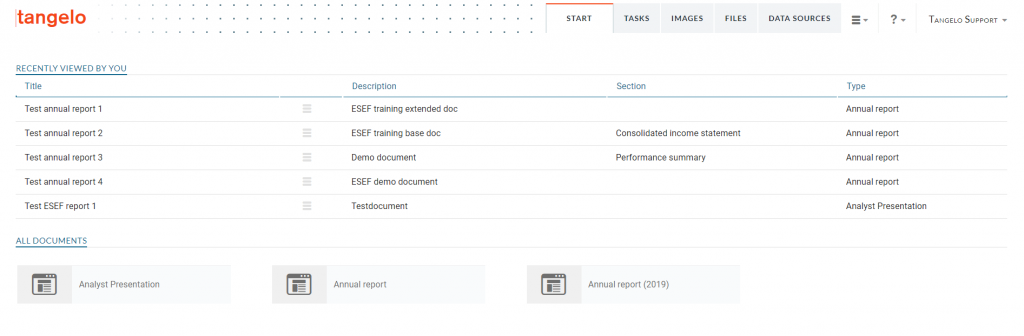
Tangelo is an enterprise-grade annual report software for building corporate annual reports. It automates design with typesetting, syncs data from financial and ESG systems and supports structured review workflows.
Tangelo’s review and approval workflows are especially helpful for large teams to manage multi-author reports, while its PDF and interactive web outputs support both investor-facing and regulatory use cases.
Pros:
- Consistent, well-designed output via automated typesetting
- Built-in tagging for regulatory disclosures (e.g., ESEF, CSRD)
- Publish as both PDF and interactive microsite
Cons:
- Too complex for very small teams
- Higher implementation cost, with onboarding required
Best For: Large enterprises, investor relations teams or sustainability reporting groups that need compliance and polished formats.
Pricing: Pricing info not available publicly; requires booking a demo to get a custom quote.
7. Workiva
Workiva (formerly known as Wdesk) is a compliance-grade reporting platform built for enterprises that need absolute accuracy, traceability and control in their annual reports. It links data across spreadsheets, narratives and statements so updates flow everywhere automatically and there are no manual risks.
It also supports regulated filings through XBRL tagging, audit trails and granular permissions, while the cloud workspace helps large teams manage reviews, revisions and disclosures in one organized system.
Pros:
- Strong data governance and control
- Proven ROI for complex reporting teams
- Cloud-based collaboration with audit trails
Cons:
- Extremely pricey
- Implementation and onboarding can take a long time
Best For: Enterprises with regulatory, financial or ESG reporting responsibilities (e.g., SEC, integrated reports).
Pricing: Pricing information not available on the website. According to Vendr, Workiva costs around $59,788 per year on average (based on real customer purchase data).
8. SolveXia
SolveXia is a no-code automation platform built for finance teams that handle complex, recurring reporting work. It pulls data from multiple systems, cleans it, reconciles it and runs validation checks so your annual report starts with accurate, audit-ready numbers.
Since SolveXia runs workflows automatically, finance teams can cut manual spreadsheet tasks, reduce errors and generate consistent reports on time even during heavy close cycles.
Pros:
- Cuts manual errors (claims up to 98% error reduction)
- Automates recurring data tasks and reconciliations
- Built-in audit trail and governance
Cons:
- Initial integration and setup can be complex
- Not focused on report design or visual storytelling
Best For: Finance teams in medium-to-large organizations needing to automate recurring report workflows and ensure data accuracy.
Pricing: Pricing information not available publicly.
Why go digital? Advantages of digital annual reports
More businesses are ditching print in favor of digital annual reports because they offer much more than cost savings. A well‑designed digital report goes beyond just listing numbers; it helps you build a narrative that connects with shareholders, staff and other stakeholders.
Digital platforms also let you embed video, audio, animation and interactive charts to make your story more compelling. As Paragon Design Group explains:
You can incorporate multimedia and assistive elements like captioned videos, text-to-speech tools and interactive charts, making the information engaging for and accessible to, a wider audience.
A major advantage? Digital annual reports don’t come with page limits. You can use pop-ups, hyperlinks and expandable visuals so readers can dig deeper where they want, rather than suffer through each static table.
There’s also a strong business case for going digital: you save on printing and distribution, reduce your carbon footprint and retain the ability to update your report at any time.
Digital annual reports are sustainable – Keep your environmental footprint lower and opt for a digital report instead of a printed one. Since it’s built on the web, it’s a simple click away to edit content in the case that an update is needed.
From the Visceral blog
Finally, some digital annual report tools (e.g., Storyraise, Tangelo, Workiva) let you track engagement. You can see how long someone spends on each section, which charts they interact with and tailor future reports based on real reader behavior.
That said, print still makes sense in some cases, such as for archiving or for audiences who prefer a physical document. A hybrid approach often works best.
Key features to look for in annual report software
When you evaluate annual report tools, here’s a checklist of essential features that will truly move the needle for your team:
1. Template variety and customization
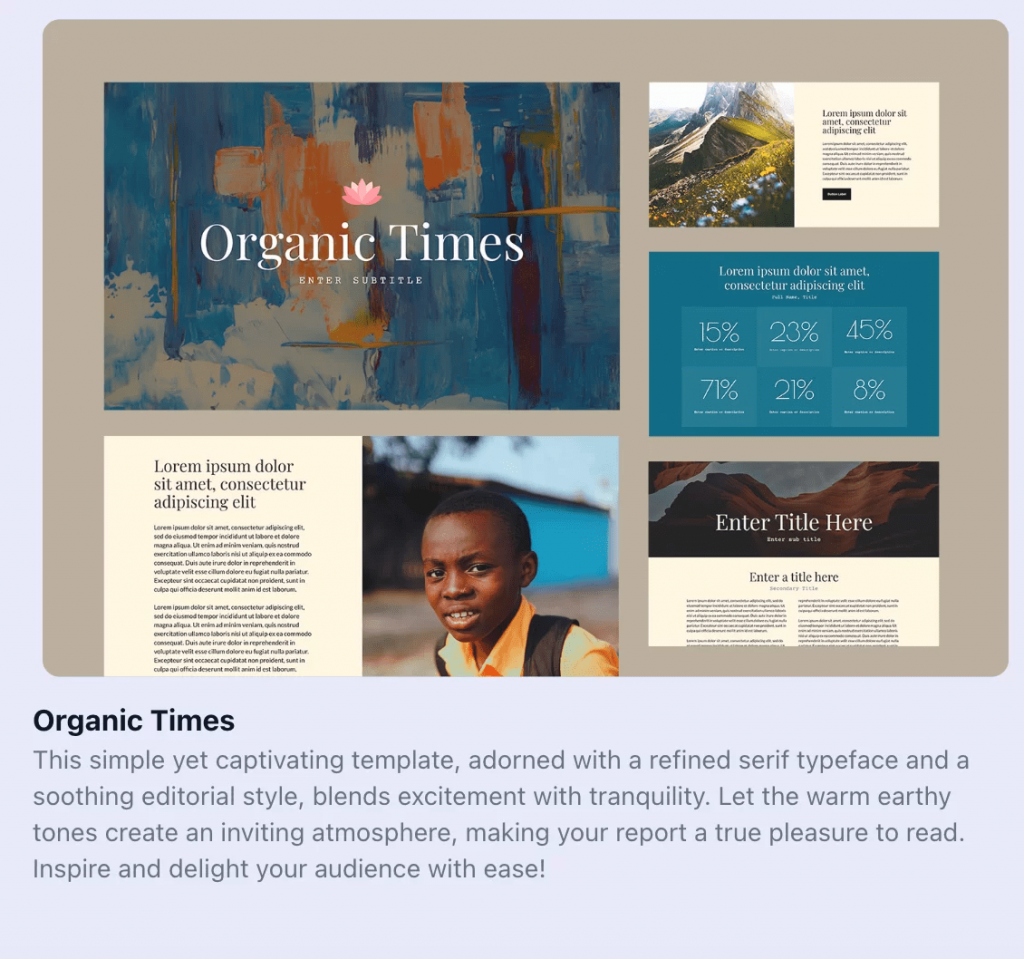
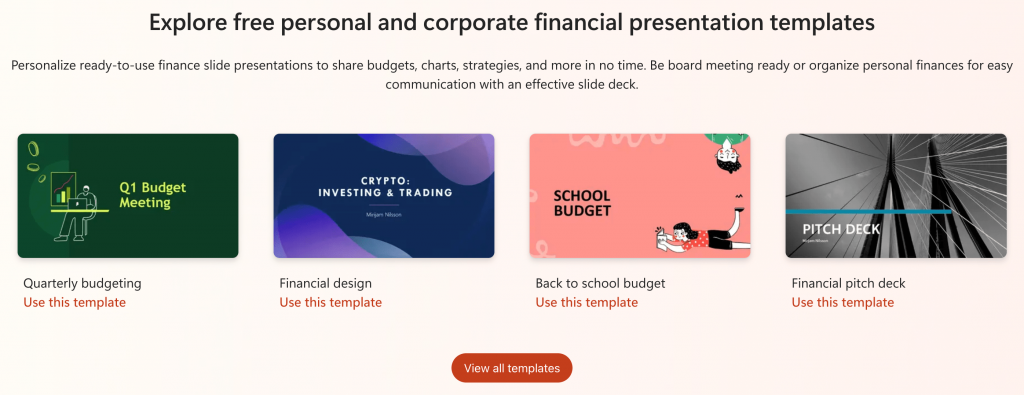
Look for a tool with professionally designed report templates that feel polished and on-brand. Pick tools that let you adjust colors, fonts and layouts so that your annual report reflects your identity and maintains brand consistency.
2. AI‑assisted drafting
These days, nothing gets started without AI. Use an AI-powered report generator tool that lets you generate first drafts or structure sections. However, leave room for human review to refine tone, correct facts and polish language.
3. Data integrity and accuracy
Reporting software should help maintain consistency and trust. Make sure your tool can import data cleanly, check for discrepancies and keep source numbers linked to visuals so your reports don’t mislead or contain errors.
4. Data visualization and storytelling
Choose a platform that lets you turn raw numbers into compelling narratives. Great tools support charts, infographics and trend visuals. These help you show not just what happened but why it matters to donors, investors or employees.
5. Collaboration and review workflows
You don’t want version chaos. The right tool gives you comments, track changes and approval flows. This aligns people across finance, communications and leadership before anything goes live.
6. Export flexibility
Your audience may prefer different formats. Look for software that exports to high-resolution PDF, interactive microsites and shareable links. Flexibility means you can distribute to investors, donors and staff without redoing the design.
7. Ease of use and onboarding
Not everyone on your team is a designer or spreadsheet expert. The best tools feel intuitive. Bonus points if there’s support in the form of built-in guides, onboarding help or ready-to-use templates that make starting a breeze.
8. Cost and scalability
Be thoughtful about return on investment. For small teams, the value often comes from time saved and professionalism gained. Look for pricing that scales with your growing needs, not just feature bloat.
How to create an annual report: Step‑by‑step
Here’s a practical, step‑by‑step guide to putting together an annual report from raw data to a polished document everyone will appreciate.
1. Preparation
Start by gathering everything you need: audited financial statements, budget vs. actuals, donor lists, program stories, photos and leadership messages.
Work closely with your finance team, communications team and any external stakeholders to finalize the narrative content first before you jump to designing.
2. Choose the right software
Use the checklist we reviewed earlier (templates, collaboration, export options and more) to choose a tool that fits your organization’s size and workflow.
Make sure you pick a tool that simplifies your processes and makes updates and revisions easier.
3. Build the structure
Use a template or pull content from last year’s report. Typical structure: CEO/Executive letter, key highlights, detailed financial statements, program impact, governance or board notes and a thank-you section.
For nonprofits, design guides recommend starting with a creative brief to define your voice.
4. Design and data visualization
Import data from your accounting system or spreadsheets into your tool. Use charts such as trend lines, bar charts, infographics to turn raw data into interesting insights.
Use charts, graphs and infographics to present this information in an engaging and easily digestible format.
From the DoJiggy blog
5. Collaboration and review
Assign roles: who writes, who reviews, who validates financials, who signs off on messaging. Make sure your software supports version control, comments and approval workflows.
For compliance, double check that audited statements and board or director reports are properly included.
6. Publish and distribute
Once everything is locked, export your report. Go for both print-ready PDF and a digital microsite or interactive report.
Make sure the digital version is mobile-friendly, accessible and supports tracking so you can understand how readers engage.
7. Post-publication
After launch, measure what matters: how long readers stay, which sections are most clicked and what stories resonate. Use analytics to inform next year’s layout and content.
Collect feedback across stakeholders so you continuously improve your report for the next cycle.
Turn your annual report into an intriguing story
Today, annual reports aren’t just compliance documents anymore; they’re powerful story platforms that influence business decisions. The right software helps you turn dense data into something people actually want to read.
Venngage can help you achieve that with a wide variety of ready-to-use annual report templates you can personalize in minutes. If you want a report that feels modern, visual and genuinely engaging, use Venngage’s AI to create the first draft in seconds and apply your human touch to make it more compelling.
FAQs
Curious about creating polished annual reports? Here are answers to the most common questions.
What’s the difference between annual report software and financial reporting software?
Annual report software focuses on visual storytelling, templates and branded layouts to communicate results to stakeholders. Financial reporting software handles backend accounting, data consolidation and ERP integration but offers limited design or narrative capabilities.
QuickBooks vs Excel vs dedicated report tools which should I use?
Excel and QuickBooks manage data and financials but lack design and storytelling features. Pair them with a visual tool like Venngage’s AI Report Generator to turn spreadsheets into branded, presentation-ready reports for stakeholders.
Are there legal requirements for annual reports?
Most organizations include a director’s letter, audited financials and key highlights. Using templates, like Venngage’s annual report designs, helps structure these sections clearly while keeping your report visually engaging and stakeholder-ready.
How long does it take or cost to create a report?
Creating a manual annual report can take weeks. Using Venngage’s AI tools and templates speeds up design and copy drafting, letting you produce polished, visual reports in a fraction of the time.
Can AI really generate reports automatically?
AI can assist with structure and first drafts, but human review ensures accuracy. Tools like Venngage’s generator, combined with Brand Kit and templates, help produce consistent, polished and professional annual reports efficiently.
Should I still create print versions or go fully digital?
Digital reports offer accessibility, analytics and interactivity, while print versions suit formal presentations or archival needs. Tools like Venngage provide interactive templates that can be exported for both web and print PDF formats.


