


Research reports are used to compile data, interpret findings and help professionals make informed decisions. While there is no rigid format that fits every project, a professional report must follow a logical structure to ensure absolute clarity. You need to maintain a strict information hierarchy (organizing content from strategic takeaways down to granular technical evidence) to avoid information fatigue and convey your core message clearly.
To find the best approach, I analyzed over 20+ research reports across various industries. My perspective is shaped by my background as a lawyer-turned-marketer; I’ve found that the most effective reports function like a legal brief — built on logic and structured to lead the reader to an undeniable conclusion.
Using the APA Journal Article Reporting Standards (JARS) and the ISO 20252 global standard for market and social research, I’ve identified the exact sections you need to make your research report clear and persuasive.
Research report format structure
The sections below follow widely accepted research reports for clarity, transparency and logical sequencing.
1. Executive summary
The executive summary should answer the main question immediately. Decision-makers should understand the outcome of the research within the first few lines.
Use the BLUF approach (Bottom Line Up Front) — start with the conclusion, then support it with key insights.
Key details to include:
- The primary objective of the research
- The most important finding or insight
- Business impact (revenue, efficiency, risk, or performance impact)
- Final recommendation or decision required
A strong executive summary clearly explains the research objective, summarizes the most significant insight and connects the findings to key performance indicators (KPIs), operational outcomes, or strategic alignment. Readers should understand the direction of the report without reviewing the detailed analysis or methodology.
2. Introduction and purpose
Clearly outline the problem statement, the boundaries of the research (scope) and the specific organizational goals it aims to support.
Include:
- Problem statement or research question
- Research objectives and expected outcomes
- Scope boundaries and limitations
- Business or organizational context supporting the research
3. Methodology
In this section, you must document your data collection process. State whether you used primary research, such as stakeholder interviews and surveys, or secondary research, such as market reports and internal databases.
Specify the sample size ($n$) and the analytical models used, like SWOT or PESTLE, to show that the findings are based on a structured process rather than anecdotal observation.
4. Research vitals and metrics
Before reviewing detailed findings, readers need a quick quantitative snapshot of the study. This section presents statistical significance and performance metrics in a format that supports fast scanning.
Think of this as the data dashboard of the report.
Include:
- Total responses or dataset size
- Response rate or participation rate
- Confidence interval and margin of error
- Key performance metrics or baseline measurements
- Visual summaries using charts or data visualization
5. Detailed findings
This section is the main body of the report, where data is organized into thematic clusters. To prevent information fatigue, move from macro-trends to micro-data. Use descriptive headings so readers can quickly find the data relevant to their specific department.
For every observation, provide the specific evidence, such as a chart or a data point and explain the business implication. In my experience, the most effective way to present findings is to lead with the “Why it matters” rather than the “What happened.” If you show a 10% drop in engagement, immediately follow it with the specific revenue impact.
6. Risk and opportunity assessment
Use this section to perform a Gap Analysis that compares current performance against potential growth. Contrast potential roadblocks, such as budget or market constraints, with strategic levers for growth. Assigning a weighted score to each helps the reader prioritize which findings require immediate attention.
7. Conclusion and recommendations
The detailed findings section contains the evidence base of the report. Data should be organized through thematic analysis or trend analysis so readers can move from high-level insights to supporting data logically.
Avoid presenting raw data without structure. Every finding should clearly answer what the data shows.
Include:
- Major trends, patterns, or correlations identified in the research
- Supporting statistics or qualitative insights
- Comparisons across segments, time periods, or variables
Remember that readers do not treat a research report like a reference manual. They scan for validation, search for obstacles and look for a clear path forward.
Sample research report format
I’ve created a sample research report format that you can easily copy.
Research Report: Final Findings
Prepared by: [Name]
Date: [Date]
(Start with the final conclusion and the primary recommendation required.)
[Write summary here…]
(Define the problem statement and research boundaries.)
[Write intro here…]
(Document collection methods and sample size n.)
[Write methodology here…]
| Dataset Size | [n=] |
| Confidence Level | [%] |
(Organize by themes. Lead with why it matters.)
[Theme]: [Observation + Evidence + Implication]
(Contrast roadblocks with levers for growth.)
[List risks and weighted opportunities here…]
(SMART actions tied directly to findings.)
[List recommendations here…]
Venngage’s research report template
While text-only research report formats can work, they can get pretty dense, leading to an overload of information. A better way to create research could be to use a pre-designed visual research report template, such as the medical research report template by Venngage shared below.
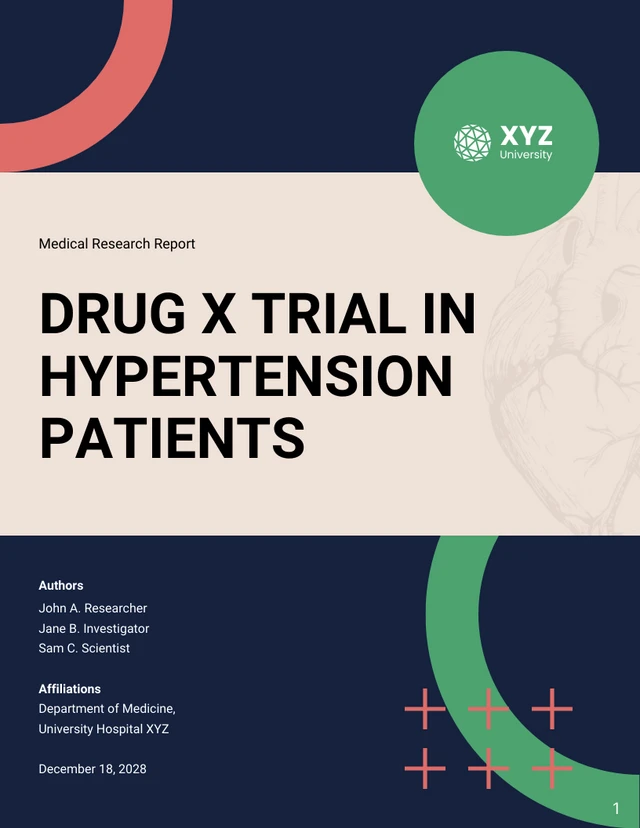
This template follows the standard research report format. It starts with an abstract and then includes specific sections for the introduction, methodology and other parts.
The cover page includes the title with visuals, which gives it a professional look and makes it look visually appealing. The template has arranged the sections using a clear layout so readers can easily go through the information.
By using this visual approach, you make the data scannable. It allows different stakeholders to find exactly what they need, whether it’s the high-level abstract or the deep-dive methodology, without feeling like they are digging through a wall of text.
The best part is that you can easily customize this research report or create one from scratch using Venngage’s AI Report Generator.
Why this research report structure works?
This format mirrors how professionals actually read and make decisions. Most stakeholders do not read research reports from start to finish. They scan for key findings first, evaluate whether the evidence is reliable and then look for clear recommendations. A structured research report reduces cognitive load and helps readers move from insight to action without confusion.
Solves for decision fatigue
Leading with the executive summary and BLUF respects the reader’s cognitive load. Decision-makers often deal with information overload; providing the conclusion first creates a mental framework that makes the supporting data easier to process. This approach removes the need for the reader to hunt for the primary purpose of the research.
The flow works because:
- The introduction defines the problem and research objectives
- The methodology builds trust through transparency and research design clarity
- Research vitals and metrics establish confidence in the data
- Detailed findings provide evidence before interpretation
- Risk and opportunity assessment explains the implications
- Recommendations translate insights into action
The methodology and research vitals act as foundational proof. In the same way a legal brief relies on cited law, a research report relies on its parameters. Placing these early answers addresses the reader’s skepticism regarding data quality before they review the findings, ensuring the document is viewed as a reliable tool rather than an opinion piece.
Promotes credibility
Placing the methodology early establishes a foundation of trust. Decision-makers need to see the receipts of your data collection, such as sample sizes and source types, before they can accept the findings as valid.
Supports scanability without losing depth
Modern research reports need to work for multiple readers — executives who scan, analysts who validate data and teams who implement recommendations. Mixing structured sections, clear headings and quantitative snapshots allows readers to enter the report at different points without losing context.
This improves:
- Information accessibility
- Data comprehension through visualization and summaries
- Cross-functional usability across departments
Pro tips for effective research report writing
Beyond the structure, the effectiveness of a research report depends on how you handle the nuances of data and language. Use these strategies to ensure your report is both authoritative and usable.
Avoid the data dump
The biggest mistake in research is equating volume with value. Just because you collected a data point doesn’t mean it belongs in the report. If a finding doesn’t directly support a conclusion or mitigate a risk, move it to the Appendix. Your job is to curate the evidence, not just archive it.
Use clusters in recommendations
When presenting the Actionable Path Forward, limit yourself to three primary recommendations per thematic cluster. Stakeholders are more likely to execute a focused plan than a list of twelve competing priorities. High-impact reporting identifies the “levers” that provide the highest ROI for the least amount of friction.
Use neutral tone and actionable words
As a researcher, your credibility is built on objectivity. Avoid marketing adjectives like incredible, disastrous, or amazing. Instead, use neutral, evidence-based descriptors like significant, nominal, or volatile. Let the data provide the drama; your text should provide the stability.
Account for the negative finding
Professional reports do not hide data that contradicts the desired outcome. If the research shows a project is failing or a market is shrinking, highlight it. Documenting a “negative finding” saves the organization from making a bad investment, which is often more valuable than confirming a success.
Write the executive summary last
Only after you have finished the Risk Assessment and Conclusion will you have the clarity needed to distill the entire project into its most potent form. This ensures your “Bottom Line Up Front” is actually the most accurate reflection of the entire document.
FAQs on research report format
1. How often should a research report format be updated?
Standardized formats should be reviewed annually or when industry frameworks shift. In 2026, many organizations are moving toward live reporting, integrating real-time data feeds to eliminate the 30-day lag typical of traditional static files.
2. Why is the methodology section necessary in a business report?
In an environment saturated with synthesized information, the Methodology proves your findings are based on primary research. It details whether you used structured interviews, quantitative surveys, or secondary analysis of corporate filings, distinguishing your work from general summaries.
3. Can I move the conclusion to the top of the report?
Yes. This is known as the “BLUF” method (Bottom Line Up Front). While the template follows a standard flow, high-stakes reports often merge recommendations with the Executive Summary to accommodate time-constrained executives who may only spend 60 seconds on the page.


