


Instagram is one of the most popular social media platforms with over 1 billion monthly users. It is a visual platform and the only way to grab people’s attention on it is to share engaging visual content.
Instagram infographics are a great way to deliver important messages in a visual format. These are easy to read and also provide valuable information in an engaging format.
In fact, infographics are also some of the best visuals you can use to achieve marketing goals, according to 40.8% of marketers, as we found when compiling our recent visual content marketing statistics.

So, if you’re not yet using the power of infographics for Instagram, this post will show you how to best leverage them to engage your audience.
Improve your graphic design for marketing with Venngage’s templates. Choose from hundreds of customizable templates made by experts for non-designers.
Click to jump ahead:
- Importance of Instagram infographics in digital marketing
- 10 tactics to drive more engagement with Instagram infographics
- 6 Instagram infographic templates you can customize now
- FAQs about Instagram infographics
Importance of Instagram infographics in digital marketing
Infographics are one of the best ways to combine visuals and data to inform, engage, and educate your audience in an easy-to-grasp manner.
No one wants to read long, boring posts with lots of text and numbers. Infographics help you convey tons of information in an engaging, visual format.
But that’s not the only reason to use infographics for digital marketing.
Here are some more reasons why infographics are so important:
- They are great for building links from multiple sources using a single piece of content
- Infographics immediately attract audience attention and get people to notice your content
- Useful and visually appealing infographics have a high chance of going viral and getting a lot more views than any regular piece of content
- Infographics with useful and relevant content can establish your authority and expertise in your niche
- These are sharable and reusable assets that are coveted by everyone
- Parts of a good infographic can be reused in several marketing collaterals like flyers and brochures
Overall, infographics offer a lot of benefits and a single infographic can help you attain multiple marketing objectives simultaneously.
10 tactics to drive more engagement with Instagram infographics
Infographics, if used correctly, can help you achieve numerous marketing goals. We have curated a list of the most effective tactics to leverage infographics to your advantage.
Use these tactics for your marketing campaigns and see the results yourself.
1. Write eye-catching headlines
If you want to drive engagement using infographics for Instagram, the first thing that you need to learn is to write catchy headlines.
After all, this is what a viewer will see first in your infographic and it often determines whether they will engage with your content further or not.
What are the qualities of a good headline? Take a look at this example.

This headline immediately draws attention and makes people curious to learn more. Here’s why.
The headline has these four qualities:
- Crisp and to-the-point
- Written in bold font and stands out from the rest of the content
- Relevant to the topic
- Able to convince the audience to stop scrolling
The first three are fairly simple to achieve. It’s the last point where you may face some trouble.
How do you make your headlines compelling? Write headlines that:
- Evoke an emotion
- Generate curiosity
- Shock or intrigue people
- Use stats or numbers
That’s why the above example works. It ticks all these boxes and delivers a powerful and memorable visual.
2. Use high-quality templates
If you intend to create infographic Instagram posts frequently, it makes sense to use Instagram post templates to simplify and speed up the design process.
Creating a new infographic from scratch takes a lot of time and effort that you can save by using Instagram infographic templates. Moreover, you don’t need any Instagram infographic design skills or technical knowledge to use these templates.
Want to know the best part?
Your Instagram carousel infographic will still look professionally designed and visually appealing.
Check out the Instagram infographic template below, for example. It is engaging, visually appealing, and professionally designed, and you can simply use it for your brand.

3. Ensure relevance to the topic
Just because infographics are a visual way of representing things does not mean it’s only the design that matters. You need to do your research and add high-quality content as well.
Every statistic, image, or component you use should relate to the topic of discussion and what your brand offers. The content should also offer value.
You also need to tailor your content according to the needs and preferences of your target audience.
Yahoo Finance, for example, uses the power of Instagram infographic posts the right way. Their audience mainly consists of finance professionals, so they use tons of financial data and charts in their infographics.

If you want to highlight an important statistic, make sure to increase its font size, like in the example below.

4. Split the infographic into sections
One of the best ways to leverage Instagram infographics is to split them into different parts and make an Instagram carousel infographic post.
Instagram carousel posts draw a lot of engagement as people like swiping pictures instead of having to scroll through. So, break your infographic into bite-sized images and post them in the form of a carousel post.
You should also add a heading or subheading for each image and a call-to-action so the audience engagement doesn’t stop with the post.
This infographic template by Venngage is perfect for creating an Instagram carousel post by breaking down a larger infographic into sections.

5. Balance amount of text and images used
This is the golden rule of making the best Instagram infographics—strike a balance between text and visuals.
Don’t make it so design-heavy that it’s lean on content. Also, don’t bore your audience with too much text or information.
Check out this infographic template that has the perfect mix of content and visuals, while also providing enough whitespace.

6. Make it easy for audiences to understand important points
One way of drawing people’s attention to important information is by using visual elements like arrows, lines, circles, etc.
Make important information impossible to miss by pointing to it or highlighting it.
Also, make sure that you do not crowd the information by adding too much text around it. The idea is to make your infographics for Instagram easy to scan and understand without much effort.

The statistic is the most important part and you can’t miss it with a large, red, bold font. It’s clearly highlighted and the focus of the entire infographic is on the stat.
7. Add graphics to your infographics on Instagram
You can’t underestimate the importance of visual appeal when it comes to making engaging infographics on Instagram.
Include visual elements in the form of photos, animations, icons, and pictograms to make your infographic Instagram posts stunning and engaging.
Such visual elements instantly draw users’ attention to your Instagram carousel infographic, when they’re going through their busy feeds. Visuals make Instagram posts stand out.
Check out this engaging Instagram infographic template by Venngage that uses tons of visual elements to make it fun and interesting.

8. Make your content readable on all devices
When making infographics for Instagram, keep in mind that your audience will view your content on multiple devices. So, you need to create infographics for Instagram that are easy to read on different devices, especially mobile devices.
Here are some tips to do that:
- Use easy-to-read fonts
- Strike a balance between text and visuals
- Follow the image size guidelines of the platform
- Use different colors and sections to make it scannable
- Always compress your images to keep the file size low
Venngage, for example, posts infographics on its Instagram account, like this post.
Desktop

Mobile

Image via Instagram
Venngage’s Instagram infographic template on SWOT analysis provides a similar aesthetic with lots of visuals and sections. It’s in the form of an Instagram carousel infographic post and uses many visual elements.

Similarly, this business pitch template also has a visually-rich design with many visual elements and separate sections.

9. Showcase credibility
If you want your audience to engage with your Instagram infographic post and keep coming back to your page, then you need to build some credibility.
Infographics include lots of facts and figures, and if you don’t cite the proper sources, people might not believe the information you are providing. So, make it a point to always cite sources at the end of the infographic.
Alternatively, creatively include sources of your information in your infographic content, for example, including quotes from industry leaders or influencers.
The best part about using infographics on Instagram is that you can simply mention the Instagram accounts of the influencers whose quotes you’re using.
Why?
Because that will bring the influencers’ attention to your infographic and they may even share it with their followers, thus bringing in more views and engagement. This also gives you a chance to build a rapport with these influencers and enroll them in your brand ambassador program.
If you want to extend the reach of your Instagram infographics, you should embed your Instagram feed on your website. You can use your embed tool’s moderation features to approve only infographic style content. You can accompany the feed with a follow button to encourage website visitors to engage with more of your Instagram content.
Check out this Instagram infographic carousel post by Venngage where the sources are clearly mentioned on the last slide.
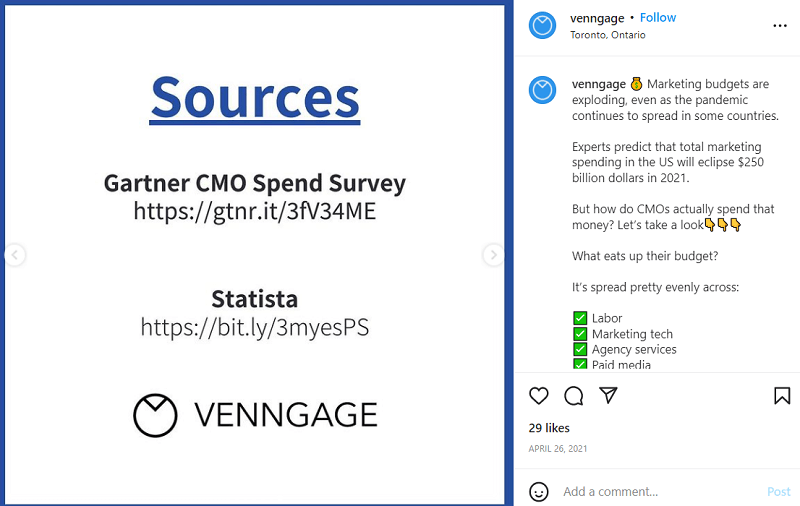
Image via Instagram
If you want different ways to showcase a statistic then check out this template by Venngage to learn how to create a data infographic.

6 Instagram infographic templates you can customize now
Teal data driven Instagram infographics post

This short, sharp infographic has just enough color to attract attention on Instagram. With just a few icons, the visual manages to tell a longer story.
Visuals like this infographic catch the eye without overwhelming the user. And with Venngage, you can easily customize the template by adding your own brand colors.
The Venngage My Brand Kit feature imports your logo, colors, and fonts from your website. And then you can add your branding to all designs with a single click.

Coping with stress Instagram infographics template

This Instagram carousel infographic uses a plethora of icons to tell a story. Not only are icons easy to relate to and understand, but they add universal visual appeal.
Venngage offers 40,000+ icons, including diverse people icons, that you can add to your Instagram posts.
When you choose a template, double-click the icon you want to change. Search for icons in the dialogue box that appears and replace the icon that suits your story.
Nonprofit statistic Instagram infographic

This simple but colorful Instagram infographic post uses one of the tips we’ve already shared in this post. The main statistic is highlighted in a large font.
Additionally, the icon immediately tells the user what the topic is related to. You grab attention with the visual and draw the user’s eye up to the context.
Designing reports Instagram infographics carousel

Here’s another Instagram carousel infographic that uses simple colors, shapes, and diagrams. It’s a great way to focus on data since that’s the topic of the post.
This is a great template if you want to keep your text brief. Note how each slide only includes one short header. The aim is to get maximum impact with the least amount of effort.
Email marketing tip Instagram infographic

Here’s an infographic for Instagram that uses a photo in the background. There are a few design tips working here. The first is the use of the strong neon green color, which is only used for highlights.
The other is the limited use of icons. When you’re using an image as the background, you don’t want to overwhelm the visual with more icons and images.
The background also has a dark overlay that allows the text and icons to pop. If the image was used as-is, it would have overtaken the text.
Venngage has over 4 million free stock photos available in the library. You can replace the image from the editor or upload your own photos.
Gradient nonprofit statistic Instagram infographics post template

When creating infographics on Instagram, you want to make your visuals attractive but not overwhelming. This template uses a blue color palette that is consistent throughout the design.
Choose your colors according to your brand and your message. Remember that Instagram is an extremely visual platform. Everyone is trying to earn users’ attention.
Sometimes, it’s better to use a sedate color tone rather than add every color in the wheel to your design.
FAQs about Instagram infographics
1. What are Instagram infographics?
Infographics are a visual representation of data and information in an easy-to-read manner. Infographic infographics are the infographics that people share via their Instagram posts or stories. These often take the form of carousel posts to show different sections of a larger infographic.
2. What do people use to make infographics for Instagram?
You can use Venngage’s thousands of customizable infographic templates for Instagram. Venngage also has a host of templates for Instagram carousel infographic posts and over 40,000 icons and 4 million free stock photos to customize your infographics.
3. How effective are Instagram infographics?
Infographics can help you attract audience attention and engage them by providing useful information in a visually appealing manner. If used correctly, infographics for Instagram can help you achieve multiple marketing goals.
Conclusion
By now, you should have realized the importance of Instagram infographics and how they can help you drive engagement.
Leverage the tips mentioned above to leverage Instagram carousel infographics the right way and use them to your advantage. If you play your cards right, these can help you get more followers, likes, shares, and comments than ever before.
Start your Instagram campaigns on a high note with Venngage’s infographic templates. Now you can make the design process easier for your marketers while improving engagement on social media.


