


Human resources reports need to serve two key purposes: providing HR insights to management to drive business performance and ensuring compliance with employment law. However, many reports lean too heavily toward one or the other, mostly because of an unclear structure.
Having practiced law before moving into marketing, I have spent a fair amount of time working closely with HR teams on documentation and reporting. In this article, I will share a comprehensive HR report format along with tips and best practices for human resources reporting.
HR report format structure
Before I get into the sections, one thing worth knowing: different stakeholders need different levels of detail. For example, a board or executive audience will focus on trends, risks and implications, while HR team members may need more operational detail.
So you can use the same HR report for both the quarterly business review and the annual board presentation. What changes is the depth of data in each section.
1. Report header and period summary
Start with the basics. Who prepared this report, what period does it cover and which employee population are we looking at? This sounds obvious, but I have seen HR reports land in inboxes with no clear date range, leaving readers to guess whether a turnover figure is quarterly or year-to-date. Do not make your reader work for context.
Include:
- Reporting period (e.g., Q2 2025 or January 2025)
- Report prepared by (HR team or individual)
- Date of issue
- Employee population covered (all staff, specific department, specific region)
- Total headcount at period start and end
2. Workforce snapshot
This section is used in an HR report for decision-making. It works like a dashboard to provide a quick overview of employee data. You can add five or six metrics that define workforce health and overall human resources for this period. Keep it to one page maximum.
According to Gartner, 66% of HR leaders say their workforce planning is limited to headcount planning and struggle to demonstrate ROI for strategic workforce planning.This section is your opportunity to change that. Six well-chosen metrics tell a more complete story than a headcount number alone.
Include:
- Total headcount
- New Hires
- Separations (Total)
- Voluntary turnover rate
- Open roles
- Absenteeism rate
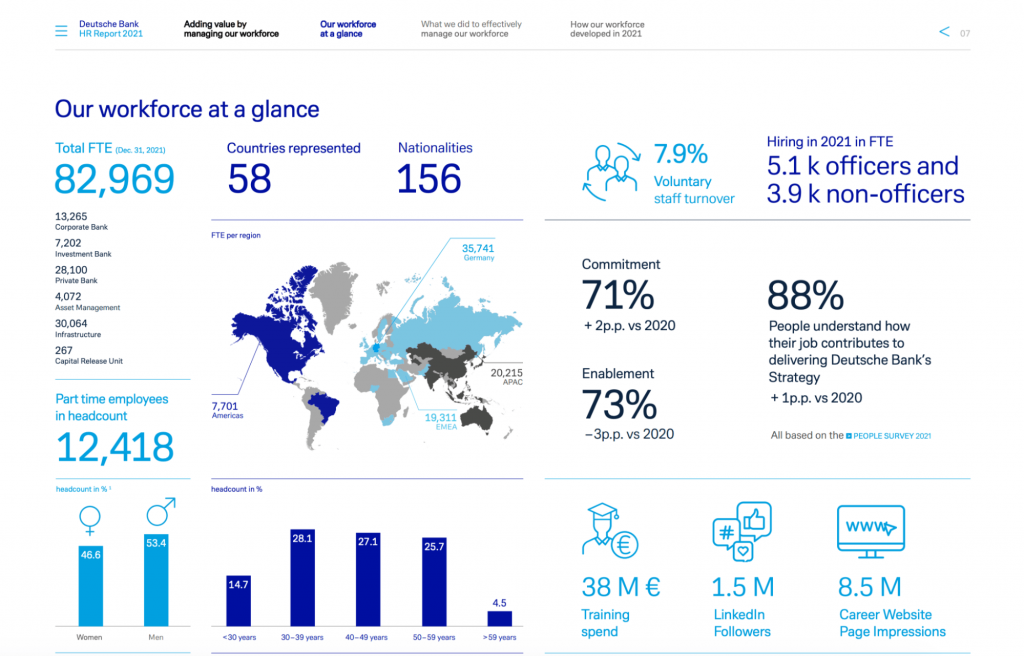
You can also add different types of charts here, depending on your organization’s needs and to help the leadership team understand the data easily. Deutsche Bank’s Annual HR Report, for example, covers employee headcount, new hiring, career website page impressions and employee demographics, all within the workforce snapshot section.
3. Recruitment and headcount analysis
Break down hiring activity for the period. This section answers two questions: are we filling roles at the pace the business needs and are we hiring the right people through the right channels?
Do not just report the number of hires. Report the quality of the pipeline and the cost of filling it.
Include:
- Total hires by department and level
- Time to fill (average days from role opening to accepted offer)
- Time to hire (average days from application to offer)
- Cost per hire
- Offer acceptance rate
- Source of hire breakdown (referral, job board, agency, direct)
- Diversity of new hire cohort (where tracked)
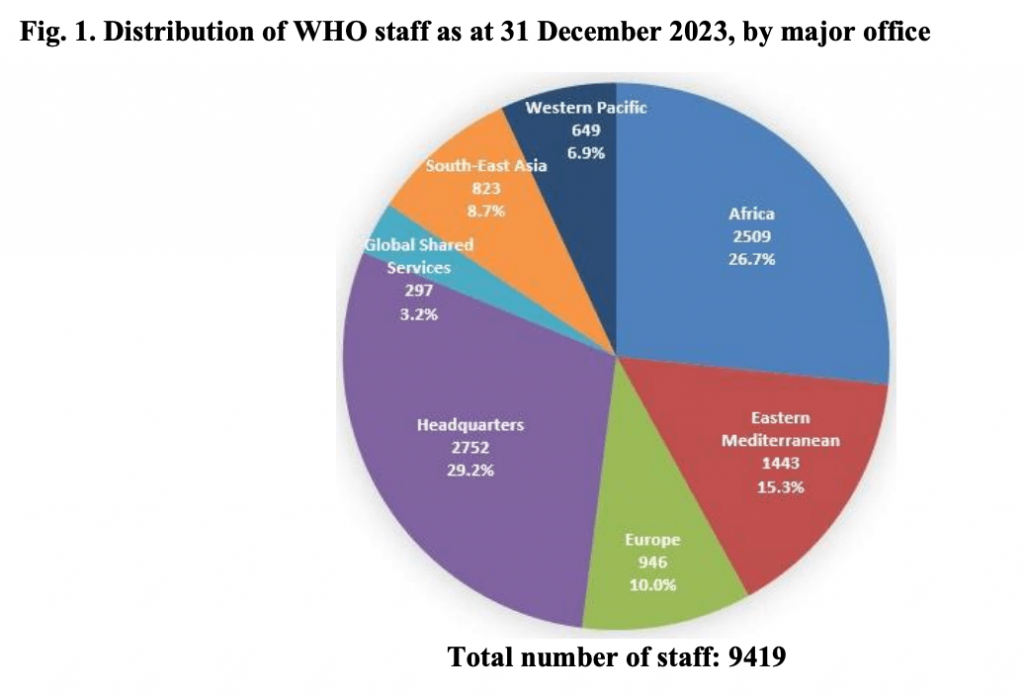
If you want to make it more digestible, add a visual or chart here. For example, WHO’s Annual HR Report uses a pie chart to show recruitment trends.
4. Retention and turnover analysis
Do not just report the overall turnover rate. Break it down by department, tenure band and voluntary versus involuntary separations to provide proper context.
Include:
- Overall voluntary and involuntary turnover rate
- Attrition by department and job level
- Turnover by tenure band (0 to 6 months, 6 to 12 months, 1 to 3 years, 3 years+)
- Top reasons for voluntary departure (exit interview data)
- Regrettable versus non-regrettable turnover split
- High performer retention rate (if tracked)
- Cost of turnover estimate
You also need to provide a thorough analysis of employee turnover. To make this section more contextual, add insights from exit interviews to show patterns in voluntary departure reasons.
Another important metric to include here is employee turnover cost. According to Gallup, replacing a single employee costs anywhere from 50% to 200% of their annual salary, depending on the role. Calculate the total cost of employee turnover to show leadership the real business impact.
5. Performance and learning & development
This section covers how people are performing and whether the business is investing enough in helping them grow.
Some reports just include employee training hours and spending. However, the leadership team needs to know the ROI of L&D programs.
For this, you can cover details like:
- Did performance scores improve in teams with higher training completion?
- Which upskilling programs had the most impact on productivity?
- What is the training ROI — gain from investment minus cost, divided by cost?
- How did the time to productivity change for new hires who completed onboarding training?
- What percentage of employees who completed leadership development programs were promoted internally?
6. Employee engagement and well-being
This section gives leadership a read on workforce sentiment and organizational health. Include data from your most recent pulse survey or annual engagement survey and break it down by department, tenure and management level.
Include:
- Overall employee engagement score
- Engagement score by department, tenure and management level
- Employee Net Promoter Score (eNPS)
- Pulse survey response rate
- Absenteeism rate and trends
- Burnout and stress indicators (where tracked)
- Wellbeing program participation rate
- Manager effectiveness scores
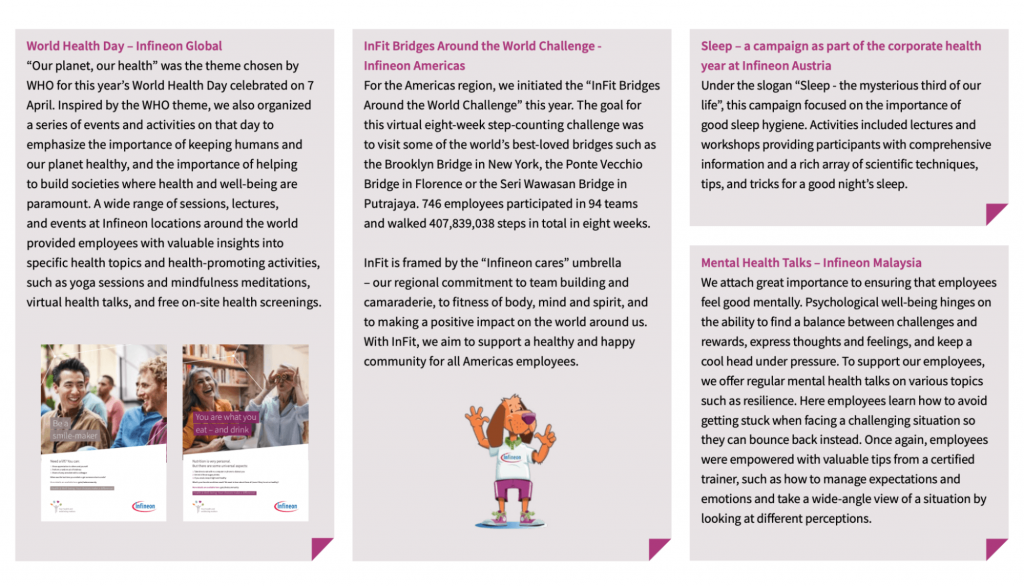
Infineon’s HR Report, for example, covers different campaigns launched by the company to promote employees’ well-being.
7. Compensation and payroll summary
This section covers whether your pay structure is competitive, fair and sustainable. It is one of the most scrutinized sections by both leadership and employees, especially as pay transparency laws continue to expand across more states and countries.
Include:
- Total compensation spend as a percentage of revenue
- Average salary by department, job level and tenure
- Salary increase percentage this period
- Pay equity analysis across gender, ethnicity and role
- Bonus and incentive payout rates
- Benefits utilization rate
- Benefits cost per employee
- Compa-ratio (how salaries compare to market midpoints)
Make this section more relevant by adding benchmark against market data. For example, if your average salary for a mid-level software engineer is $95,000 and the market median for your region is $110,000, that gap needs to be visible to both leadership and employees.
8. Diversity, equity and inclusion (DEI) metrics
This section should go beyond headcount diversity. A workforce that looks diverse at the total level can still have significant representation gaps at senior levels. Always break the data down by seniority, department and function.
Include:
- Workforce demographic breakdown by gender, ethnicity, age and disability status
- Representation across leadership levels (manager, director, executive, board)
- Hiring pipeline diversity at each stage
- Promotion and advancement rates by demographic group
- Voluntary turnover by demographic group
- Gender and ethnicity pay gap analysis
- Employee Resource Group participation rates
- Inclusion index score from engagement surveys
9. HR operations and compliance
Think of this section as the health check for the HR function itself. Are cases being resolved on time? Are employees completing mandatory training? Are filings going out before deadlines? These are not glamorous questions but the answers tell leadership whether HR is running well or just running.
According to HR.com’s State of Legal Compliance and Employment Law 2025 survey, only one third of organizations take a proactive approach to labor law compliance. This section is where you demonstrate which category your organization falls into.
On the operations side, cover your case load and resolution data:
- Open and resolved HR cases by category (employee relations, grievances, disciplinaries)
- Average case resolution time
- Employment tribunal claims filed, resolved and pending
- HR system issues or process gaps identified this period
For compliance, report your regulatory standing and training status:
- Status of mandatory filings (EEO-1, OSHA, VETS-4212 where applicable)
- Workplace safety incidents and OSHA recordable events
- Compliance training completion rates by department
- Active or pending litigation
- Data privacy and employee records audit findings
Close the section by noting any policy changes made this period and what drove them. New legislation, an internal audit finding, or a pattern in employee relations cases are all valid reasons. Leadership does not just want to know what changed. They want to know why.
10. HR strategy and outlook
The last section of every HR report should answer one question: What does leadership need to decide or act on based on what this data shows?
Start by summarizing the two or three biggest workforce risks or opportunities you are carrying into the next period based on what the data in this report has surfaced. Then outline your HR priorities and connect them to the business goals they support.
According to Gartner, the top CHO priorities and HR trends for 2026 would be:
- Leveraging AI to streamline HR operations
- Shaping work in the human-machine era
- Mobilizing leaders for growth in an uncertain world
- Addressing culture atrophy to power performance
You can address how you’ll shape the strategy based on these trends. Use this section to show where your HR strategy for the next period maps to these priorities. Which ones are you already working on? Which ones represent gaps? That honest assessment is what makes this section valuable to leadership rather than just aspirational.
HR report template
Here’s a sample report template you can use for annual HR reporting.
HR Report: [Q1 / Q2 / Q3 / Q4 / Annual] [20XX]
Prepared by: [Name / HR Team]
Reporting Period: [Start Date] to [End Date]
Date of Issue: [Date]
Employee Population Covered: [All Staff / Department / Region]
(Confirm the basics before anything else. Do not make your reader guess whether a turnover figure is monthly, quarterly, or year-to-date.)
Headcount at Period Start: [X]
Headcount at Period End: [X]
Net Change: [+/-X]
Scope Notes: [Any exclusions, new entities, or population changes to flag…]
(Five to six metrics that define workforce health this period. Keep to one page. Add charts here for quarterly and annual reports.)
| Metric | Current Period | Prior Period | Change |
| Total Headcount | [X] | [X] | [+/-] |
| New Hires | [X] | [X] | [+/-] |
| Separations (Total) | [X] | [X] | [+/-] |
| Voluntary Turnover Rate | [X]% | [X]% | [+/-]% |
| Open Roles | [X] | [X] | [+/-] |
| Absenteeism Rate | [X]% | [X]% | [+/-]% |
Charts: [Insert headcount trend, turnover trend, or demographic breakdown visual here]
(Report the quality of the pipeline and the cost of filling it, not just the number of hires.)
Total Hires by Department and Level: [Write here or insert table…]
Time to Fill (avg. days): [X days]
Time to Hire (avg. days): [X days]
Cost Per Hire: [$X]
Offer Acceptance Rate: [X]%
Source of Hire: Referral [X%] | Job Board [X%] | Agency [X%] | Direct [X%]
Diversity of New Hire Cohort: [Write here where tracked…]
Chart: [Insert source of hire pie chart or time-to-fill trend here]
(Break down by department, tenure band, and voluntary vs. involuntary. Include exit interview data and calculate total cost — replacing a single employee costs 50% to 200% of their annual salary.)
Overall Voluntary Turnover Rate: [X]%
Overall Involuntary Turnover Rate: [X]%
Turnover by Department and Level: [Insert table or write here…]
Turnover by Tenure Band: 0–6 months [X] | 6–12 months [X] | 1–3 years [X] | 3+ years [X]
Top Reasons for Voluntary Departure: [Exit interview data — list top 3 reasons…]
Regrettable vs. Non-Regrettable Split: Regrettable [X]% | Non-Regrettable [X]%
High Performer Retention Rate: [X]%
Estimated Cost of Turnover This Period: [$X] based on [X] departures
(Cover how people are performing and whether the business is investing enough in helping them grow. Go beyond training hours — report the ROI of L&D programs.)
| Performance Metrics | L&D Metrics |
| Performance rating distribution [Write here…] | Training hours per employee [X hrs] |
| Performance review completion rate [X]% | Training spend per employee [$X] |
| High performer identification rate [X]% | Mandatory training completion rate [X]% |
| Internal promotion and mobility rate [X]% | Skills gaps identified vs. addressed [X/X] |
| Employees on PIPs [X] | Certifications earned this period [X] |
L&D ROI Analysis: [Did performance scores improve in teams with higher training completion? Which programs had the most impact? Write here…]
(Include data from your most recent pulse or annual engagement survey. Break down by department, tenure, and management level.)
Overall Engagement Score: [X] / 10 or [X]%
Engagement by Department / Tenure / Management Level: [Write here or insert table…]
Employee Net Promoter Score (eNPS): [X]
Pulse Survey Response Rate: [X]%
Burnout / Stress Indicators: [Write here where tracked…]
Wellbeing Program Participation Rate: [X]%
Manager Effectiveness Scores: [X] / 10 or [X]%
EAP Utilization Rate: [X]%
(Cover whether your pay structure is competitive, fair, and sustainable. Benchmark against market data where possible.)
Total Compensation Spend (% of Revenue): [X]%
Average Salary by Department / Level / Tenure: [Insert table or write here…]
Salary Increase % This Period: [X]%
Pay Equity Analysis: [Gender gap [X]% | Ethnicity gap [X]% | Write here…]
Bonus and Incentive Payout Rate: [X]%
Benefits Utilization Rate: [X]%
Benefits Cost Per Employee: [$X]
Compa-Ratio: [X] (how salaries compare to market midpoints)
Market Benchmark Note: [e.g., Average salary for mid-level [role] is $[X] vs. market median of $[X] — flag the gap if significant]
(Go beyond total headcount diversity. Break data down by seniority, department, and function. A workforce that looks diverse at total level can have significant gaps at senior levels.)
Workforce Demographic Breakdown: [Gender / Ethnicity / Age / Disability — where tracked and legally permissible…]
Representation at Leadership Levels: [Manager / Director / Executive / Board — same breakdown…]
Hiring Pipeline Diversity at Each Stage: [Write here…]
Promotion Rates by Demographic Group: [Write here…]
Voluntary Turnover by Demographic Group: [Write here…]
Gender and Ethnicity Pay Gap: [X]%
Employee Resource Group Participation Rate: [X]%
Inclusion Index Score: [X] (from engagement survey)
(Health check for the HR function itself. Are cases resolved on time? Are filings going out before deadlines? This section shows whether HR is running well or just running.)
Open HR Cases by Category: [Employee Relations / Grievances / Disciplinaries — number open and resolved…]
Average Case Resolution Time: [X days]
Employment Tribunal Claims: Filed [X] | Resolved [X] | Pending [X]
Mandatory Filing Status: [EEO-1 / OSHA / VETS-4212 — status and deadline compliance…]
Workplace Safety Incidents: [X] total | OSHA Recordable Events [X]
Compliance Training Completion Rate: [X]% by department
Active or Pending Litigation: [Write here…]
Data Privacy and Records Audit Findings: [Write here…]
Policy Changes This Period: [What changed and why — new legislation, audit finding, or pattern in ER cases…]
(Answer one question: what does leadership need to decide or act on based on what this data shows? Name the 2–3 biggest workforce risks or opportunities and connect HR priorities to business goals.)
Top Workforce Risks Heading into Next Period: [List 2–3 risks with supporting data from this report…]
HR Priorities for Next Period: [List priorities and connect each to the business goal it supports…]
Metrics to Watch: [Which numbers need monitoring in the next reporting period and why…]
| Recommended Action | Owner | Deadline |
| [Action] | [Name / Team] | [Date] |
| [Action] | [Name / Team] | [Date] |
| [Action] | [Name / Team] | [Date] |
| [Add action] | [Name / Team] | [Date] |
Venngage HR Report Template
HR reports cover a lot of data, including workforce insights, compliance status, engagement scores, turnover trends and strategic priorities. If you rely on a text-heavy format, important data gets buried.
That’s why visual formatting and data visualization is important in HR reports. Properly formatted sections accompanied by charts, icons and tables help understand the data better.
Venngage’s HR report templates are built for exactly this. Each template comes with pre-formatted metric tables, chart placeholders for trend data and modular section blocks you can reorder to match your reporting cycle.
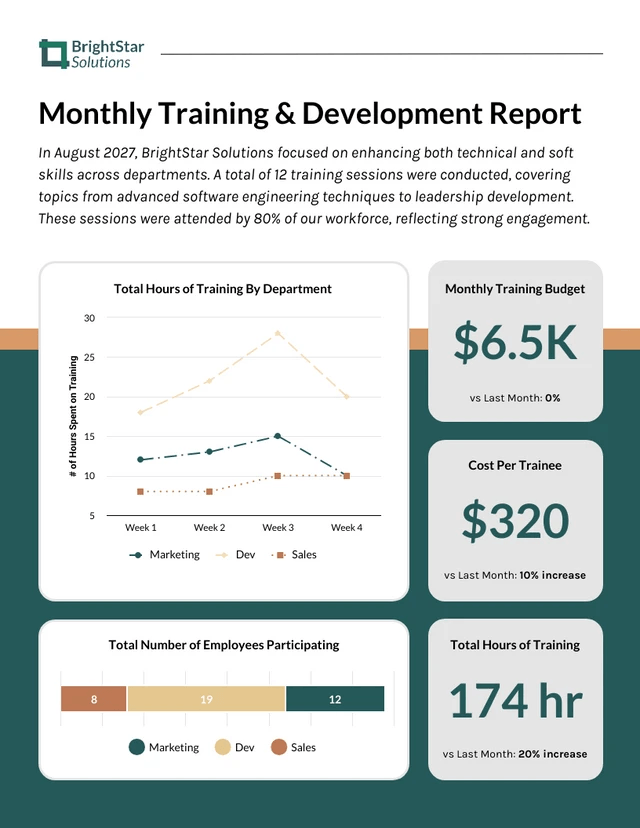
For example, Venngage’s Monthly Training and Development Report Template provides a dashboard layout to display key metrics like training hours, program completion rates and skills development progress in a format that is easy to scan and present to leadership. If your organization runs ongoing learning programs and you want to show ROI without building a report from scratch, this is a good starting point.
And if you want to show diversity, equity and inclusion statistics, you can use this Yearly Diversity and Inclusion HR Report Template
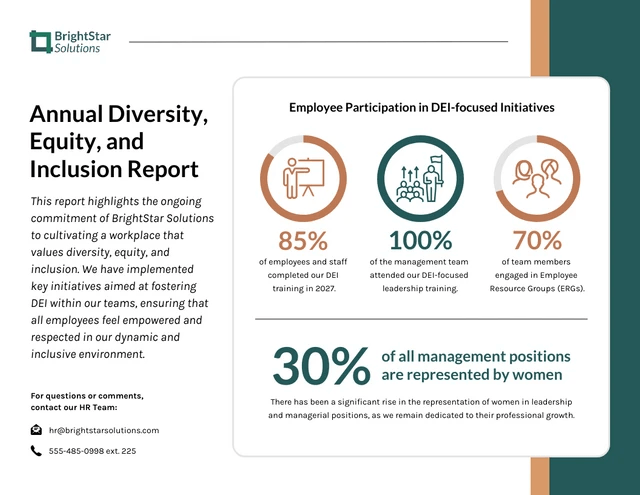
It structures diversity data visually — workforce demographic breakdowns, representation across leadership levels and pay gap analysis to makes patterns and gaps immediately visible.
You can customize any template using Venngage’s AI Report Generator, including uploading your brand colors, fonts and logo in a single step.
Why this HR report format works
Most HR reports answer workforce questions in isolation. Turnover data sits separately from engagement data. Compliance lives in a different document. Performance reviews are in a separate system. When data is fragmented, leadership cannot see the connections — and it is the connections that matter.
This format for HR reports brings everything into one place
Ties people data to business results
When a CHRO or CEO looks at workforce data, they are asking four things in order: Do we have the right people? Are we keeping them? Are they performing? And are we protected legally?
Every section in this format answers one of those questions, in that sequence. By the time leadership reaches the outlook section, they have the full workforce context to make better decisions.
Covers metrics most reports skip
A single turnover rate tells you very little. Breaking it down by tenure band, department and voluntary versus involuntary. This helps understand where the problem actually is. Same with training. Hours and spend mean nothing without ROI. This format pushes you to report the deeper cut of every metric, which is what makes it useful in a boardroom.
Keeps compliance visible
When compliance sits in a separate document, it only gets attention when something goes wrong. Putting it in the same report as workforce and strategy data means leadership sees regulatory status alongside business performance every single reporting cycle.
Ends with action
The outlook section explains the path ahead. What are the top risks? What decisions need to be made? What does HR need from leadership to move forward? That one section is the difference between a report that gets filed and one that drives a conversation.
Pro tips for effective HR report writing
Here are some more tips on how to make your HR report truly valuable.
Only report what requires a decision
Do not include every metric you track. Report the ones that changed, the ones trending in the wrong direction and the ones that need leadership input. Everything else adds length without adding value.
Write the outlook section first
It forces you to know what story you are trying to tell before you start pulling data. Once you know the key risks and priorities, the rest of the report writes itself around them.
Pair every metric with context
A number without context is just a number. Put your turnover rate next to last quarter. Put your engagement score next to the department breakdown. Put your training spend next to the ROI. The comparison is what makes the data actionable.
Never separate engagement from retention
Your engagement score and your voluntary turnover rate explain each other. Report them close together with a clear line connecting the two. If they sit in separate sections with no cross-reference, leadership will miss the most important insight in the report.
FAQs on HR Report Format
What should be included in an HR report?
A comprehensive HR report should cover workforce snapshot, recruitment, retention, performance, engagement, compensation, DEI, compliance and strategy. The depth of each section depends on whether you are reporting quarterly or annually.
How often should HR reports be prepared?
Quarterly and annual are the most common cycles for comprehensive HR reports. Quarterly reports go to department heads and senior leadership. Annual reports go to the executive team, board and where required, government authorities.
Who should receive the HR report?
It depends on the reporting cycle. Quarterly reports typically go to department heads and senior leadership. Annual reports go to the executive team, board of directors and relevant regulatory authorities.
What HR metrics are most important to track?
Turnover rate, cost of turnover, time to fill, engagement score, training ROI and pay equity are the metrics that most directly connect workforce performance to business outcomes.
How long should an HR report be?
There is no fixed length. A quarterly report can be 10 to 15 pages. An annual report can run longer. What matters is that every section has a purpose and no data is included without context.


