


An annual report presents a company’s financial performance and operational decisions to regulators, shareholders, analysts, investors, and prospective partners. Beyond compliance, it tells the story of how the company performed in the last fiscal year and where it is heading next.
But how do you structure it so the data actually lands?
After analyzing 20+ annual reports across industries, from FTSE 100 companies to mid-market public firms, and drawing on the International Financial Reporting Standards (IFRS), the SEC’s Regulation S-K disclosure requirements, and the Integrated Reporting Framework developed by the IFRS Foundation, I’ve identified the exact sections every corporate annual report needs and the logic behind why each one belongs where it does.
Annual report format structure
Annual reports are data-heavy by nature. They carry financial statements, operational performance numbers, governance disclosures, and forward-looking projections. A plain, text-only format will technically satisfy regulatory requirements, but it won’t help management, board members, and shareholders actually process what the data means.
Here is the structure that balances regulatory completeness with narrative clarity.
1. Cover page and table of contents
The cover page sets the tone for how seriously the organization takes its reporting obligations. A clean, professional cover should include the company name, fiscal year, legal registration number, and the regulatory body the report is filed with (SEC, Companies House, SEBI, etc.).
The table of contents is a functional infrastructure. For reports that regularly exceed 80 to 120 pages, it must be page-anchored so auditors and analysts can navigate directly to the data they need rather than hunting through dense sections for a single disclosure.
Include:
- Company name and logo
- Fiscal year (e.g., “Annual Report FY2024”)
- Filing date and regulatory reference
- Detailed, page-referenced table of contents
2. Letter from the CEO/Chairman’s Statement
This is the only section in the annual report where the organization speaks in a direct human voice. Investors and journalists typically read it before any financial data.
The letter should not be a summary of the financials. It should explain what decisions were made under uncertainty, and where leadership is directing the company next.
Include:
- Honest assessment of the year’s performance (including setbacks)
- Key strategic decisions and the rationale behind them
- Priorities for the next fiscal year
- Acknowledgment of material risks or market challenges
3. Company overview and business model
Before a first-time investor or new analyst can interpret the financial data, they need a clear picture of what the business does and how it generates value. This section answers that question directly.
Cover the company’s core operating segments, primary revenue streams, customer base, and competitive positioning.
Include:
- Business description and operating segments
- Revenue model and primary income sources
- Key markets, geographies, and customer segments
- Competitive landscape overview
- Value chain or operating model diagram
4. Financial highlights and performance metrics
Before the full financial statements, readers need a high-level snapshot. This section is the data dashboard of the report: a fast-scan summary of the numbers that matter most, presented visually before the detail arrives.
Think of it as the answer to the question every investor asks first: “Was it a good year?”
Include:
Accompany this table with 2 to 3 visual charts covering revenue trend, profit margin over 3 to 5 years, and segment breakdown. Dense tables alone slow processing time and bury the headline story.
5. Management discussion and analysis (MD&A)
The MD&A is the analytical backbone of the annual report. Management explains what drove performance, what headwinds were encountered, and what the outlook looks like.
Under SEC Regulation S-K, the MD&A must address liquidity, capital resources, and known trends or uncertainties that may materially affect results. The IFRS equivalent requires similar narrative transparency.
Include:
- Revenue and margin analysis by segment
- Cost structure and operating efficiency review
- Discussion of one-off items vs. recurring performance
- Liquidity position and cash flow commentary
- Material risks that affected results
- Forward-looking guidance (where regulatory frameworks permit)
- Key performance indicators (KPIs) vs. prior year and targets
A strong MD&A anticipates the analyst’s next question and answers it before it’s asked.
6. Corporate governance report
Institutional investors and ESG-focused funds pay close attention to governance disclosures. This section documents how the organization is structured to make sound decisions, manage conflicts of interest, and maintain accountability to its stakeholders.
Include:
- Board composition (names, roles, independence status, tenure)
- Board committee structure (Audit, Remuneration, Nomination)
- Director attendance records
- Executive compensation framework and rationale
- Related-party transactions
- Internal control mechanisms and whistleblower policies
- Shareholder rights and engagement policy
7. Risk management framework
Every material risk the company faces must be documented, categorized, and mapped to the mitigation strategy in place. This is not a legal formality. It is the section that separates well-governed organizations from those that paper over problems.
Use a risk matrix format to give readers a clear view of probability versus impact, and be explicit about which risks materialized during the fiscal year.
Include:
8. ESG and sustainability report
ESG reporting has moved from optional to expected, and in many jurisdictions it is now mandated. The EU Corporate Sustainability Reporting Directive (CSRD) and the SEC’s climate disclosure rules reflect a global shift toward treating sustainability as a business performance issue, not a PR exercise.
Include:
- Carbon emissions and energy consumption data (Scope 1, 2, and 3 where applicable)
- Workforce data (headcount, diversity metrics, staff turnover)
- Community and social investment programs
- Alignment with UN Sustainable Development Goals or GRI Standards
- Board-level ESG oversight structure
- Year-on-year progress against stated targets
9. Full financial statements
This is the regulatory core of the annual report. All financial statements must be prepared under the applicable accounting standard (IFRS or US GAAP) and audited by an independent external auditor.
Include:
- Income Statement (Profit and Loss)
- Balance Sheet (Statement of Financial Position)
- Cash Flow Statement
- Statement of Changes in Equity
- Notes to the Financial Statements (accounting policies, segment data, contingent liabilities)
- Independent Auditor’s Report
Do not summarize or abbreviate the financial statements. They must appear in full, in the format prescribed by the applicable accounting standard.
10. Forward-looking strategy and outlook
This section translates everything in the report into a forward-facing picture. It explains what the company plans to do with the position the report has established.
Include:
- Strategic priorities for the next fiscal year
- Capital allocation plan (capex, dividends, buybacks, acquisitions)
- Market outlook and growth assumptions
- Key milestones or targets the company is committing to
11. Appendices and supplementary data
Move granular data that supports the main findings but does not need to sit in the body of the report to the appendix. This includes detailed subsidiary financial data, full board biographies, glossaries of financial terms, and any additional regulatory disclosures.
Annual report template
Annual Report: FY[20XX]
Prepared by: [Name / Department]
Date: [Filing Date]
Filed with: [SEC / Companies House / SEBI]
Registration No.: [Company Registration Number]
(Write in first person. Assess the year honestly — wins and setbacks. Explain the 2–3 most important decisions and why. State priorities for next year. Avoid vague optimism.)
[Write CEO letter here…]
(Describe what the company does, how it earns revenue, which markets it serves, and what sets it apart from competitors.)
Business Description: [Write here…]
Operating Segments: [List segments with a one-line description each…]
Revenue Model: [Subscription / Product / Services / Licensing / Other…]
Key Markets and Geographies: [Write here…]
Competitive Positioning: [Write here…]
(Fill this table before writing any other section. These metrics set the KPI framework for the entire report.)
| Metric | FY[Current] | FY[Previous] | % Change |
| Total Revenue | $[X]M | $[X]M | [+/-]% |
| Gross Profit | $[X]M | $[X]M | [+/-]% |
| EBITDA | $[X]M | $[X]M | [+/-]% |
| Net Profit | $[X]M | $[X]M | [+/-]% |
| Earnings Per Share (EPS) | $[X] | $[X] | [+/-]% |
| Dividend Per Share | $[X] | $[X] | [+/-]% |
| Return on Equity (ROE) | [X]% | [X]% | — |
| Total Assets | $[X]M | $[X]M | [+/-]% |
| Operating Cash Flow | $[X]M | $[X]M | [+/-]% |
Charts: [Insert revenue trend (3–5 yr), profit margin over time, segment revenue breakdown]
(Explain the why behind the numbers. Be specific — name products, markets, or cost shifts. If the year underperformed against guidance, say so and explain why.)
Revenue and Margin Analysis by Segment: [Write here…]
Cost Structure and Efficiency Review: [Write here…]
Liquidity and Cash Flow Commentary: [Write here…]
Material Risks That Affected Results: [Write here…]
KPIs vs. Prior Year and Targets: [Insert KPI comparison table here…]
Forward-Looking Guidance: [Write here. Label all projections as forward-looking and include cautionary language.]
(Document board structure, compensation framework, and accountability mechanisms.)
Board Composition: [List directors — name, role, independence status, tenure…]
Committee Structure: [Audit / Remuneration / Nomination — chair and meeting frequency…]
Executive Compensation: [Base, bonus criteria, LTIPs, KPI alignment…]
Related-Party Transactions: [Disclose any transactions, value, and approval process…]
Internal Controls and Whistleblower Policy: [Write here…]
(List every material risk. Assign likelihood and impact. Be explicit about which risks materialized this year.)
| Risk Category | Description | Likelihood | Impact | Mitigation |
| Market Risk | [e.g., currency volatility] | [H/M/L] | [H/M/L] | [e.g., hedging policy] |
| Operational Risk | [e.g., supply chain] | [H/M/L] | [H/M/L] | [e.g., diversified suppliers] |
| Regulatory Risk | [e.g., new compliance rules] | [H/M/L] | [H/M/L] | [e.g., compliance team] |
| Cybersecurity Risk | [e.g., data breach] | [H/M/L] | [H/M/L] | [e.g., ISO 27001] |
| [Add Risk] | [Description] | [H/M/L] | [H/M/L] | [Mitigation] |
(Report performance data against each pillar. If data is still immature, disclose what you have and state what improvements are planned.)
Environmental: Scope 1 [X tCO2e] | Scope 2 [X tCO2e] | Energy [X MWh] | Renewable [X%]
Social: Headcount [X] | Turnover [X%] | Gender diversity in leadership [X%] | Training hours per employee [X]
Governance: Board independence [X%] | Board gender diversity [X%] | Audit committee meetings [X/yr]
SDG Alignment: [List applicable UN SDG numbers]
Progress vs. Targets: [List targets and status: On Track / Behind / Achieved]
(Prepared under IFRS or US GAAP. Do not summarize or abbreviate. Must appear in full.)
Income Statement (P&L): [Insert here…]
Balance Sheet: [Insert here…]
Cash Flow Statement: [Operating / Investing / Financing activities…]
Statement of Changes in Equity: [Insert here…]
Notes to Financial Statements: [Accounting policies, segment data, contingent liabilities…]
Independent Auditor’s Report: [Insert signed report including audit opinion and key audit matters…]
(State where the company is directing capital next. Label all projections as forward-looking and include cautionary language.)
Strategic Priorities: [List 3–5 priorities with how success will be measured…]
Capital Allocation Plan: [Capex / Dividends / Buybacks / Acquisitions / R&D…]
Market Outlook and Assumptions: [State assumptions underpinning projections…]
Committed Targets: [Specific measurable milestones for next 12–24 months…]
Disclaimer: [This section contains forward-looking statements subject to risks and uncertainties. The company undertakes no obligation to update these statements after the date of this report.]
(Supporting material that does not belong in the main body.)
Appendix A: Subsidiary Financial Statements
Appendix B: Full Board Biographies
Appendix C: Glossary of Financial Terms
Appendix D: Granular ESG Data Tables
Appendix E: Additional Regulatory Disclosures
Appendix F: [Add as needed…]
Venngage’s annual report template
Text-only annual reports meet disclosure requirements, but they create cognitive overload for the exact people you most need to keep engaged. Investors, analysts, and board members receive dozens of similar documents each reporting season. A dense document with no visual hierarchy is the one they skim and set aside.
Visual annual report templates solve a structural problem. They separate the information hierarchy visually so readers can scan for what they need without losing context. Venngage offers well-designed annual report template with color coding to distinguish financial from governance sections, consistent chart formatting across all data visualizations, and clear typographic hierarchy to signal what is a headline finding versus a supporting detail.
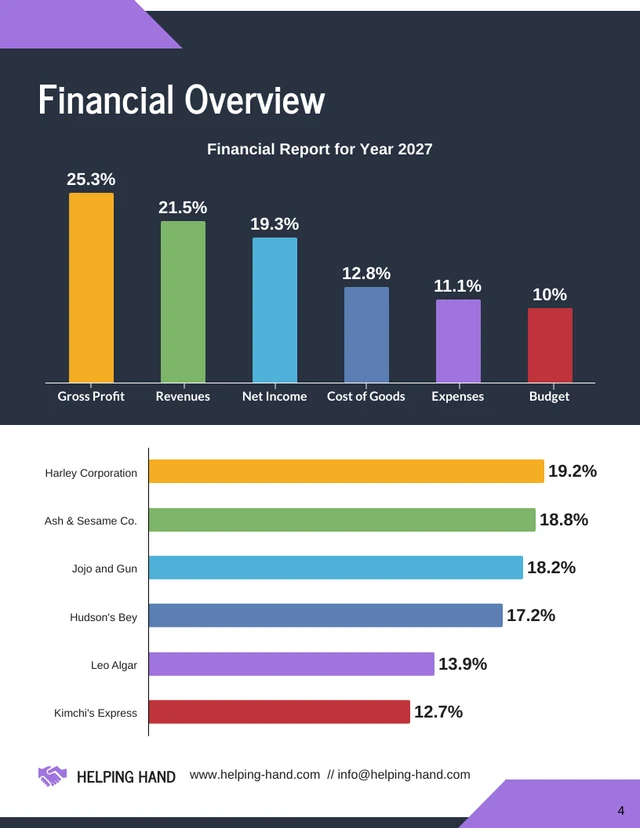
For example, this White Nonprofit Annual Nonprofit Annual Report Template follows the format mentioned above, but still has a visual appeal to make the annual report presentable.

It also has specialised sections to visualize financial performance and other important insights.
Venngage’s annual report templates have pre-formatted financial table layouts, chart placeholders sized for the most common data types, and modular section blocks you can reorder to fit your specific reporting framework. You can customize any template using Venngage’s AI Report Generator, including uploading your brand colors, fonts, and logo in a single step.
Why this annual report structure works
Follows how stakeholders actually read reports
Most stakeholders do not read annual reports front to back. A CFO reviewing a competitor’s filing goes straight to the MD&A and cash flow statement. An ESG fund analyst heads directly to the sustainability section. An institutional investor reads the CEO letter, checks the financial highlights, and scans the risk register.
The structure above is built around these real reading patterns. The financial highlights section exists because most readers need to know the headline performance before they will commit time to the detail. Placing it before the MD&A respects that reality.
Separates narrative from evidence
The CEO letter tells the story. The MD&A explains the numbers. The financial statements prove the claims. When these three functions get blurred, when management commentary sneaks into the financial statements or the CEO letter fills with financial jargon, the report loses both clarity and credibility.
Keeping these sections structurally separate makes the document easier to audit, easier to challenge, and easier to trust.
builds credibility progressively
The governance and risk sections sit in the middle of the report, after the financial picture is established but before the full financial statements arrive. This placement is deliberate. By the time a skeptical reader reaches the audited financials, they have already seen evidence that the organization has a functioning board, a documented risk management process, and a transparent approach to known uncertainties. That context makes the numbers more credible.
Serves multiple audiences without becoming four different documents
Annual reports serve regulators, shareholders, analysts, employees, potential partners, and media simultaneously. The modular structure above, with clearly labeled sections and visual data summaries, allows different readers to enter at different points without losing the narrative thread. Executives scan the highlights. Analysts drill into the MD&A and financial notes. Governance specialists go to the board section.
Pro tips for effective annual report writing
Treat the MD&A like a legal document.
The Management Discussion and Analysis section is reviewed by regulators looking for gaps between what the numbers show and what management says. Write it with the same precision you would apply to a legal disclosure: specific, evidence-based, and balanced. If the year underperformed against guidance, say so directly and explain why. Auditors and experienced investors will find the gap regardless; owning it builds more credibility than burying it.
Set your financial highlights table before you write anything else
The five or six metrics you choose for the highlights section signal what the company believes is most important about its performance. Choose them carefully. They become the implicit KPI framework that readers use to evaluate everything else in the report. Then write the CEO letter and MD&A in direct relationship to those metrics.
Write the CEO letter early, not last
Most companies draft the CEO letter after everything else is done. This produces a letter that reads like a summary, not a perspective. Write a draft early based on your strategic narrative, then revise it once the financial statements are finalized. The result sounds like a leader’s view of the year, not a communications team’s distillation of it.
Use consistent chart formatting across every data visualization
When bar charts, line graphs, and pie charts each use different color schemes, typefaces, and axis conventions, the report looks assembled rather than designed. Readers notice the inconsistency and unconsciously attribute it to the underlying data.
FAQs on annual report format
1. How long should an annual report actually be?
There is no regulatory minimum, but most public companies land between 80 and 120 pages. The more useful question is what is making yours long. If it’s financial notes and compliance disclosures, that length is unavoidable. If it’s dense narrative sections with no visual breaks, that’s a formatting problem. Anything that can be shown in a chart should not be written out in paragraph form.
2. How do I structure an annual report so different readers can find what they need?
Use a page-anchored table of contents, not just a list of section names. Label each section clearly so a CFO can jump to the MD&A and an ESG analyst can jump to sustainability without reading the whole document. Color-coding or tabbed section dividers in designed versions help further. The goal is that no reader should have to scroll or flip through pages looking for their entry point.
3. Where do charts and data visualizations go in an annual report?
Directly alongside the data they support, not grouped into a separate visuals section. A revenue chart belongs in Financial Highlights, not appended at the back. Readers process numbers faster when the visual is next to the table, not three pages away.
4. How much text should the CEO letter actually be?
One to two pages maximum. Most run too long because they try to summarize the entire report instead of making a singular argument about the year. If your CEO letter is longer than two pages, it is a summary, not a letter. Cut everything that is already covered in the MD&A or financial highlights and leave only what only the CEO can say.


