


There’s no denying that complex business processes can be a major pain point. With a staggering 95% of businesses grappling with unstructured data and 40% of those dealing with it regularly, the challenge is clear.
It’s no wonder that 85% of business leaders see workflow automation as the key to freeing up time to focus on strategic planning. While automation tools certainly have their place, there’s a powerful, often overlooked asset in the battle to simplify complexity: infographics.
Unlike boring text or confusing spreadsheets, infographics turn complicated stuff into something you can actually understand. Studies show people remember 65% of information when it’s paired with pictures, compared to a measly 10% with just words. So, if you want to make your team smarter and more efficient, infographics are your secret weapon.
If you’re curious about how to make your business processes easier to manage, you’re in the right place. In this article, I’ll show you how you can create infographics to simplify intricate business processes. By turning data into pictures, you can speed up your team and help everyone focus on achieving bigger goals.
Click to jump ahead:
- What are complex business processes?
- Benefits of using infographics to map out and simplify business processes
- Integrating infographics into your business processes
- Actionable steps for creating process-oriented infographics
- Venngage: Your go-to tool for designing infographics that enhance business efficiency
- Transform your business processes with infographics
What are complex business processes?
A process is simply a sequence of steps to achieve a result. While this applies to many things, business processes are unique because they involve people, systems and often, a specific goal for the company.
Complex business processes on the other hand are essentially a series of interconnected tasks and activities within an organization that are intricate and often difficult to manage. They typically involve:
Multiple steps: They consist of several stages or actions that need to be completed in a specific order.
Interdependencies: Different tasks or stages rely on each other, making changes or disruptions in one area affect the entire process.
Variable data: They involve managing large amounts of data, often from various sources, which can be unstructured or difficult to interpret.
Cross-departmental: These processes often span multiple departments or teams, requiring coordination and communication across the organization.
Regulatory compliance: They might need to adhere to specific regulations or standards, adding an extra layer of complexity.
Benefits of using infographics to map out and simplify business processes
Infographics are powerful tools for transforming complex business processes into easily understandable visuals. By simplifying intricate steps, they enhance understanding, improve communication and identify bottlenecks.
Here’s how they can benefit your team:
Enhanced clarity and understanding
Infographics are game-changers when it comes to making complex business processes clear and easy to understand.
Let’s look at this Mechanical Recycling process infographic for example:

Now what if I were to give you the same information but in text form like this:

See the difference? By transforming data and information into visual stories, infographics break down information silos, promoting better collaboration and improved communication.
Breaking down information silos
Traditionally, departments often work in isolation, with limited visibility into other areas of the business. Infographics can bridge this gap by visually illustrating how information flows across different teams.
Here’s how different types of infographics can simplify business processes for various teams within your company:
Statistical infographics
These infographics use charts, graphs and other visuals to make numbers and data easier to understand. They’re great for showing trends, making comparisons and highlighting relationships in data.
Statistical infographics also work well for market analysis, helping your team quickly grasp key insights from complex data. Check out how it’s done in this infographic on “The World of Sales Tech” by Raconteur

For professionals in the academic industry, statistical infographics can help streamline the reporting process by visually condensing data that can help lecturers and department heads swiftly evaluate performance and make informed decisions based on actionable insights.
Take this LMS statistical infographic template for example:

Process infographics
Process infographics break down complicated workflows into simple, easy-to-follow steps. They’re perfect for guiding new employees through onboarding, troubleshooting common issues or outlining standard operating procedures.
It’s also a valuable tool for customer success teams, enabling them to guide customers through the troubleshooting process more effectively, just like this infographic by Stadia:

By visually outlining each step, like how it’s done in this process infographic for HTML email export to MailChimp, these infographics clarify complex processes and ensure consistent understanding, thereby enhancing training and operational efficiency.

Informational infographics
When you need to share facts, concepts or comparisons, informational infographics really shine.
This full-page interactive infographic is a perfect example of how you can keep things simple while still creating impactful movement. Email Uplers designed this infographic to showcase best practices for a website’s landing page. They’ve done a great job by combining illustrations, text, and subtle movement to craft a clean and effective infographic.

For instance, this time management training infographic template can be a game-changer for the leadership team. It lays out key tips and techniques in a clear, step-by-step way, serving as a handy visual reference that helps everyone get on the same page.

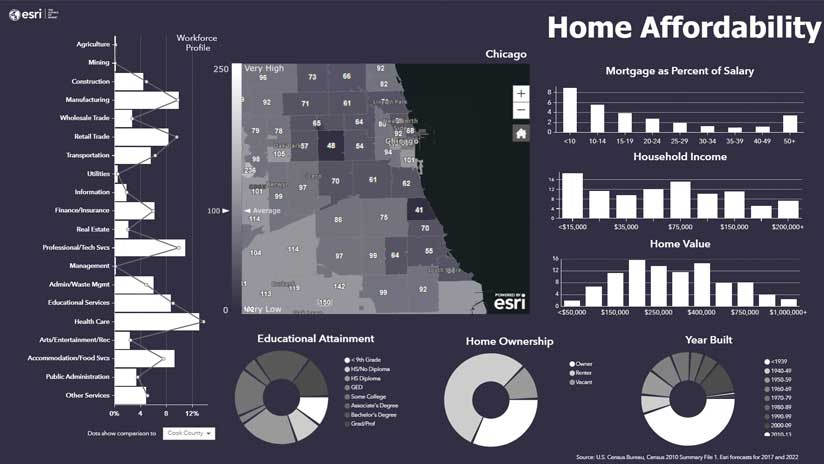
Geographic infographics
Geographic infographics use maps and location-based data to show information tied to specific regions. They’re ideal for things like market penetration analysis or gaining a better understanding of your audiences like in this example by Esri:
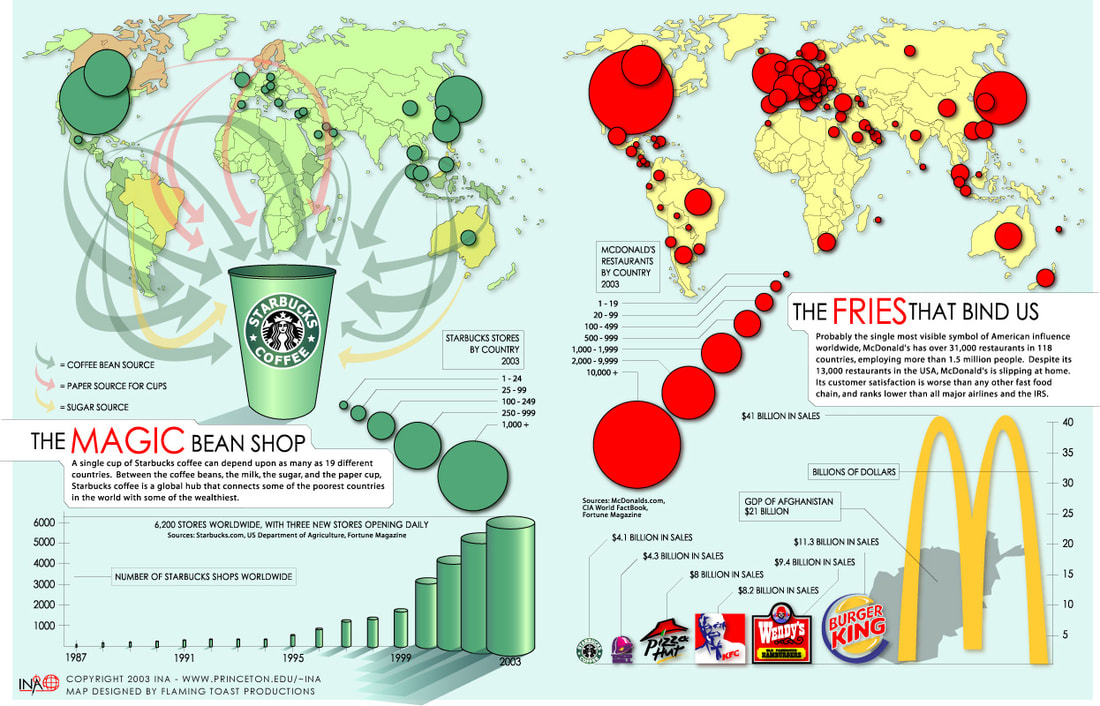
These infographics are also great for spotlighting demographic trends, helping to steer more targeted marketing strategies. For instance, this infographic analyzes the top chain restaurants globally, providing valuable insights.
Want to learn more about infographics? These are the 9 popular types of infographics you can use for streamlining your business processes.
Improved communication
Effective communication is the backbone of any successful organization, yet it often presents one of the biggest challenges, especially in large or complex teams.
To address this, electronics manufacturer Allsee Technologies created an infographic to share their corporate social responsibility (CSR) strategy with employees, ensuring everyone stays informed about their CSR progress and future plans.

By using this visual approach, teams can easily grasp key information without getting bogged down in lengthy emails or explanations.
Businesses that have adopted visual communication tools like infographics have seen significant improvements in how their teams communicate.
Tommy Le, Founder of Poshwatch and a seasoned software engineer with over 15 years of experience, emphasizes the importance of cross-departmental meetings for keeping everyone updated on performance, roadblocks and overall progress. These meetings bring together teams from different departments to ensure everyone is on the same page, enabling early identification and resolution of issues.
In these sessions, visual aids like charts, graphs and diagrams are quite beneficial. Graphs, for instance, may instantly display sales patterns, which helps us identify areas for improvement and areas where we’re successful. Rather than having to go through long reports, these images give a concise overview of crucial information so that everyone can easily understand the main points. This guarantees that complicated material is comprehended while also improving communication and saving time.
Tommy Le, Founder @ Poshwatch
Sergey Taver, Marketing Manager at Precision Watches, shared his insights on how complex processes can create bottlenecks that hinder growth. He emphasized the value of using infographics, charts and graphs to simplify complex data for both management and team members.
Our management and team members can easily understand complex data using infographics, charts and graphs. For instance, our marketing department uses intricate charts to analyze the effectiveness of campaigns. These charts emphasize important data like ROI, engagement and conversion rates. In addition to improving data accessibility, these graphics support trend identification and well-informed decision-making.
In my experience, using visual aids in presentations helps the content be easier to understand and apply. A Wharton School of Business study found that when information is presented graphically, people are 64% more likely to retain it. This data is consistent with my observations, which show that visual aids have greatly enhanced internal communication and decision-making in our company.
Sergey Taver, Marketing Manager @ Precision Watches
Increased efficiency and productivity
Infographics take complex information and turn it into easy-to-digest visuals, making it simpler for everyone on the team to understand and act quickly.
Imagine using this infographic to explain your app development design process:

Would you rather sift through a 10-page manual? I think the choice is clear.
By cutting through the noise, infographics help you communicate more clearly and avoid the usual mix-ups, so everyone stays aligned by:
Streamlining workflow
By breaking down complex tasks into clear, visual steps, provide a clear roadmap for everyone involved.
Take, for example, a recruiting team that was facing delays in their hiring process. They decided to use process infographics to map out their entire recruitment workflow—from sourcing candidates to final onboarding.

This visual approach can help them identify areas where steps could be streamlined, such as reducing the time spent on initial screenings or improving communication between HR and hiring managers. The result? A faster, more efficient recruitment process that brought in top talent quicker, all without needing additional resources.
Joy Bian, Sales Manager at RELYIR, shared how their business relies heavily on supply chain management, product development and marketing—areas that involve complex sequences of operations that can be challenging to turn into actionable steps. Their solution? Visuals, particularly flowcharts and infographics.
In supply chain management, we use flowcharts to illustrate the procurement-to-distribution-and-logistics flow. This helps us track the movement of our products from factories in China to destinations worldwide. During product development, we adopt diagrams for design phases, which makes it easier to conceptualize the product’s creation from start to finish.
We utilize infographics to encapsulate campaign performance data which are subsequently shared with the team. They are quite effective for demonstrating trends, comparing strategies and visualizing success metrics. In fact, they often communicate data more succinctly and engagingly than many automated tools, making them a vital resource in our organization.
Joy Bian, Sales Manager @ RELYIR
In another instance, Zoom Video Communications Inc. effectively uses an infographic to illustrate how video can boost sales. This visual guide can be a powerful tool for training new sales team members.

Identifying bottlenecks and redundancies
When you visualize processes, it also becomes easier to spot inefficiencies and bottlenecks. This helps teams fix issues early, streamline workflows and cut out steps that slow things down.
Take this infographic on “Ways to Speed Up a House Sale” for example, it identifies bottlenecks and redundancies by visually breaking down each step of the process. The infographic outlines the key stages—from evaluating the condition of the house to decluttering and professional staging—along with tips for each stage.

With this visual guide, real estate agents and sellers can pinpoint exactly where the process can be streamlined and make adjustments to speed up the sale. This leads to a more efficient selling process and quicker closings.
Better decision making
Because infographics highlight the most relevant data, they help focus discussions on what truly matters, leading to more informed and effective decisions with:
Data-driven insights
Infographics make it easier to understand complex data by turning it into clear, visual formats like charts and graphs. This helps teams quickly see trends and key insights without getting lost in spreadsheets.
For example, an infographic on “The Ins-and-Outs of the 2023 Commercial Real Estate Market” visually maps out key market trends obstacles and challenges, making it easier to spot opportunities for growth and improvement within the industry.

This approach simplifies the complexities of the market, enabling stakeholders to quickly identify areas that need streamlining. Ultimately, this leads to greater efficiency and faster decision-making in the commercial real estate sector.
Visuals have played a crucial role in the daily operations of DesignRush, as explained by their General Manager, Gianluca Ferruggia. “They bridge the gap between complex data and comprehensible information, encapsulating holistic narratives that often surpass the capabilities of standard automation tools.”
Infographics have been pivotal. They condense complicated SEO and campaign data into easily digestible formats, enabling faster decision-making processes. Comparatively, visualization tools have shown to be more intuitive and engaging than text-based automated reports when communicating such data.
Gianluca Ferruggia, General Manager @ DesignRush
Enhanced strategic planning
Infographics also help with strategic planning by giving a clear picture of business processes. When complex business processes are visualized, it becomes easier to identify potential challenges, allocate resources effectively and set realistic goals.
Infographics offer a clear, comprehensive view of workflows, helping teams identify inefficiencies and plan for future growth.
For instance, an infographic on strategic sourcing can compare traditional methods, three-bid approaches and strategic sourcing strategies, enabling sourcing departments to pinpoint the most effective approach. This comparison helps ensure the best value while optimizing procurement time and resources.

Streamlining processes aside, infographics can also transform data into compelling stories that drive better decision-making. Want to learn more about data storytelling? Check out this helpful guide on creating business infographics that drive decisions.
Integrating infographics into your business processes
Infographics offer a powerful way to enhance various aspects of your business. By transforming complex information into visual formats, they can improve communication, training and overall efficiency.
Here are some ways of how you can integrate infographics into your business processes:
Infographics for employee training and onboarding
Let’s be honest—no one enjoys slogging through lengthy manuals. Infographics can take the pain out of training by breaking down complex procedures into visually appealing, easy-to-digest formats.
Whether you’re onboarding new hires or teaching a new software tool, infographics can simplify the process, cut down training time and help employees retain information better. Take a look at this onboarding roadmap by Penn State University.

For HR professionals, infographics can be used to map out the entire onboarding process for new hires, from the initial contact to the interview and their first day on the job. Check out this onboarding infographic by Nike that visually breaks down each step, ensuring a smooth and consistent experience for both the new employee and the HR team.

Recruitment can be a complex process, with multiple stages from job posting to final interviews. Infographics offer a clear, visual roadmap of this journey, outlining each stage, what it involves and the timelines. This approach not only makes the process more transparent but also helps manage expectations and reduces misunderstandings.
As Oleg Segal, CEO & Founder of DealA, puts it:
While automation tools excel at processing tasks, visual tools outshine in promoting nuanced understanding and fostering collaboration. This belief is also reflected in our HR processes where we use diagrams for recruitment stages and onboarding, effectively improving transparency and engagement. What we’ve found is that the right blend of automation tools and visual innovations allows for a smoother, more efficient workplace.
Oleg Segal, CEO & Founder @ DealA
Infographics for marketing and sales
Grabbing attention is just half the battle when it comes to marketing and sales which makes infographics the perfect tool for showcasing product features, benefits and comparisons in a way that’s both eye-catching and memorable.
Consider this infographic by Semgeeks comparing different sales funnels. It provides a clear visual representation of various sales approaches. By understanding these funnels, the sales team can effectively identify the best strategy for each customer segment which can significantly improve lead conversion rates.

As a social media marketer, you’re likely familiar with using visuals and infographics to engage your audience. But did you know infographics can also be powerful tools for your internal team? For instance, “The Anatomy of Content Marketing” by SocialMediaToday effectively visualizes content insights, helping teams better understand their work.

In our Marketing domain, we utilize data-rich infographics to break down campaign performance metrics. Visual representations of these metrics – be it via line graphs or pie charts – make it easy for the team to absorb the information and guide their future strategies, thereby outperforming plain statistical reports generated by automation tools.
Greta Maiocchi, Head of Marketing & Admissions @ OPIT
Infographics for internal communication
Keeping everyone in the loop is key to a smooth-running business. Infographics can make internal communication more engaging and keep employees informed to make sure everyone’s on the same page — no more getting lost in walls of text.
That said, infographics are not just for sharing goals and updates; they can also be powerful communication tools.
For example, an infographic like “The Communication Code of Conduct” by Business Insider can guide employees on when to use different communication channels, fostering better workplace collaboration.

Understanding the organizational impact of infographics, we reached out to Chris Yang, Co-Founder of Coins Value, to learn how the company uses visuals to enhance internal communication.
Our internal communications revolve around Gantt charts for our content creation pipeline. Gantt charts provide a visible timeline for any project’s progress, due dates and potential bottlenecks. While project management software does both, it concentrates on functionality. Due to the visual nature of Gantt charts, one can quickly discern scheduling conflicts and resource allocation issues.
Chris Yang, Co-Founder @ Coins Value
Infographics for project management
Managing projects can be a juggling act, but infographics can help keep everything in balance. For example, this infographic by Audiense breaks down its audience segmentation process, clearly illustrating each step. While it might include a bit more text, it effectively guides you through the process.

By laying out the details in a visual format, you help your team stay aligned, make informed decisions and keep projects moving smoothly. It’s all about making the complex simple and the chaotic manageable.
Project management infographics can track progress, visualize schedules and organize team members — sometimes all within a single infographic, as shown in the example below.

Want to supercharge your project planning? Learn how to streamline your projects with our top 18 project management infographics.
Don’t just take my word for it—here’s what Jonathan Feniak, General Counsel of LLC Attorney, has to say about using visual tools for project management.
Visual tools? Absolutely. We rely on Gantt charts to lay out project timelines and milestones. They’re not just nice to look at—they actually help us spot issues before they become big problems. Plus, it’s easier for everyone to see where we are and what needs attention, which means fewer surprises and more informed decisions.
Jonathan Feniak, General Counsel @ LLC Attorney
Actionable steps for creating process-oriented infographics
If you haven’t read our guide on how to make an infographic in 5 easy steps, that’s where you should be starting.
But essentially, creating an effective process-oriented infographic involves careful planning, thoughtful design and ongoing refinement. Here’s a step-by-step guide to help you craft an infographic that simplifies complex business processes and enhances team productivity.
Step 1: Identify the process to be mapped
Before you dive into creating an infographic, it’s important to identify and clearly define the process you want to map out. It might sound simple, but clearly defining your process is the key to creating infographics that leave an impression.
Here’s what you need to do:
Define objectives
Start by setting clear objectives for the infographic.
What are you trying to achieve by visualizing this process? Whether your goal is to reduce time spent on a task, improve clarity across teams or streamline a workflow, having well-defined objectives will guide the entire creation process.
Here’s a simple checklist to help you clarify your goals:
- Identify the problem: What specific issue are you trying to address with this infographic?
- Target audience: Who will be using or benefiting from this infographic?
- Desired outcome: What changes or improvements do you want to see after implementing the infographic?
- Success metrics: How will you measure the success of this infographic? Consider metrics like reduced processing time, fewer errors or increased understanding.
Gather information
With your objectives in place, the next step is to gather all the necessary information to accurately map out your process.
This involves collecting data and consulting with key stakeholders who have a deep understanding of the process. Here’s how to approach this phase:
Data sources:
- Existing process documentation: Review any existing documentation or flowcharts related to the process.
- Performance metrics: Look at current performance data to identify areas for improvement.
- Feedback reports: Gather feedback from teams currently involved in the process to uncover pain points.
Stakeholder involvement:
- Process owners: Engage with those who are directly responsible for the process.
- Team members: Involve the people who are hands-on in the process for practical insights.
- Department heads: Consult with leaders who can provide a broader perspective on how the process impacts overall operations.
Tips for effective data collection:
- Conduct interviews: Schedule interviews with stakeholders to gather insights on how you can improve the processes.
- Use surveys: Distribute surveys to collect a wide range of input from various team members.
- Review historical data: Analyze past performance data to identify trends and recurring issues.
Step 2: Analyze and break down the process
So you’ve identified the process and gathered the necessary information — the next step is to analyze and break down the process into manageable components. This involves mapping out the process and pinpointing the key steps and decision points that will be crucial to your infographic’s success.
To get you started, here are some process mapping techniques that can help you visualize and improve your business processes.
Process mapping techniques
There are lots of different ways to map out a process, each with its own pros and cons. The best one for you depends on how complex your process is and what you want to achieve. Let’s find the perfect fit for your project:
Flowcharts
Flowcharts are one of the most popular and straightforward techniques for process mapping. They use standard symbols like rectangles for tasks, diamonds for decisions and arrows to indicate the flow of the process. Flowcharts are ideal for visualizing linear processes or workflows that involve decision points.
Check out this Sales Cycle Flowchart Diagram Template to get started with your own flowchart design:

Pros of using flowcharts:
- Improved communication: They help everyone quickly grasp how a process works, which is especially useful for cross-team communication.
- Spotting issues: Flowcharts can reveal bottlenecks or inefficiencies in a process, making it easier to improve.
- Supports decision-making: Flowcharts highlight decision points, helping teams make better-informed choices.
Cons of using flowcharts:
- Complex processes can get messy: For very detailed processes, flowcharts can become cluttered and hard to read.
- Not ideal for parallel processes: Flowcharts may struggle to effectively show processes that happen simultaneously.
- Needs regular updates: If the process changes often, the flowchart can quickly become outdated and less useful.
Swimlane diagrams
Swimlane diagrams take flowcharts a step further by organizing activities into different lanes, typically representing different departments, teams or individuals involved in the process. This process mapping technique is particularly useful for highlighting cross-functional processes and ensuring that everyone understands their role.
Like this internal sales process swimlane diagram for instance:

Pros of using swimlane diagrams:
- Improve cross-team communication: By visually dividing tasks among teams or departments, swimlane diagrams help clarify how different parts of the organization work together.
- Effective for Parallel Processes: Swimlane diagrams can effectively display processes that occur simultaneously across different teams or departments.
- Facilitates identification of inefficiencies: By mapping out the entire process, swimlane diagrams make it easier to spot bottlenecks, redundancies or inefficiencies.
Cons of using swimlane diagrams:
- Time-consuming to create: Designing a detailed swimlane diagram can take time, especially for processes with many steps or involving multiple teams.
- Risk of overcomplication: While trying to include all details, the diagram may become overly complicated, making it harder to understand.
- Limited flexibility: They may not be as flexible for illustrating processes that don’t fit neatly into linear or role-based categories.
SIPOC diagrams
SIPOC (Suppliers, Inputs, Process, Outputs and Customers) diagrams provide a high-level overview of the process, focusing on the critical elements involved. This process mapping technique is great for understanding the broader context of a process, especially in manufacturing or service industries.
Not sure what a SIPOC diagram looks like? Here’s an example:

Pros of using SIPOC diagrams:
- High-level process overview: SIPOC diagrams provide a clear, high-level view of a process, showing the essential elements: Suppliers, Inputs, Process, Outputs and Customers.
- Effective communication tool: SIPOC diagrams are simple and concise, making them excellent for communicating process basics to stakeholders, including those who may not be familiar with the process.
- Facilitates alignment: SIPOC diagrams ensure that everyone involved in the process has a shared understanding of its key components, helping align efforts across teams.
Cons of using SIPOC diagrams:
- Limited detail: SIPOC diagrams offer a high-level overview but lack the detail needed for in-depth process analysis or troubleshooting.
- May miss interactions: While SIPOC diagrams focus on linear process flow, they may not capture interactions or dependencies between different processes or departments.
- Initial setup can be time-consuming: Creating a SIPOC diagram requires a thorough understanding of the process, which can take time to develop, especially if the process involves multiple stakeholders.
Identify key steps and decision points
After selecting a mapping technique, the next task is to identify the critical steps and decision points within the process.
These are the points in the process where something important happens. It could be a decision that changes the direction of the process or a key action that moves it forward.

Identifying key steps:
- Start by breaking down the process: Divide the process into its fundamental tasks and activities. Each task represents a step in your process map.
- Determine the sequence: Arrange the steps in their logical order, ensuring that the flow accurately reflects how the process works in real life.
- Look for major milestones: Identify any significant events or outcomes within the process that should be highlighted in the infographic.
Identifying decision points:
- Spot decision moments: Look for points in the process where a decision must be made, such as “Yes/No” or “Go/No-Go” scenarios.
- Evaluate impact: Consider the consequences of each decision point. Decisions that greatly affect the direction or outcome of the process should be prominently featured in your infographic.
- Use visual cues: Use symbols or colors in your infographic to distinguish decision points from regular process steps, making them stand out to viewers.
Step 3: Design the infographic
Now that you’ve analyzed and broken down the process, it’s time to design your infographic. Let’s start off with choosing the right type of infographic that will effectively streamline your business processes.
Choose the right type of infographic
Selecting the right type of infographic is crucial for effectively visualizing your process. Different types of infographics serve different purposes, so it’s important to match the complexity of your process with the appropriate format.
To help you plan your infographic design, take a look at this infographic on How to Think Visually Using Visual Analogies.

Some common infographics that can effectively visualize your process include:
- Flowcharts: Ideal for simple, linear processes where each step follows the previous one. Flowcharts are great for illustrating step-by-step procedures or workflows.
- Process infographics: These are more detailed than flowcharts and can include multiple stages, branches and decision points. They are perfect for mapping out complex processes that require a deeper understanding.
- Comparison infographics: Use comparison infographics when you need to compare different processes or options. They can help stakeholders quickly see the pros and cons of each approach.
- Timeline infographics: If your process involves a sequence of events over time, a timeline infographic can effectively highlight key milestones and deadlines.
Choosing the right infographic:
Picking the perfect infographic is like choosing the right outfit – you want to make a great first impression. Here are some key factors to consider when deciding which type to use:
How complicated is your process?
If your topic is straightforward, like this infographic on the buyer’s journey and content types for each stage, a flowchart might work.

But if it’s really complex, you might need a more detailed infographic or a combination of different charts, like this one on how to make a short film.

Who are you trying to reach?
If they’re new to the process, keep it simple and make sure they understand the basics. For example, if you’re showing a new team member of the marketing team around. Make sure they understand the buyer’s journey with this infographic:

But if they already know a lot, you can use a more complex design and go deeper into customer journey layers like this:

Lastly, what do you want to show?
If you’re comparing things like what is the best payment solution for your website, for example, a comparison infographic might be best.

But If you’re showing steps, a flowchart like this might be better:

Designing infographics that streamline complex business processes:
Creating an infographic that effectively simplifies a business process requires a strong foundation in visual design. But even if you’re not a design pro, you can create a great infographic. Here are some tips to help you get started:
Color theory
- Clarity and contrast: Ensure text and visuals are easily distinguishable.
- Consistency: Maintain a cohesive color palette throughout the infographic.
- Meaningful colors: Use color to categorize information or highlight key points.
- Accessibility: Consider color blindness when choosing color combinations.
To give you a better picture, take a look at this example:

When too many clashing colors are used, the design can end up looking messy and overwhelming.
It’s easy for the viewer to get distracted and struggle to focus on the key information. A cleaner, more cohesive color scheme helps make the content clearer and more engaging. Like this:

Notice the difference? Using a consistent color palette not only makes your infographic look polished but also helps in organizing information.
For instance, you might use different colors to highlight various stages of a process to make it easier for your audience to follow along like this:

Typography
Then there’s typography — sometimes the right color scheme but the wrong font can make the biggest difference.
Look at this infographic. The use of too many different fonts and inconsistent sizes makes it tough to read.

On the other hand, this infographic by Emirates, which also uses red as the main color scheme, effectively employs larger fonts to establish a clear visual hierarchy. This approach guides the viewer’s eye through the content, making it easier to understand the key points.

It’s also a good idea to use consistent font sizes and styles, with bolder or larger fonts reserved for headings and important details to naturally guide the reader’s eye. Here’s a great example of how it should be done:

Choosing the right font can make a big difference in your infographic. Here are some popular options:
- Classic and versatile: Helvetica, Roboto, Open Sans
- Modern and sleek: Montserrat, Avenir, Proxima Nova
- Bold and attention-grabbing: Bebas Neue
- Traditional and elegant: Garamond
Layout and composition
Finally, the layout of your infographic is just as important as the content. Think of it like a well-organized room: everything has its place. A good layout makes your infographic easy to follow and visually appealing.
When planning the layout of your infographic, keep in mind to:
Give things space and don’t cram everything together. Without proper spacing and visual hierarchy, your design can end up looking cluttered and chaotic, just like this:

Source: Daily Infographic
A little breathing room makes your infographic easier on the eyes. Here’s an example of a well-crafted process infographic that balances text and visual elements perfectly. It uses arrows and icons to effectively convey the message and make it more memorable.

Align your elements and keep things lined up neatly — it creates a sense of order and makes your infographic look professional. Just look at this example:

Source: Men Are More Likely to Back Up Their Files Than Women [STUDY]
The infographic used different elements to complement the text, keeping the wording minimal so the message stays clear and easy to grasp.
Group related information together. This helps your audience understand how different parts of your process connect.
For inspiration, take a look at these examples of infographics with excellent layouts.


Sabrina Lim’s “Phone Addiction” infographic grabs attention right from the start with the bold headline “Junkies,” suggesting that this issue isn’t given the seriousness it deserves.
As you scroll through the graphic, moving down through a building-like structure, the gravity of the situation becomes clear. Percentages dominate each section, driving home the statistics in a powerful way.
The faceless icons add to the overall sense of dehumanization, creating a design that’s both focused and impactful.

Tools and software
Well, the good news is — even if you’re no design pro — there are plenty of tools out there that can help you create stunning infographics. Here are a few popular options to get you started:
- Venngage: With its drag-and-drop interface and extensive template library, Venngage is a great choice for beginners. It offers a wide range of customization options, making it easy to create unique and informative infographics.
- Canva: Canva’s intuitive design tools and vast collection of elements make it a popular choice for both beginners and experienced designers. You can easily create professional-looking infographics by customizing pre-designed templates or starting from scratch.
- Adobe Illustrator: For those with more advanced design skills, Adobe Illustrator provides unparalleled control over every aspect of your infographic. It’s ideal for creating highly customized and intricate designs.
Step 4: Implement and test the infographic
Once your infographic is designed, the next step is to make sure it fits smoothly into your existing business processes and actually works as intended.
Integrating with your workflow
To start, figure out where your infographic will be most helpful. Once you know that, a quick training session might be a good idea to make sure that your teams are aware of the new tool and understand how it fits into their daily routines.
Finally, make it easily accessible. Share your infographic on your company’s network or other shared platforms so that it’s readily available to everyone who needs it.
Testing and gathering feedback
Testing is crucial to ensure your infographic hits the mark. Start by trying it out with a small group to see how it works in real-world situations. You can even compare different versions using A/B testing to find the most effective design.
Don’t forget to get your team’s input — their feedback can provide valuable insights into what works and what doesn’t. This information can help refine your design and ensure the infographic meets your team’s needs.
Step 5: Iterate and improve
Continuous improvement
Creating an effective infographic isn’t a one-time task. Things change and so should your infographic — keep your infographic up-to-date by regularly reviewing and refining it.
Pay attention to feedback from your team and be open to making adjustments. Maybe the workflow has changed, or perhaps there’s a better way to visualize a certain process. Staying flexible and willing to improve your infographic keeps it aligned with your goals and enhances its impact over time.
Documenting changes
Keeping your infographic up-to-date is important. Make sure to track changes and why you made them. This way, you always know what’s new and everyone’s on the same page.
Consider saving different versions so you can look back if needed. By staying organized, you’ll keep your infographic a helpful tool as your business grows.
Venngage: Your go-to tool for designing infographics that enhance business efficiency
Want to boost how your team communicates and simplifies complex business processes? Venngage is your go-to tool! It’s a straightforward yet powerful platform that turns complex data into clear, easy-to-understand infographics.
Even if you’re not a design pro, Venngage makes it simple to create visuals that streamline your processes and enhance understanding. Here’s why Venngage should be your top choice for simplifying your business workflows with infographics.
1. Easy-to-use design editor tool
Venngage’s drag-and-drop interface is super user-friendly, so you don’t need to be a design expert to create stunning infographics. With a range of ready-made templates, you can quickly get started and customize your visuals without hassle.

2. Tailored templates
Whether you’re mapping out a workflow, showcasing performance metrics or comparing strategies, Venngage’s customizable infographic templates have you covered. Pick a template that fits your needs and adapt it to make sure your infographic is spot-on for your specific process.

3. Simple data integration
Importing data into your infographics is a snap with Venngage. You can pull in charts, graphs and tables directly from Excel or other sources, making it easy to present accurate, data-driven information in a clear, engaging way.

4. Engaging visuals
With a wealth of design elements like icons, illustrations and data visualization tools, Venngage helps you turn complex data into compelling stories. Your audience will grasp intricate details quickly and easily with visuals that make the information stick.

5. Team collaboration
Does your business process involve multiple teams? Venngage’s collaboration features let you and your team members work together seamlessly. Share ideas, provide feedback and refine your infographic to ensure it effectively addresses the process you’re focusing on.

6. Easy sharing
Once you’re done, Venngage makes it easy to share your infographic. Download it in different formats, email it or embed it in presentations and reports. Your streamlined process will be accessible to everyone who needs it.

Transform your business processes with infographics
Using infographics to simplify complex processes offers clear, tangible benefits. They make data more accessible, enhance communication across teams and streamline workflows.
By breaking down complicated procedures into visual elements, infographics help improve efficiency, support better decision-making, and ultimately drive productivity.
If you’re looking to enhance your business processes, now is the time to start integrating infographics into your workflows. Begin with small steps — map out a key process or present critical data visually — and see the difference it can make.
And don’t worry if you’re not a design expert. With tools like Venngage, anyone can create impactful infographics that simplify business processes for your team.


