
Geographic Statistics Infographic Template
We have created this template to help other designers create beautiful geographic infographics. Create one today.

 100% customizable templates
 Millions of photos, icons, charts and graphics
 AI-powered editing features
 Effortlessly share, download, embed and publish
 Easily generate QR codes for your designs
- Design stylemodern
- Colorsvibrant
- SizeLetter (11 x 8.5 in)
- File typePNG, PDF, PowerPoint
- Planbusiness
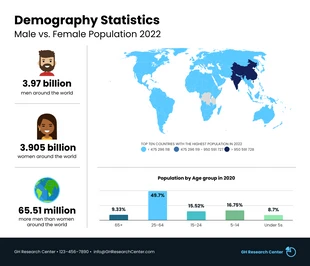
A geographic infographic is a visual representation of an area, such as a city or county. It can include information about the size, location, and demographic makeup of the area, as well as any other relevant details. They provide an easy way for users to understand patterns and trends in their area or region. Geographic infographics are also helpful in showing how different regions compare with one another. This can help users find new places to visit or businesses to explore, as well as learn more about the local community they live in. Geographic infographics are beneficial because they allow users to quickly grasp complex information without reading long blocks of text or listening to lengthy explanations. This makes them useful for all kinds of audiences: businesses can use them to learn more about their customers' needs; policymakers can use them in designing new policies; educators can use them in teaching students about geography; tourists can use them when planning trips; students can use them when studying for tests; and so on. Looking for an infographic on geographic data? We've got you
Related Infographic Templates
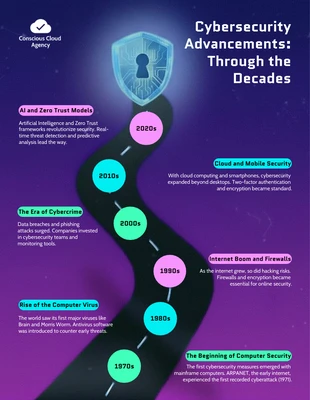
timeline infographics

mental health infographics
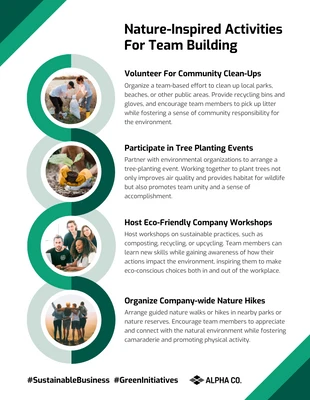
environment infographics

process infographics
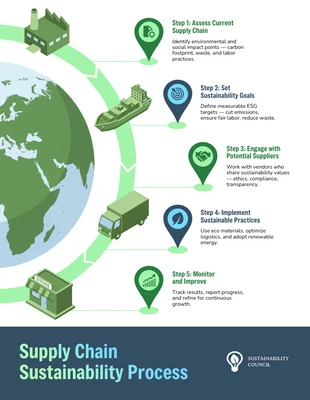
process infographics
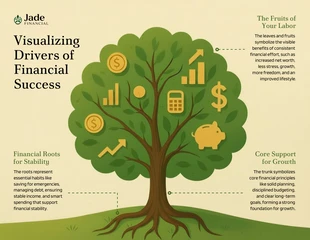
tree infographics

informational infographics
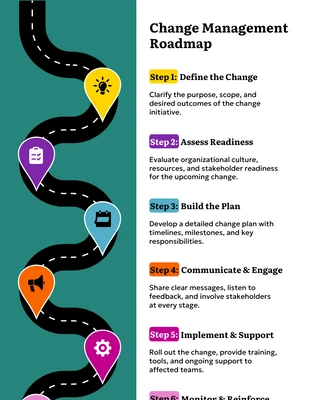
process infographics
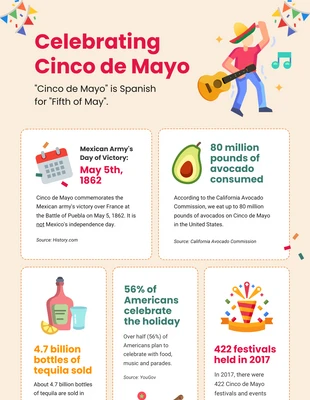
cinco de mayo infographics
geographic infographics
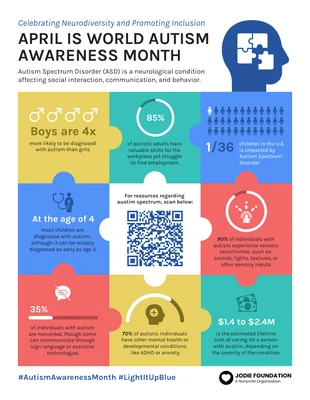
informational infographics
environment infographics