


Creating a business plan can seem daunting at first but it’s much easier than you think. Your challenge really begins when you want to create a business plan that stands out. Instead of sending over a 50-page document that bores your audience and hardly gets any point across, why not use a business plan infographic?
Using infographics for writing a business plan allows you to visually illustrate your research, pitch, and business structure in an engaging and creative way. Business plan infographics can be used internally or externally with investors or partners who want a quick overview of what your business has to offer.
In this article, you’re going to learn everything you need to create a business plan infographic that will wow your readers and showcase your business at its best.
Not a designer? No problem. Use our professional, fully customizable templates and infographic software to create an engaging infographic today.
Want to learn more about other types of infographics? Read our blog on the 9 main types of infographics or watch the video below:
Click to jump ahead:
- What is a business plan infographic?
- Why use business plan infographics?
- Create a goal for your business plan infographic
- The best types of business plan infographics
- What’s included in a business plan infographic?
- How to create a traditional business plan infographic
- How to create a lean startup business plan infographic
- Business plan infographic examples
- Key design elements of a business plan infographic
- How to get the most out of your business plan infographic
- Business plan infographic FAQ
What is a business plan infographic?
An infographic is a collection of imagery, charts, and minimal text that gives an easy-to-understand overview of a topic.
Being a type of business infographics, the business plan infographic is a collection of text, images, charts and other data visualizations to give an overview of your business plan.
As it’s in the form of an infographic, business plan infographics are normally 1-page documents with visualized data, making them both engaging and easier to skim and scan.
These 1-page business plan infographics can be a reflection of your sales plan, marketing plan, business expansion plan or business stats that you’d like to share with your investors or employees.
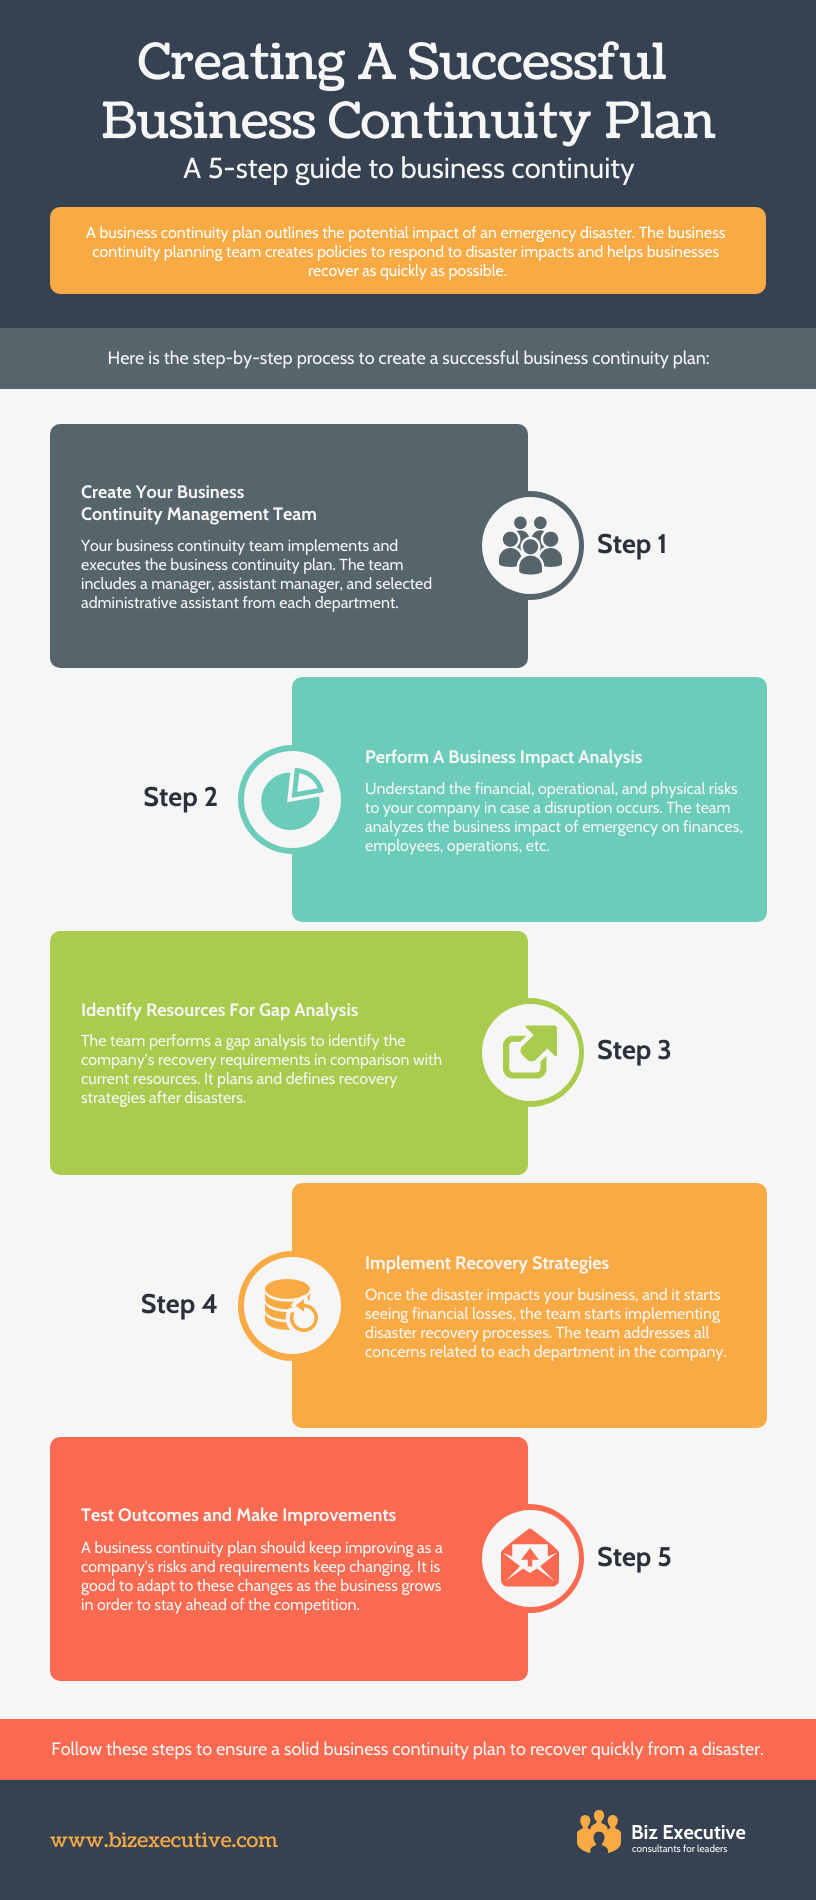
Here is an example of a business plan infographic template that presents a 5-step guide to business continuity:
Why use business plan infographics?
Infographics easily allow you to present detailed information in an easy-to-read or simple format so that the viewer can quickly understand and process the information faster than if you had handed them a full-page report.
We live in a fast-paced world where not everyone wants to download a report, view a business plan, or read an entire blog post to get the information they need. Infographics make the whole process a lot easier.
As most humans are visual learners, your business plan infographics will highlight only the essential and important information while being entertaining and eye-catching so readers stay focused.
Using an infographic for a business plan also makes it easier for stakeholders to understand your ideas and increases the chance of a successful business pitch.
Business plan infographics are also a great way for you to educate investors, employees, or partners about the structure, purpose, and future of your business. It should accomplish three main goals:
- Clarify your project and steps towards growth
- Showcase an exceptional understanding of your financial needs
- Educate investors, bankers, and lenders
Create a goal for your business plan infographic
Your business plan infographic should have a specific purpose or, rather, a specific topic to avoid confusing readers. For example, does your business plan infographic focus on a specific aspect or educate the reader on your position in a niche market?
It’s crucial to keep your business plan infographic’s objective to a singular focus.
For example, if you’d like to educate people about how your business helps to optimize email management tools, your business plan infographic should highlight research backing this statement. Stick to the objective and try not to divert to the history of email marketing or how to use emails for your website.
You should also use relevant data for your business plan infographic based on the topic it addresses.
Data storytelling is the best way to use data to create new knowledge, decisions or actions without overloading your infographic with unnecessary information.
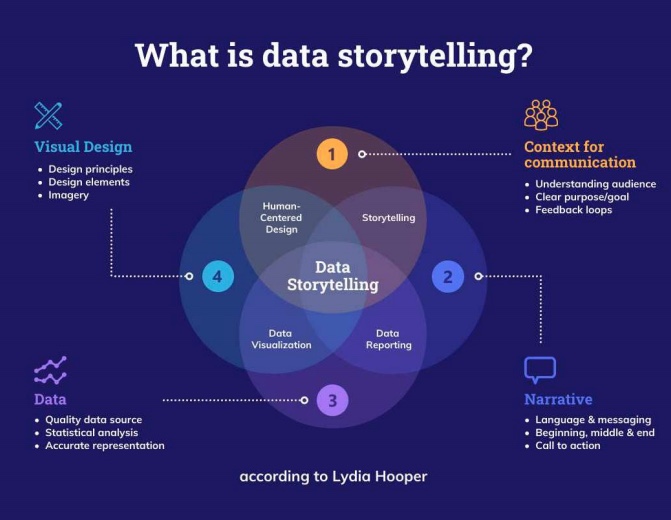
Only focus on the data that matters the most to your readers or industry. But use it in an interesting and educational way that allows the reader to get sucked into your business infographic.
The aim is to cut down the fluff so that readers can consume as much essential information as possible without being bogged down by unwanted data.
The best types of business plan infographics
There are two types of business plans you can consider using to model your business plan infographic. You can create a traditional or a lean startup business plan infographic. Bplans states the difference between the two mainly has to do with the data that’s presented, as:
A lean startup business plan infographic
This type of plan has a high-level focus, fast to write, and contains key elements only. Some lenders and investors may ask for more information. It’s best to use when presenting a high-level overview with only key information. Most one-page business plan infographics are in this format.
A traditional business plan infographic
This type of plan is very detailed, takes more time to write and is comprehensive. Lenders and investors commonly request this plan. It’s normally in the form of a presentation or a business proposal and includes several business plan infographics altogether.
What’s included in a business plan infographic?
What you want to include in your business plan infographic might differ depending on the type of business plans you want to create, and we’ll go into more detail on this later. However, there are some common sections that you should consider when gathering information for your business plan infographic. Those include:
- Company profile
- Management
- Finances
- Products & services
- Business model
- Risk management
You want to either include only key information on each of these sections or really elaborate on them depending on the type of business plan infographic you want.
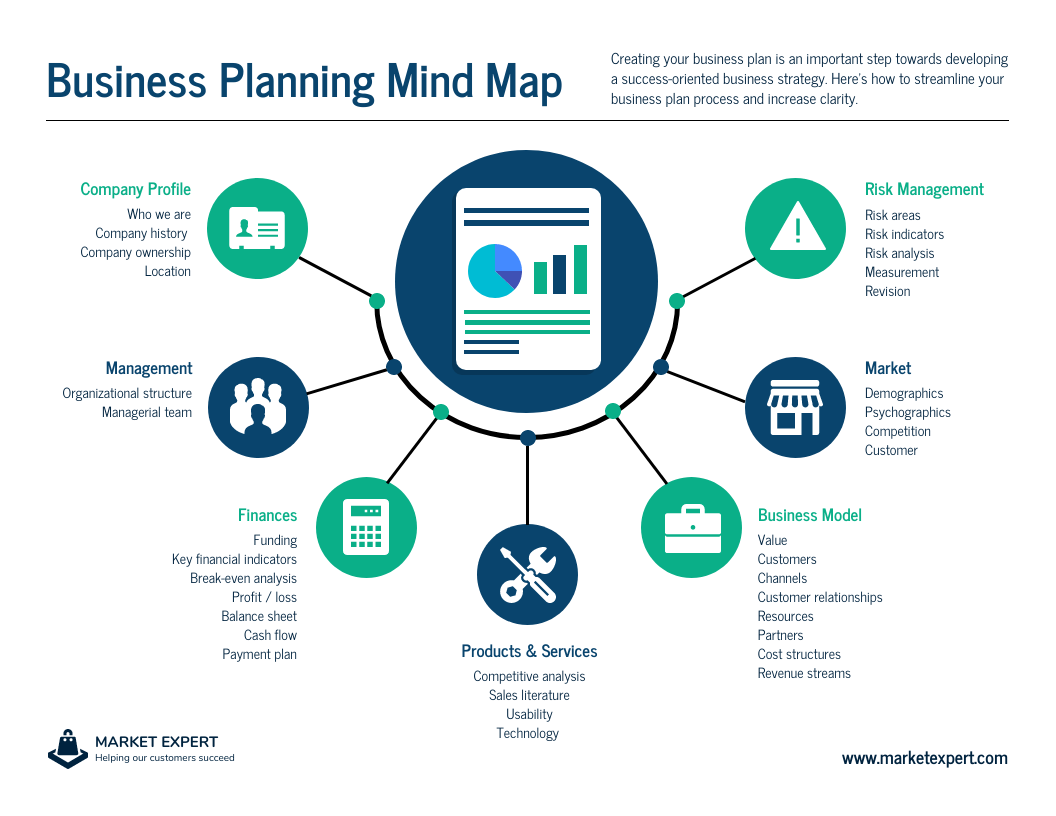
This simple business plan mind map summarizes what you should include in a business plan infographic:
How to create a traditional business plan infographic
When you’re creating a traditional business plan infographic you need to ensure that you have the following features or data in your infographic based on your objective.
-
Executive summary
This section should show your reader what your company is all about and why it’s expected to be successful. This means to include your mission statement, values, product or service, company positions, and basic information that will be helpful to know.
-
Company description
Go in-depth about your company mainly focusing on the problems and solutions your business will provide for your industry, target audience, or niche. In this section, you’ll also have to list out your competitors and how you’ll follow suit on gaining the competitive advantages.
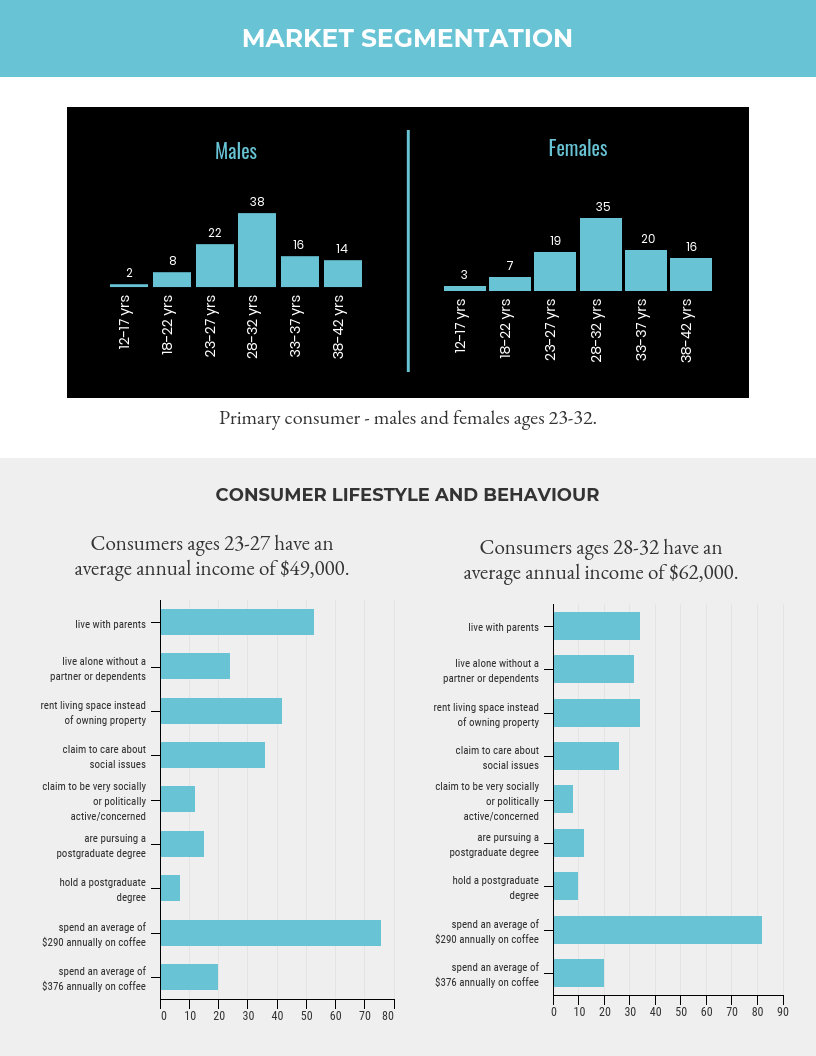
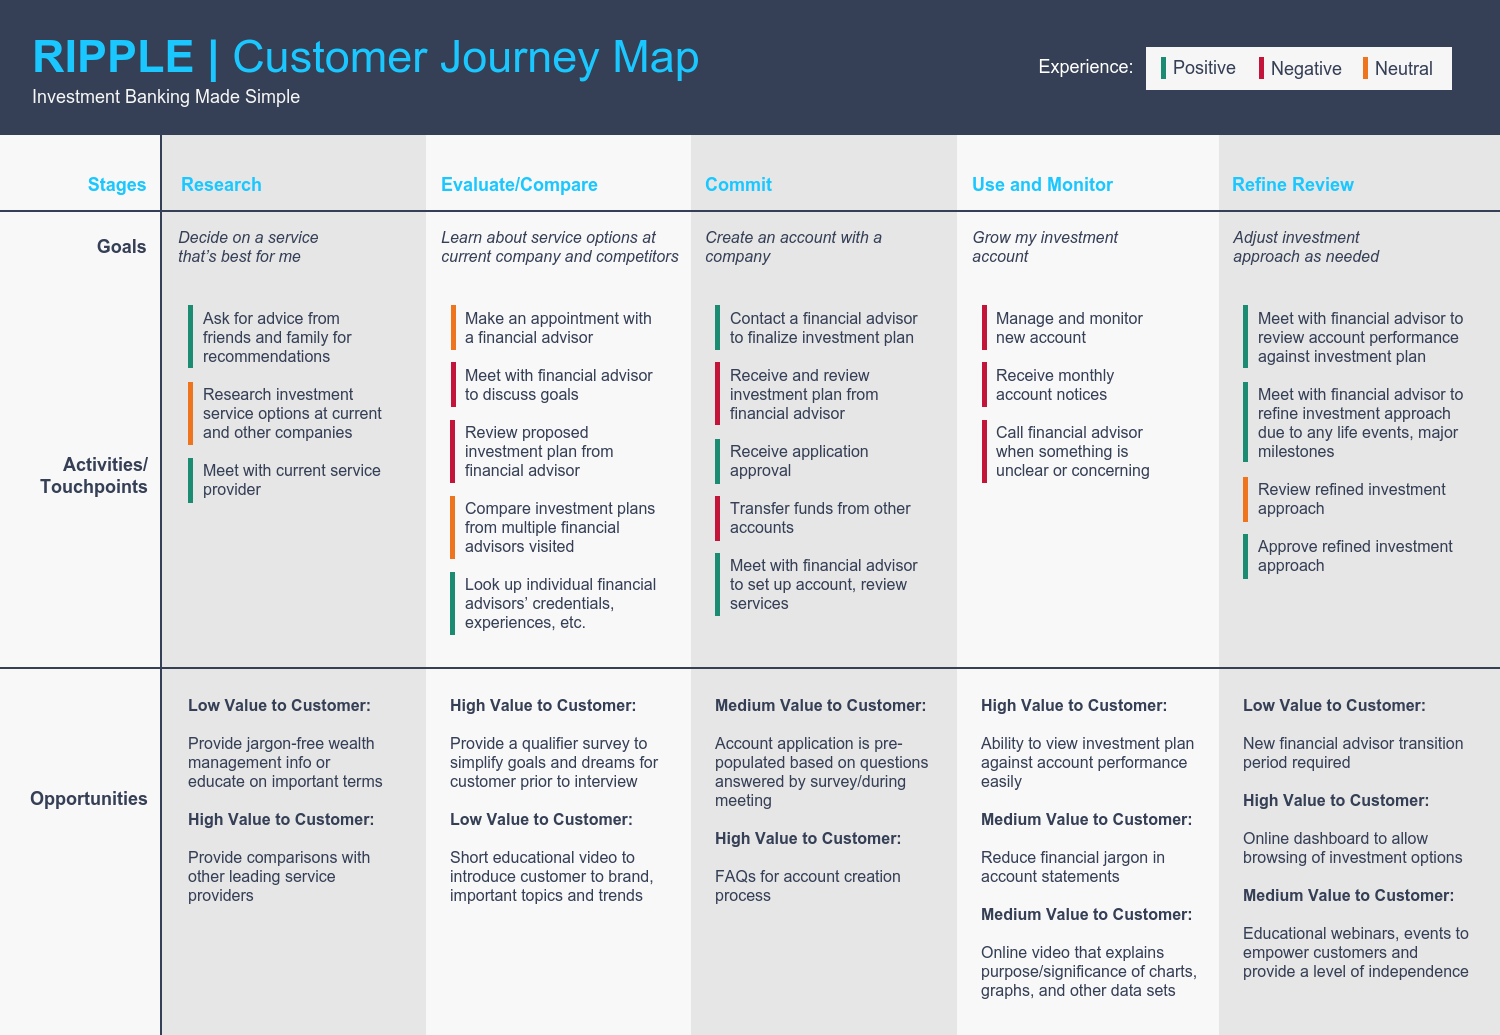
You can include this marketing business plan infographic as part of this section:
-
Market analysis
In this section, you’ll show research to show what other businesses are doing and what their strengths are, this means finding trends, stats, reports, themes, and successful breakthroughs that should be considered for your own business and how you can improve upon them.
Related: 20+ Strategy Infographics for Business Planning, Marketing and Branding
-
Organization & management
Summarize your overall business and legal structure in this section to let investors or bankers know if you’re a C or an S corporation. Take the steps to start an LLC, however, it’s essential to understand the laws and regulations in your state, LLC fees and other aspects that most lawyers recommend. It would also be helpful to add an organizational chart to allow readers to visually see the company hierarchy.
Also, utilizing an LLC Operating Agreement Template can provide a comprehensive framework for defining ownership, management structure, and operational procedures within your limited liability company.
One of the primary advantages of forming a Limited Liability Company (LLC) is the protection it offers to personal assets. Unlike sole proprietorships or general partnerships, an LLC establishes a legal separation between the business and its owners. This means that if the company faces lawsuits, debts, or other financial obligations, members’ personal assets (such as homes, vehicles, and personal bank accounts) are generally shielded from liability. This protection is a key reason many small business owners and entrepreneurs opt for the LLC structure.
Related: 15+ Company Infographic Templates, Examples & Tips
-
Service or product
Take the time to give a good first impression about what exactly your service or product does. Showcase the product or service lifecycle with charts and share plans for legal steps surrounding your product or service like copyright or patent filings.
Related: 7 Ways to Show Product Value Using Infographics
-
Marketing & sales
Outline an overview of your launch marketing strategy and how it will evolve and grow over time to fit your goals and market needs.
-
Financial projection or Funding request
If you’re sharing this section with an investor then you should focus on convincing them that your business is financially stable to be invested in. To gain the most accurate projection, you should pull data from your business management system to predict income statements, break-even analysis, return-on-investment calculations, balance sheets, and cash flow statements for the coming 2-5 years of your business.
Related: 14+ Finance Infographics to Simplify Financial Information [Templates and Examples]
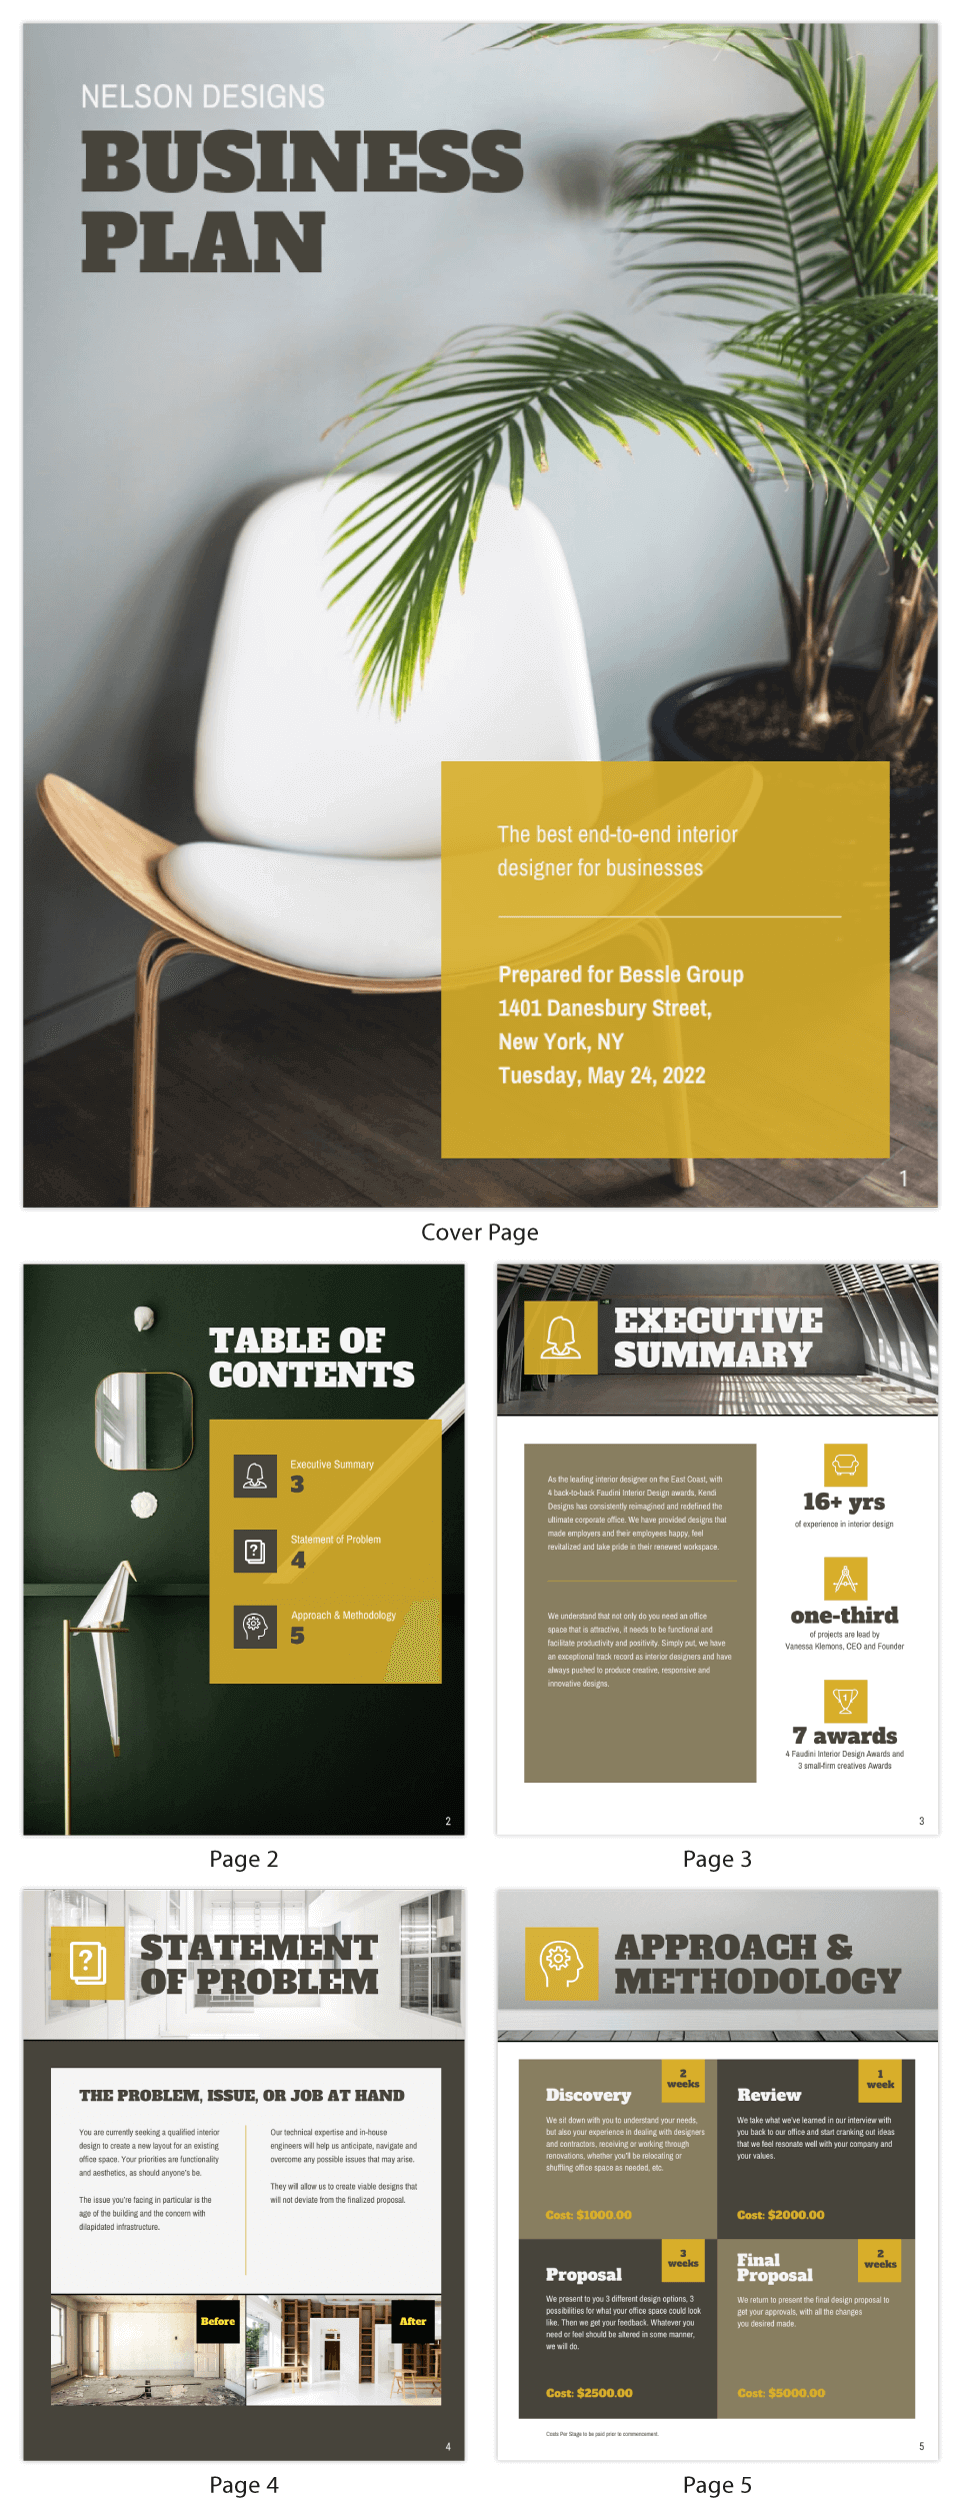
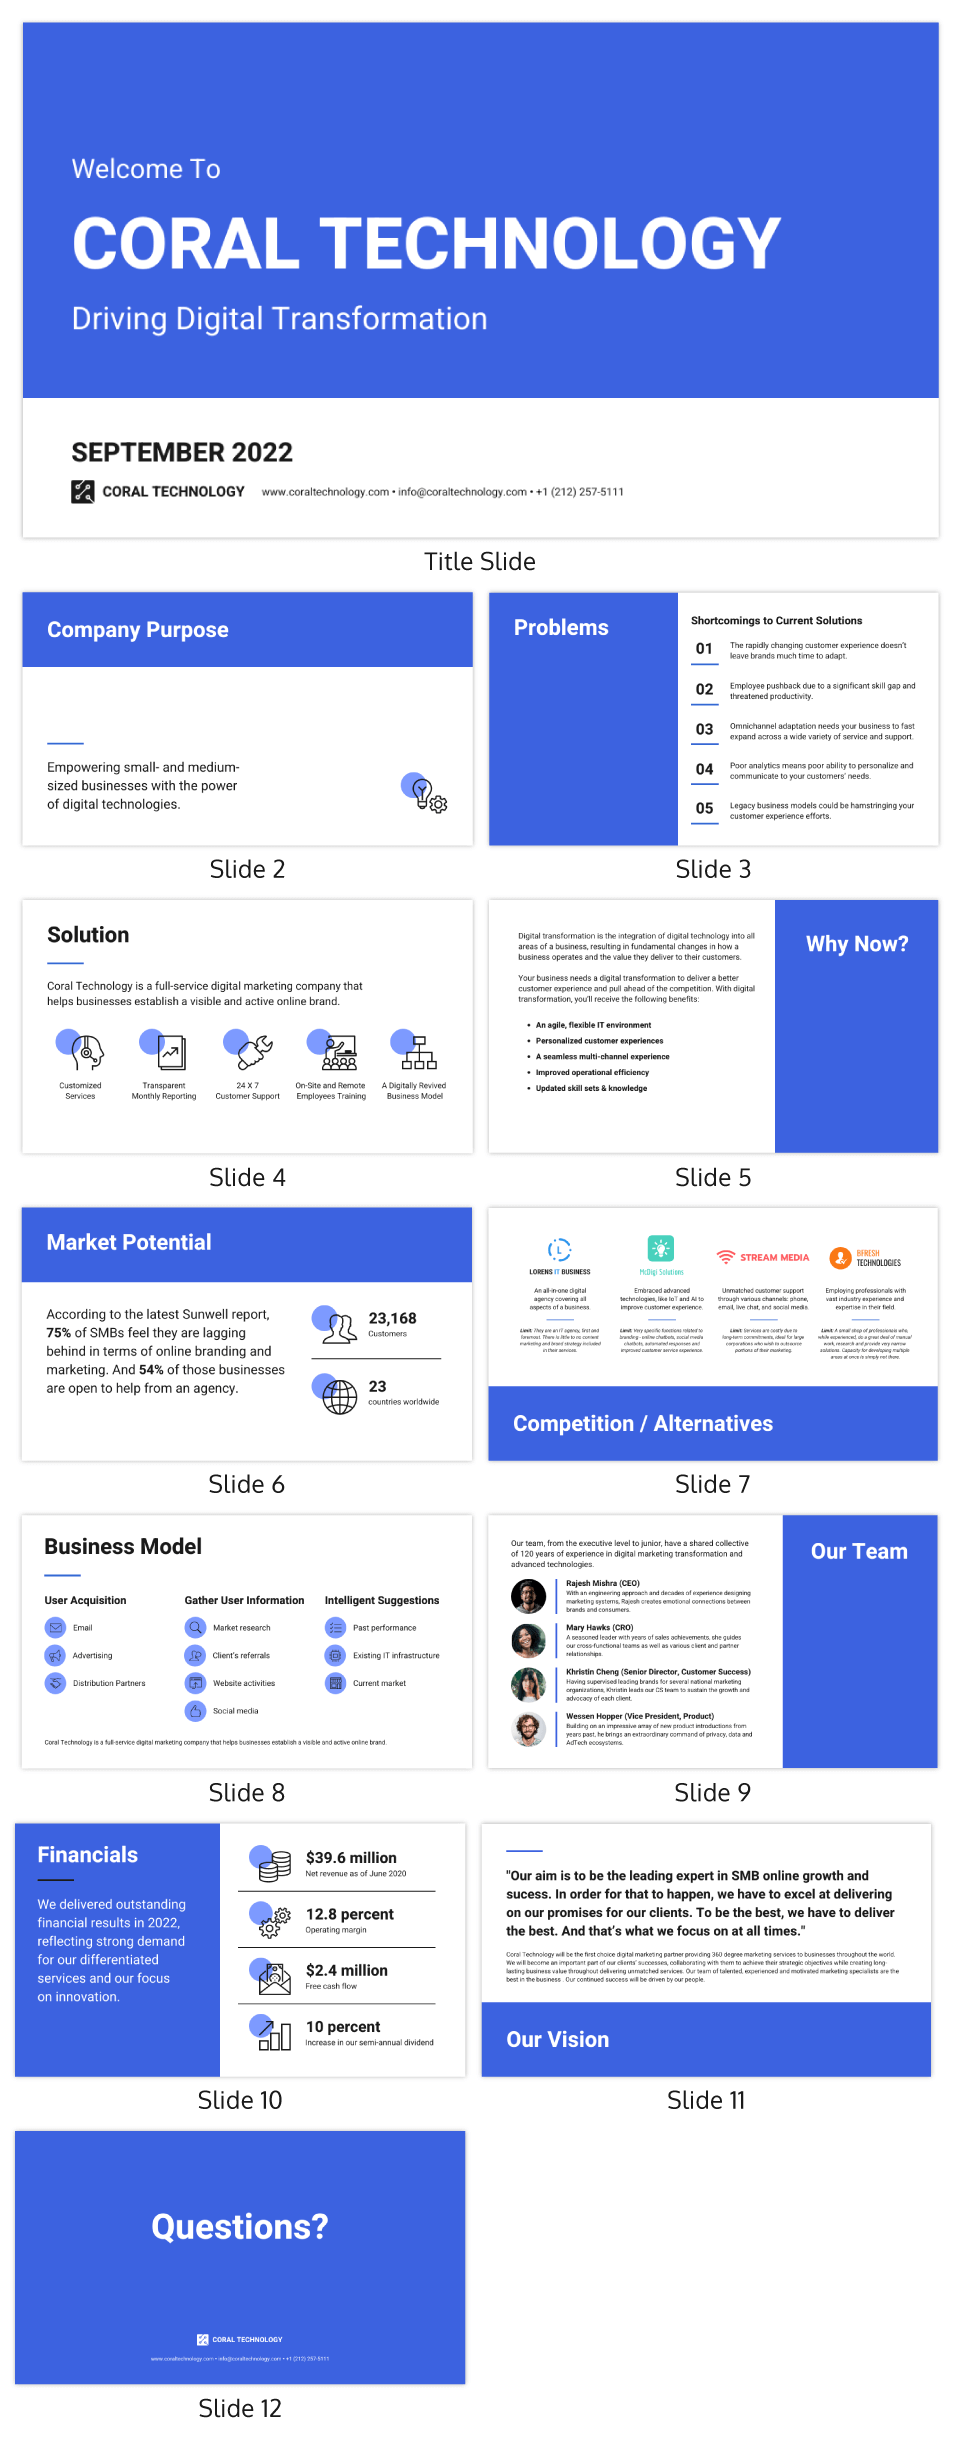
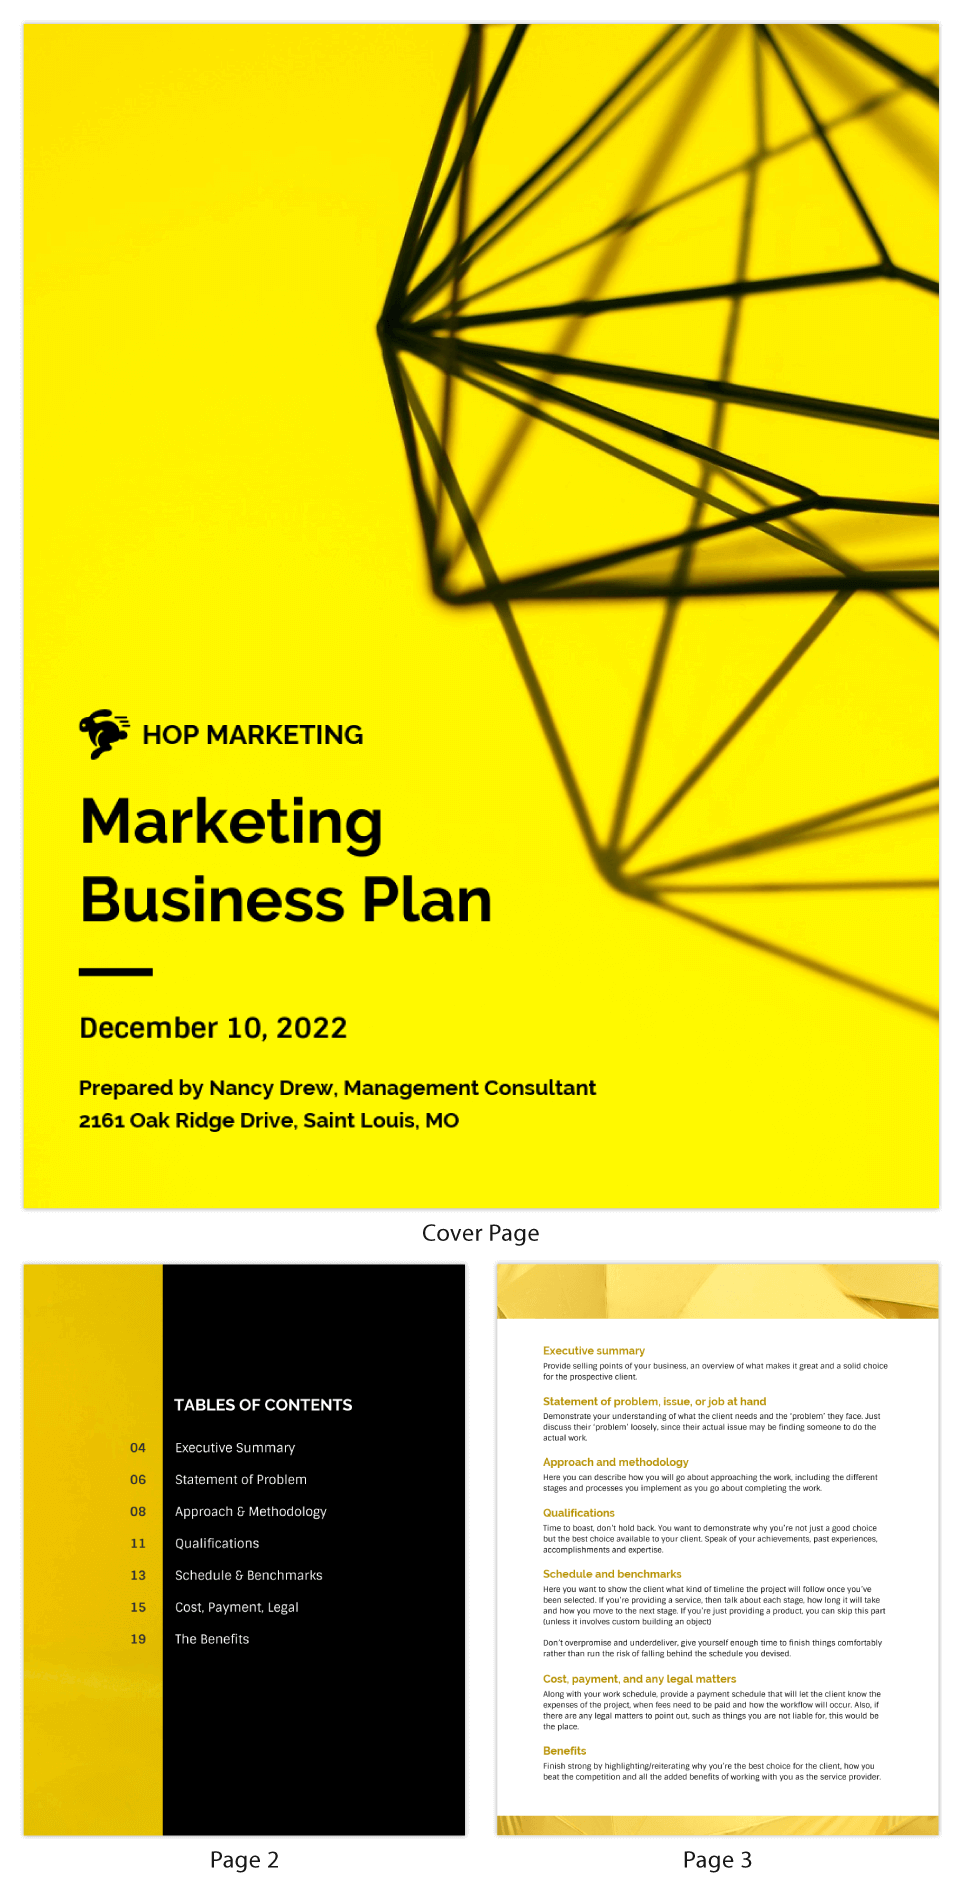
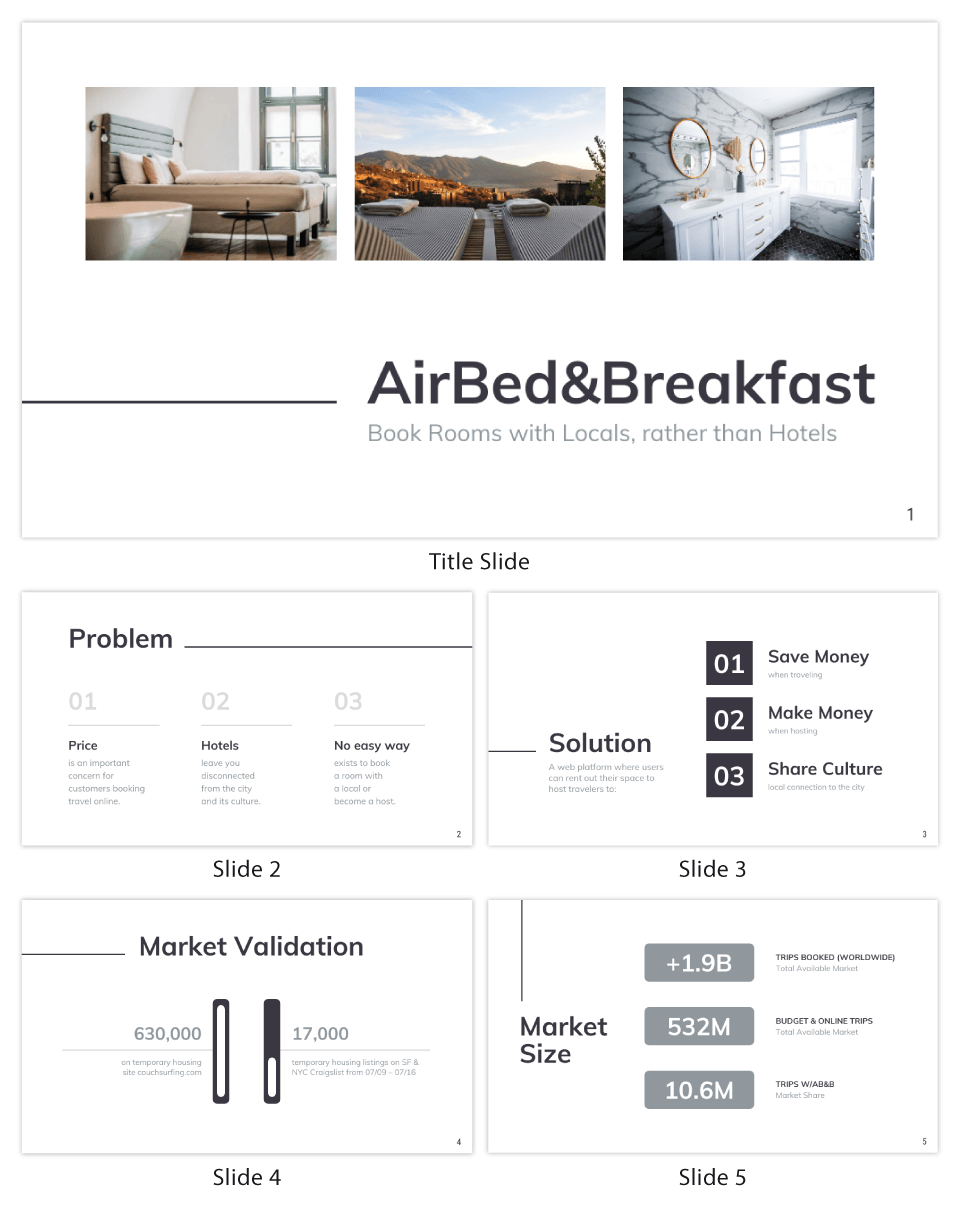
This Coral Technology Pitch Deck is a perfect example of a comprehensive traditional business plan agency infographic in the form of a presentation that can be used on PowerPoint or Google Slides:
How to create a lean startup business plan infographic
A lean startup business plan is much “leaner” as the word suggests. This is also shorter than the traditional business plan. A lean startup business plan infographic includes:
-
Key partnership
In this section state the other businesses or services that you’re working with to run your business’s operations. These could be key suppliers, manufacturers, subcontractors, and partners.
-
Business activities & resources
List in detail how your business will acquire the upper hand in your industry. Highlight features such as selling directly to consumers or taking advantage of the sharing economy. Run down any assets you’ll use to make an incentive for your customers.
-
Value proposition
This is a statement that shows the reader what unique value your business offers to your target audience in your niche or industry.
-
Customer relationships
Create a product or service flow of how consumers will interact with your business. Will this personalized, automated, or specialized based on their needs. You should also list the channels you’ll be using to reach, maintain or optimize for your customers over time.
-
Customer segments
Describe who your ideal customers are in detail. List out who or where your target market will be and how your business will service and connect with them.
-
Cost structure
This section is similar to the financial projections segment in a traditional business plan, but this also includes how your company will reduce cost or maximize value as you balance significant costs that may challenge your startup.
-
Revenue streams
Use this section to explain how your startup will become profitable over time and will be used such as membership fees, subscription payments, selling ad space, and obtaining retainer contracts.
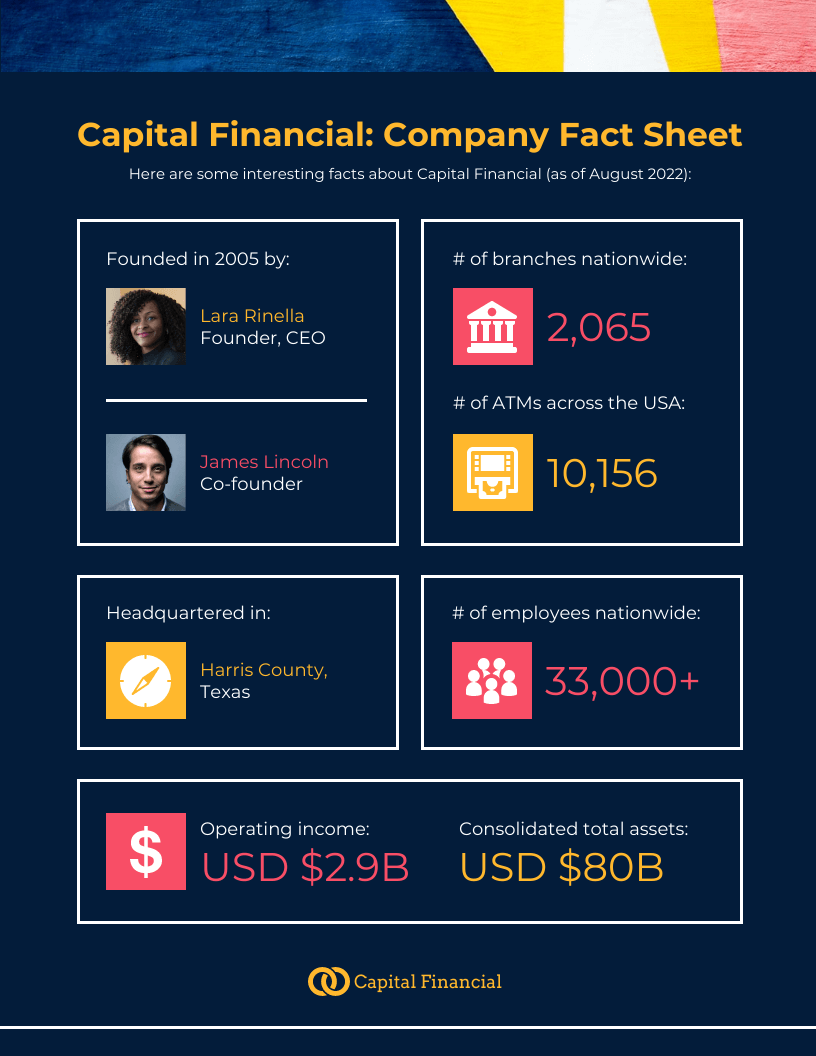
This Financial Company Business Fact Sheet is a good example of a lean startup business plan infographic as it gives an overview of the business with key figures only:
Business plan infographic examples
Let’s take a look at some more business plan infographic templates and examples.
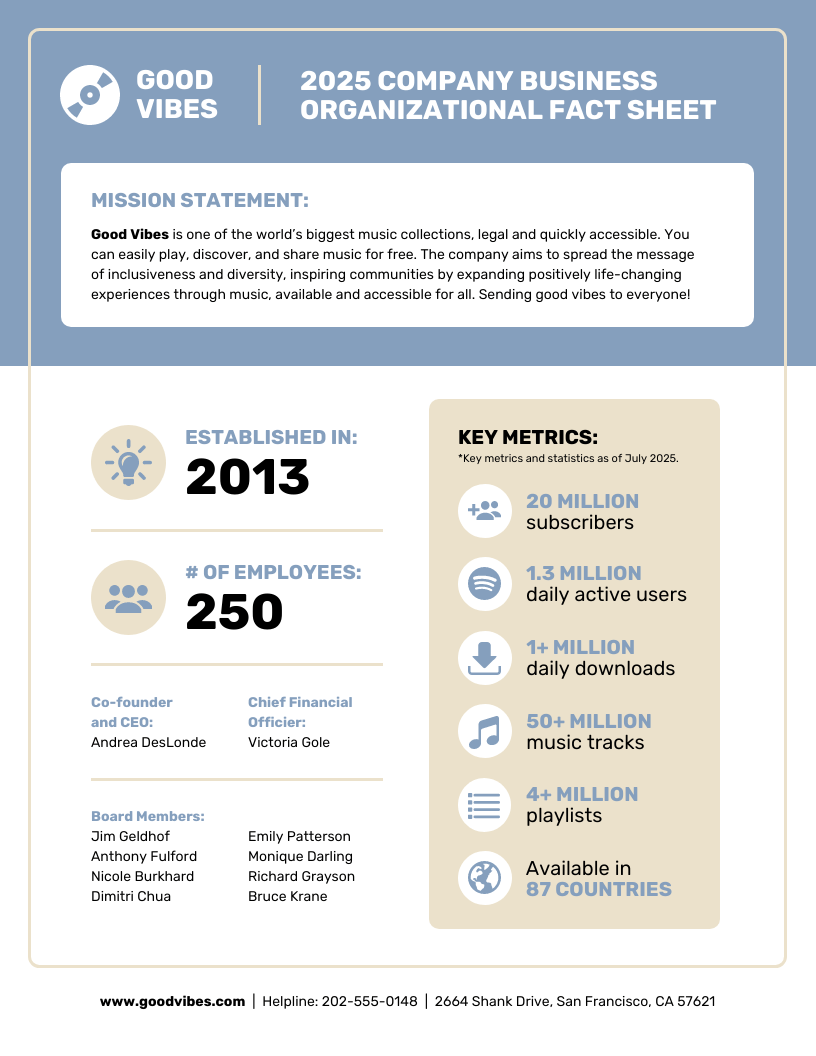
Free business plan infographic template
This Light Company Business Fact Sheet is a good example of a free business plan infographic template that belongs to the lean startup type.
Marketing business plan infographic
On a different note, this Yellow Marketing Business Plan leans towards the traditional type, being in the form of a comprehensive marketing business proposal that contains multiple infographics.
Real estate commercial business plan infographic
The information in this real estate business plan infographic is broken down in the form of a presentation, making it easy to use in business pitches.
Key design elements of a business plan infographic
There are three main aspects of a business infographic: visual elements, content elements and data or facts used.
As simple as an infographic may look, putting all three of these elements successfully together can be the difference between good infographics and a cluttered and confusing infographic.
Since we already covered data, let’s dive into the visual and content elements of your infographic.
1. Choose an ideal infographic layout
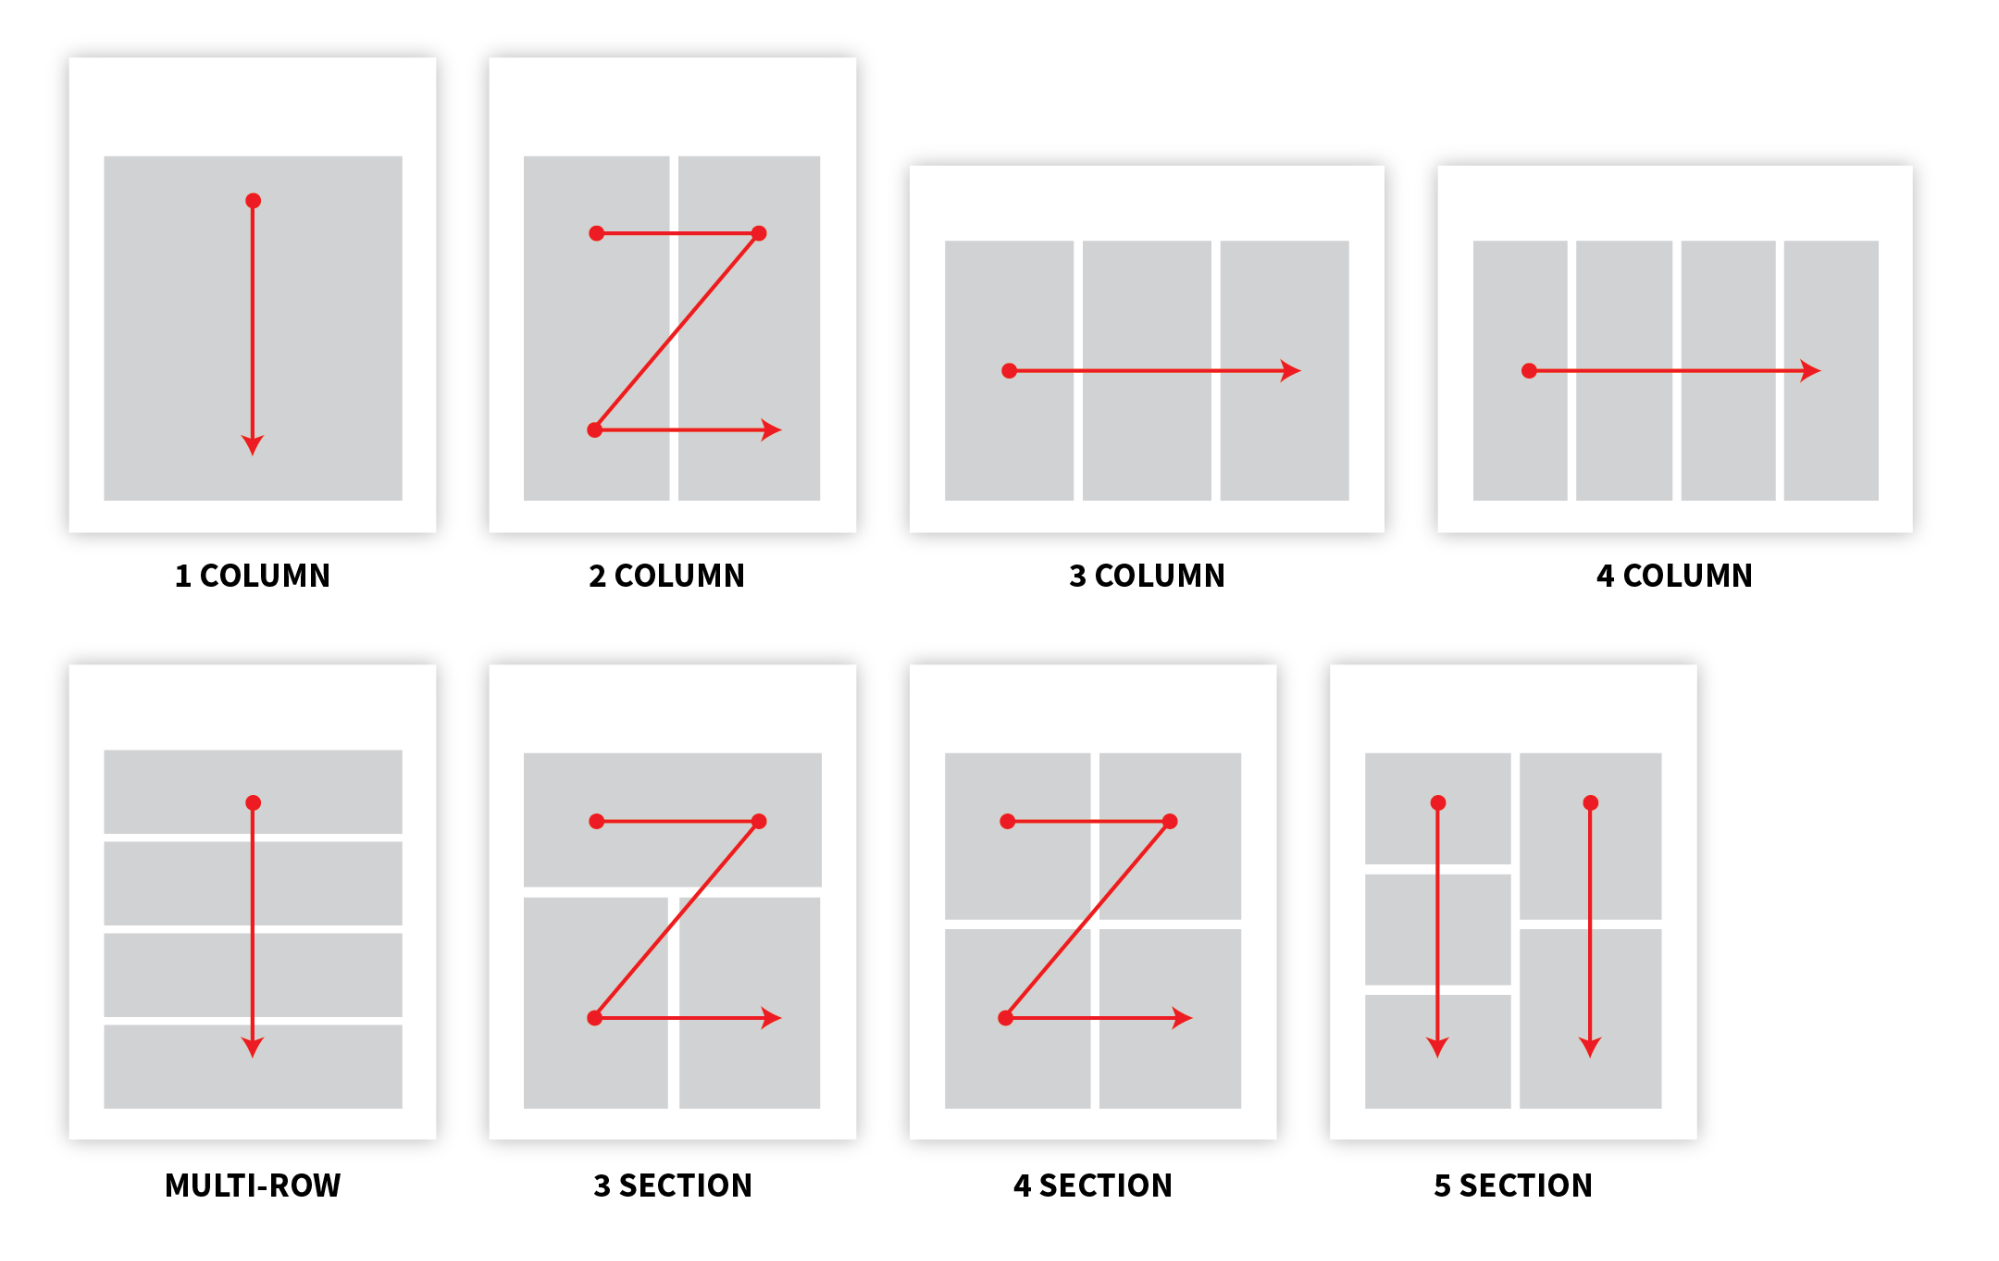
Infographics come with multiple layout options. Layouts help you to decide how you want to share your story or data with the reader. Layouts also guide your designs and colors. Most layouts are recognized by columns or sections, as shown below:
If you’re not someone whose every design is savvy, you don’t need to memorize all these layouts instead, just remember these three main infographic layouts: stacked, comparison, and chronological. For more information, read our blog on how to choose the right infographic layout.
2. Select captivating colors for your infographic
Other than usingy our brand colors, you always want to keep in mind who your audiences are, what action you want them to take and how colors can affect that.
If you need help picking the right colors for your business plan infographic here are two guides that are sure to help you:
- How to Pick Colors to Captivate Readers and Communicate Effectively
- The Do’s And Don’ts of Infographic Color Selection
Or you can watch this short video on color relationship and how that affects your design:
3. Choose the best content elements
Content elements represent the icons or charts you’ll be using to represent your data. Instead of simply dropping numbers and stats you want to give readers a visualization of what the data means and how it’s transitioned through your topic.
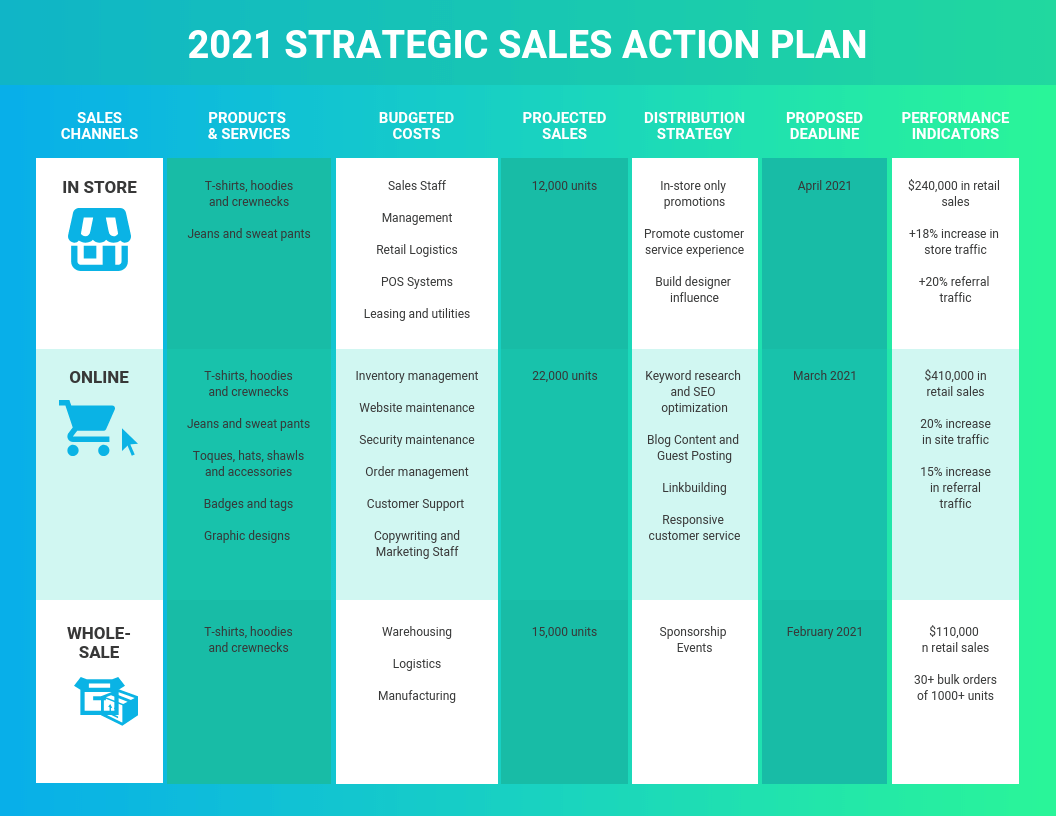
For example, if you want to represent the difference between the growing number of brands going wholesale vs retail, you could use a stacked bar chart to compare the two industries.
If you’re not sure about how to select the best chart for your data when you’re putting the final touches on your infographic design, check out our guide on selecting the right charts for your data, or watch the short video below:
How to get the most out of your business plan infographic
The real work starts once you’ve created your business plan infographic. You’ll now need to effectively showcase or share your infographic in a way that allows you to get the most out of it.
If you’re using your business plan infographic for internal purposes then consider:
- Adding it to your onboarding documents
- Using it for presentations
- Sharing it with new or current investors for specific projects
- Showing team roles and hierarchy
Business plan infographics can also be used for external purposes to pitch to potential investors or new clients. They’re normally in presentation or proposal form, as we can see from some of the examples above.
Another thing to consider is to make your infographic mobile-friendly. Not all investors or partners look at documents from a business from a desktop. Having a well-optimized infographic allows the reader to get the full experience from your business plan infographic regardless of what device they may be viewing it on.
Business plan infographic FAQ
1. Why should I create a business plan infographic?
A business plan infographic with data visualizations and concise, key information allows stakeholders to take a quick look at the current state the company is in and understand right away. This improves the success rates of your business pitches, whether they’re for investors, clients or senior management.
2. How do I make my business plan infographic look professional?
Make sure you keep in mind your brand guidelines while creating your business plan infographic to ensure consistency and professionalism in all comunications materials. You can also customize one of ours ready-to-use infographics which are designed to be used for businesses.
3. How do I create a business plan infographic?
Start by registering for a free account for Venngage’s Infographic Maker. You can then choose from our wide variety of business plan infographic templates that you can create using our easy-to-use editor, no design skills needed.
In summary: Business plan infographics are great to use for both internal and external purposes
Consider using business plan infographics whenever you need to deliver a sales plan presentation, pitch a new project or present your services to new clients.
Venngage has hundreds of business plan infographic templates you can use to create your business plan infographic with no coding or design experience required.
Need to make an infographic? Start creating in seconds with our professional templates and simple online editor.


