


Microsoft Word is great for reports, resumes, and more—but did you know you can also create infographics with it? If you’re an educator or team manager, you might have considered using Word to make a quick infographic. In this post, I’ll show you how to do just that.
But fair warning: Word’s infographic features are pretty basic. If you want something more professional, check out Venngage’s Infographic Maker and infographic templates for easier, more polished designs. Let’s get started!
Why create infographics in Word?
Creating infographics in Word is ideal if you’re already familiar with the software and need something quick. It’s great for simple designs like basic charts or text-heavy visuals without learning new tools.
Plus, if you’re already using Word for reports or presentations, it’s easy to keep everything in one place. However, if you’re looking for more polished, professional designs, there are better tools out there — we’ll get to that later.
How to create an infographic in Word
For demonstration, I’ll create an MS Word document in the latest version of MS Office 365 suite.
If you’re using a different version of Word, some steps may differ slightly.
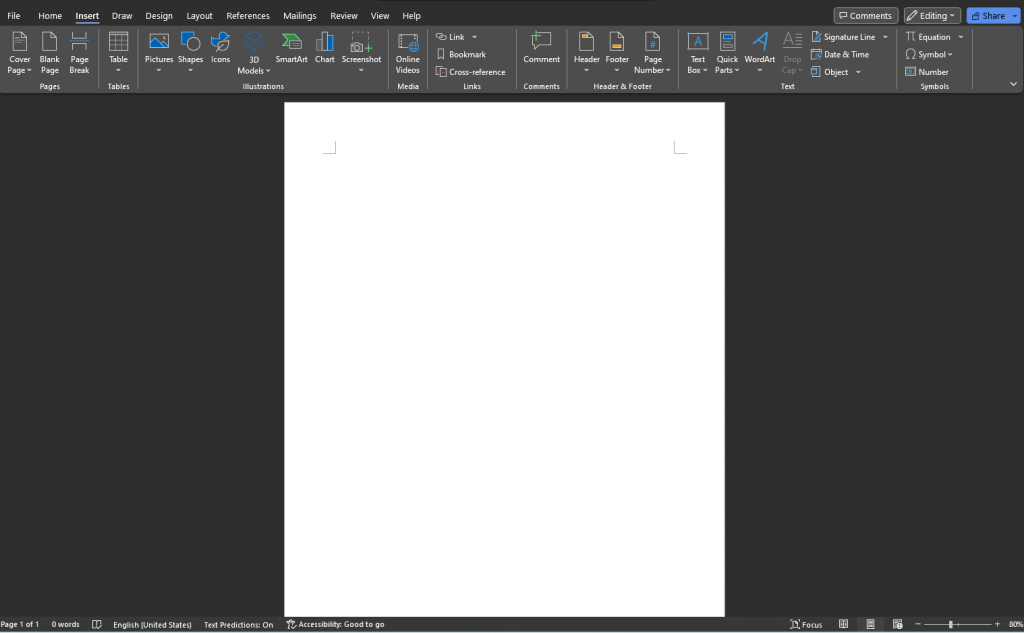
Step 1: Create a new document
Open Microsoft Word and create a new document. This is the blank canvas where you’ll edit and design your infographic:
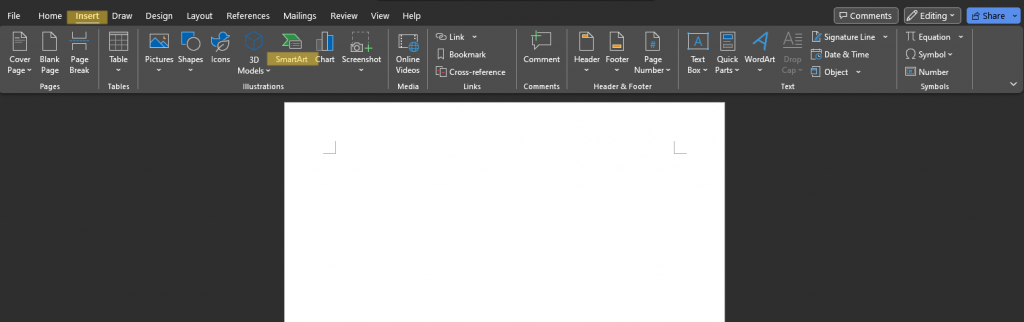
Step 2: Select the “Insert Tab” and click “SmartArt”
Click the Insert tab on the ribbon at the top of your Word document. Here, you should see the SmartArt option. Click on it to get the list of infographic templates:
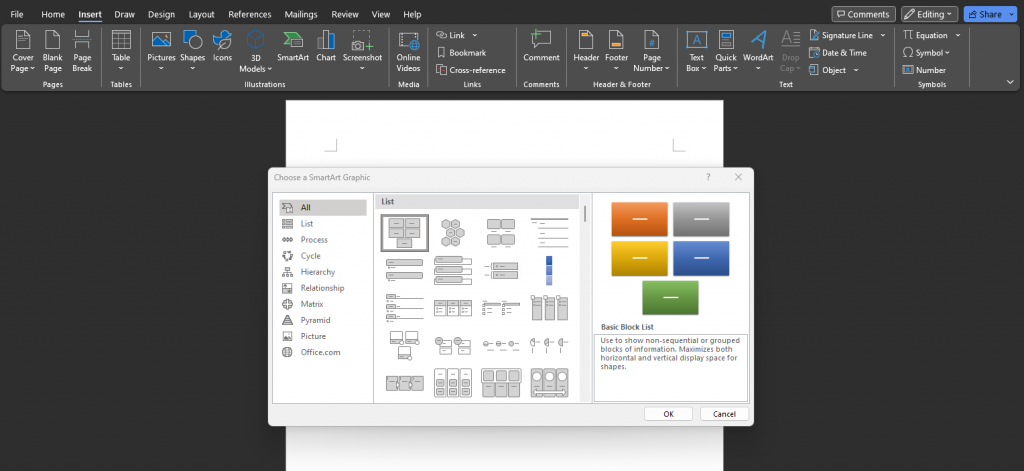
Step 3: Select your infographic type
When you click on SmartArt, you’ll see a gallery of infographic templates. Choose the one that best suits the type of information you’re presenting:
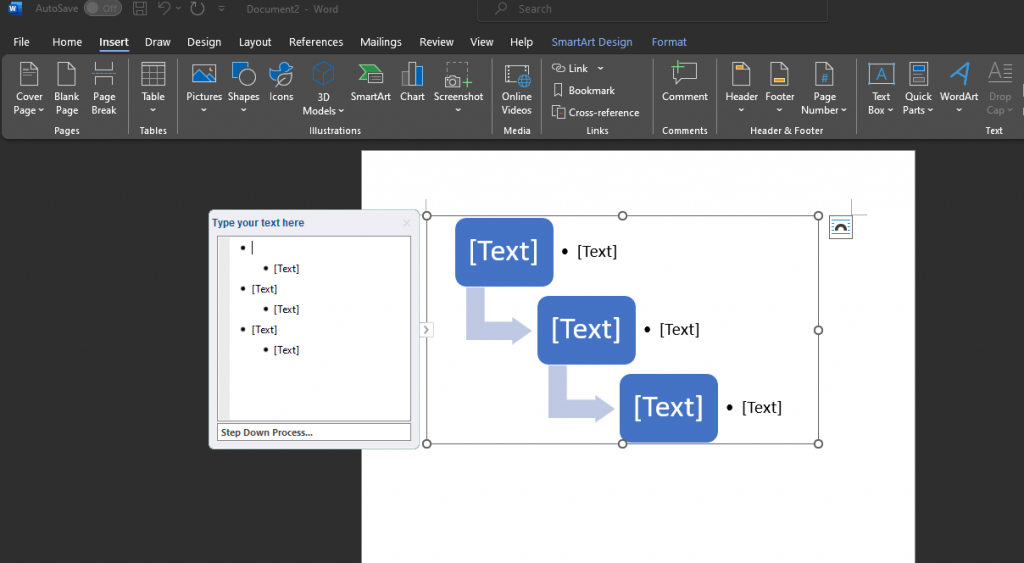
Step 4: Edit your infographic
Generally, Word infographics are dull. But you can make them better using the SmartArt Design and Format options on the top right toolbar.
For example, I changed this black-and-white infographic into a colorful one:

If you want to add various graph types, go back to the Insert tab and select the Chart option. Word has several chart options such as pie charts or bar graphs.
Here are some other customization options:
- Add text styles: Change text to different fonts, sizes and colors to highlight key points.
- Insert a standalone image: Add visuals to Word infographics to make them engaging. But you’ll have to source it yourself.
- Align and group objects: Alignment and grouping play a big part in how professional your infographic looks.
Step 5: Save and export
Once your infographic is ready, Word allows you to share it in many ways. You can download your file as an Adobe PDF file, JPEG or HTML.
And that’s it!
If it feels like there’s a lot to do in each step, you’re not alone. Word is primarily a text-processing application. This means it offers limited options to edit layouts and it’s a headache to figure it out.
Luckily, there are better ways to create beautiful infographics. Later, I’ll show you just the right tool that offers easy drag-and-drop editing and customizable templates.
What are the 5 types of infographics you can create in Word?
In Word, you have two choices to create infographics. You can either create them from scratch using shapes. Or, you can select an existing infographic template.
If you choose a template to create an infographic an MS Word document, you’ll have a variety of infographic templates to choose from.
Below are some infographic templates in Word and examples of ones that are more effective.
1. Process infographics
Process infographics show you the steps of a procedure or workflow. You’ll see them in manuals, training guides, and educational materials.
Here’s a basic process infographic template in Word:
Here’s an example of a process infographic that stands out:

2. List infographics
List infographics are ideal for presenting a series of items, helpful tips or ideas. You’ll see them in informational brochures, feature articles and how-to guides.
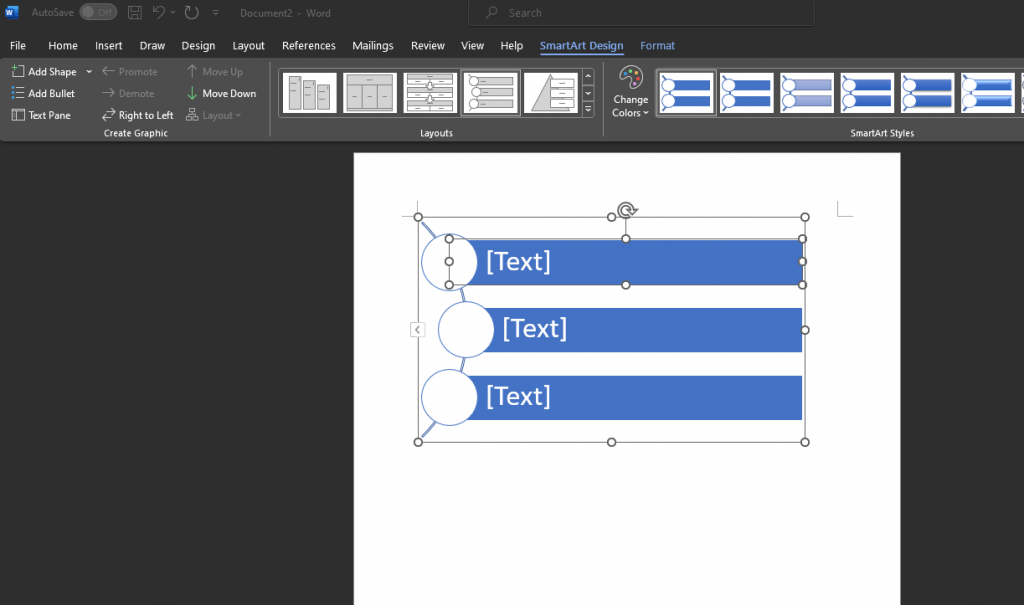
Here’s one example of a list infographic:

3. Hierarchical infographics
Hierarchical infographics are similar to relationship charts. They show how different elements connect in a top-down layout:
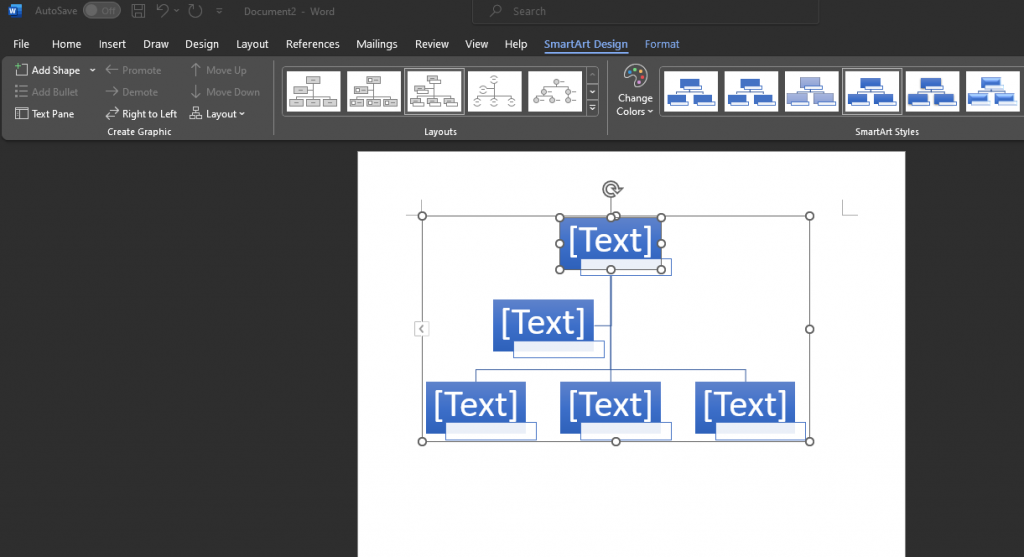
Here’s an example:

4. Matrix infographics
Matrix or comparison infographics organize and display data in a grid. This is useful in business reports, educational materials and data analysis.
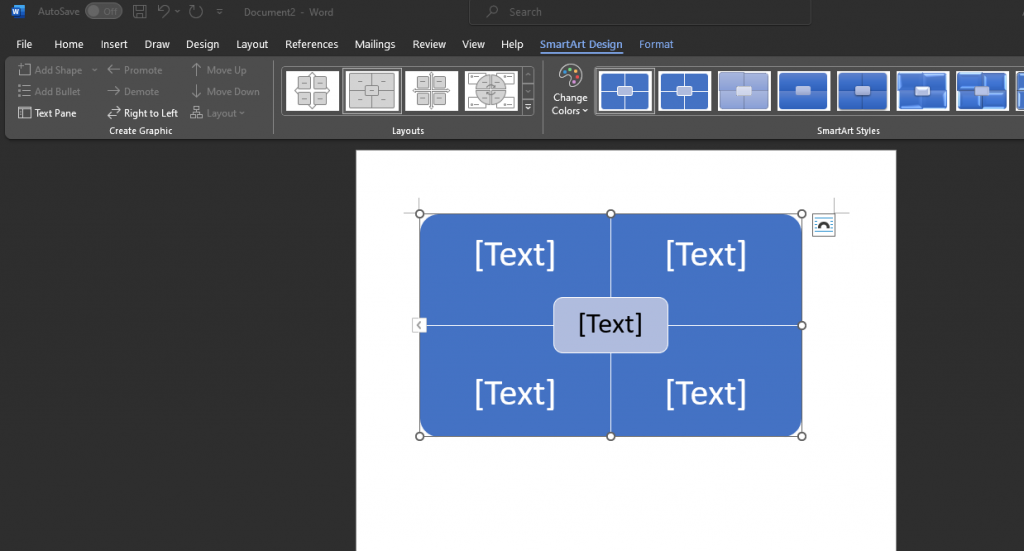
Here’s an example of a matrix infographic:

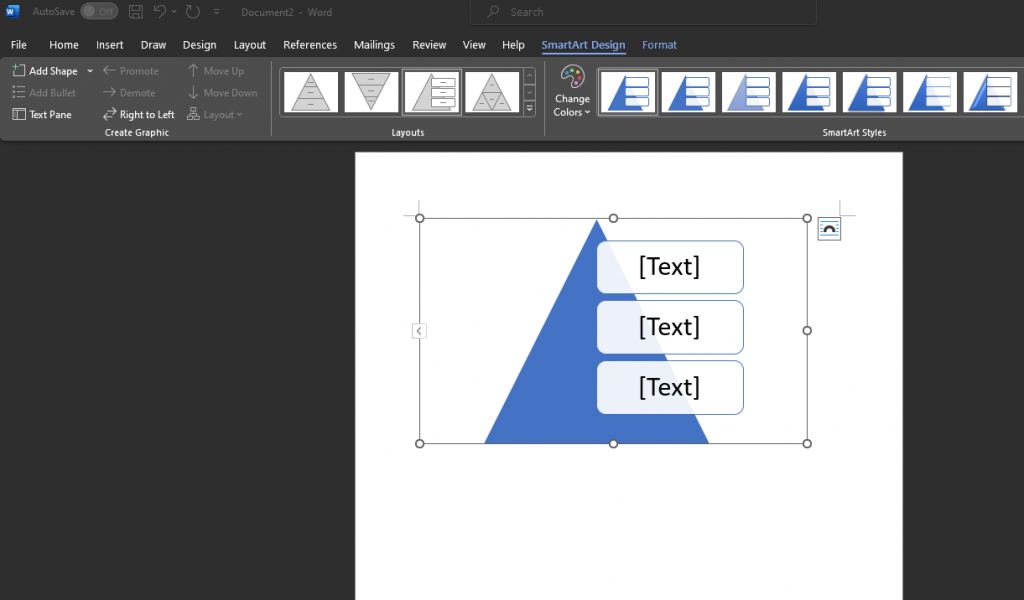
5. Pyramid infographics
Pyramid infographics show layered relationships in a tiered format. They’re usually used to show organizational structures or levels of achievement:
Here’s an example of a pyramid infographic designed in Venngage:

What are the alternative tools for creating infographics?
Microsoft Word is great for documents but falls short when it comes to designing eye-catching visuals. Luckily, there are better tools out there.
Venngage, for example, makes it easy to create professional, stunning infographics — even if you have zero design experience. With ready-made templates and intuitive drag-and-drop features, you can bring your ideas to life in minutes.
Next, I’ll show you how easy it is to create professional infographics using Venngage.
How to make professional infographics with Venngage
Creating an infographic in Microsoft Word is like using crayons to draw a portrait sketch — technically possible, but nobody’s hanging that on the wall.
But why bother? With Venngage, you can produce infographics faster and you don’t need to be a designer either to use it.
Here’s a step-by-step guide on how easy it is to make infographics with Venngage.
Step 1: Sign up for a Venngage account
Sign up for Venngage using your email or Gmail account. It’s free.
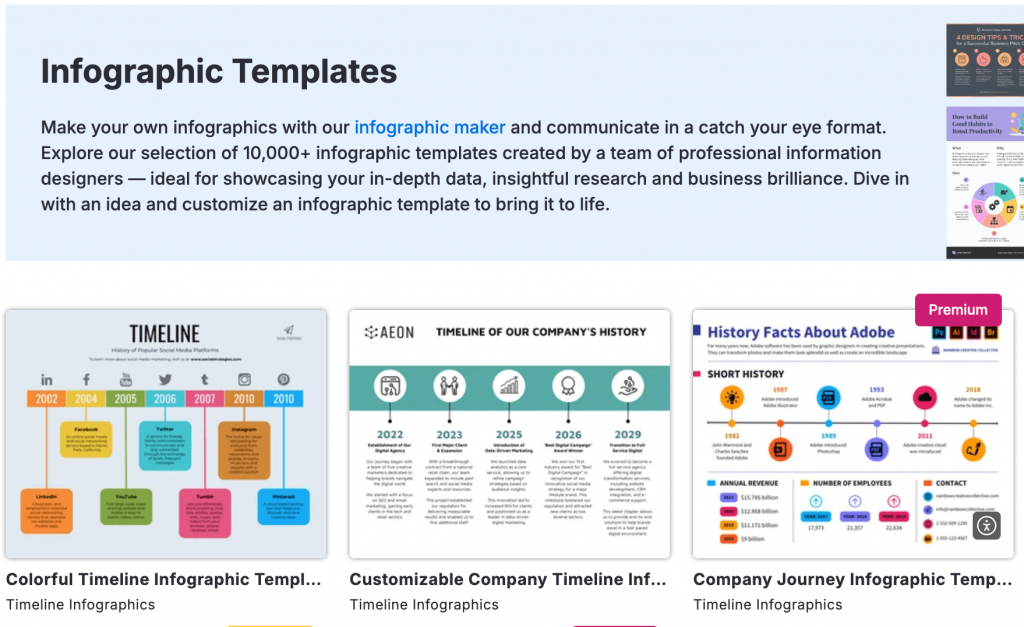
Step 2: Select an infographic template
Venngage has 10,000+ templates to choose from including infographic templates.
You can either choose a process infographic template to showcase complex procedures visually. They’re a great way to make educational material and training guides engaging.
Or create an informational infographic to present information in a way that is easy on the eyes.
Check out our free infographic templates and choose the one that fits your needs.
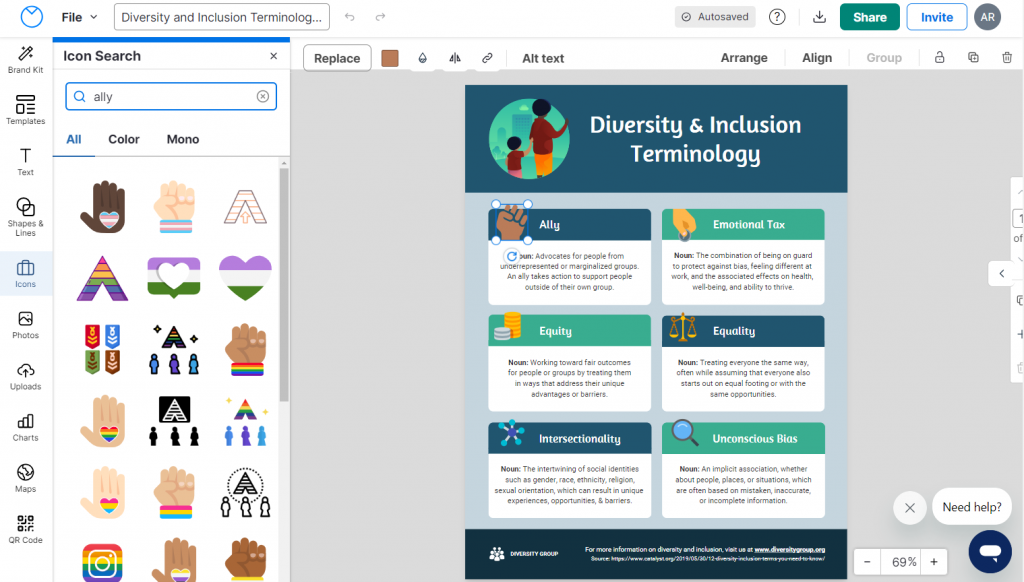
Step 3: Edit your infographic
Using Venngage templates gives you a head start to create visuals faster. But you can create one from scratch if you want.
Let’s say that you are designing a blank template and need icons for your infographic. Just go to the Icons tab on the left-hand menu panel and browse through thousands of free icons.
Once you like an icon, just click replace and that’s it!
If you sign up for a Business plan, you’ll also get access to My Brand Kit. This feature lets you apply your brand colors to any template with one click.
Other features include the ability to edit designs in real-time, comment on designs, create folders and export.
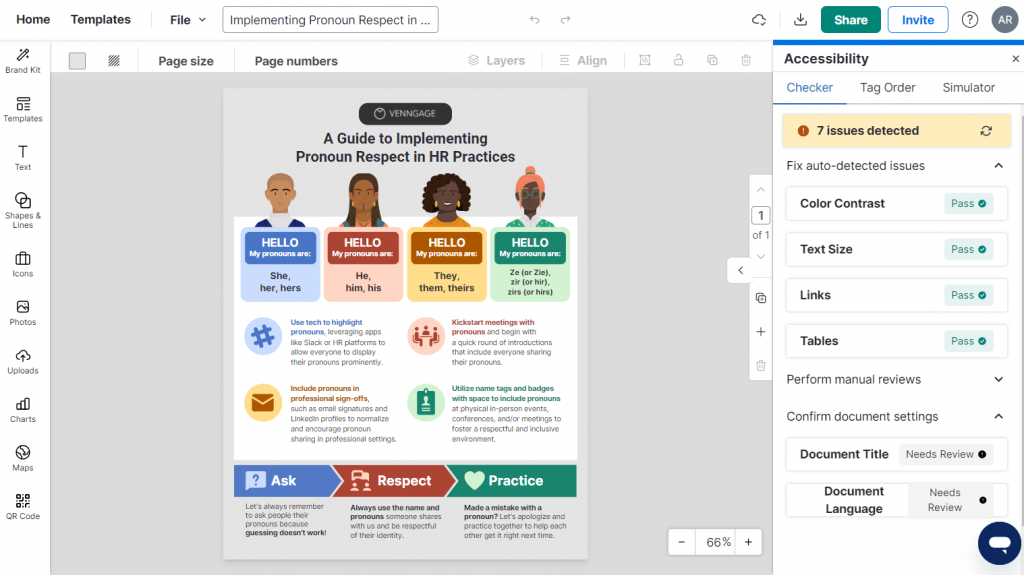
Venngage’s editor also has built-in accessibility features. When you design your infographics that align with the accessibility checklists, for instance, you make your visuals easily understandable for people with visual impairments or reading disabilities.
Once you’ve created an infographic, it’s time to share it with the world. With a free account, you’ll get a link to the infographic.
But if you want to download the infographic as a PNG file or PDF, you’ll need to upgrade to a Business account.

Making beautiful infographics doesn’t have to be hard
Infographics are a great tool to have in your visual communication toolkit. You can use them in academic presentations, business reports, social media marketing and more.
They have the unique ability to turn complex information into engaging visuals.
And you don’t really need world-class design skills to create an infographic. Try Venngage for yourself and see how easy it is to create infographics in just a few minutes.
Frequently Asked Questions
Can I make an infographic in Word?
Yes, you can create infographics in Word using its SmartArt, shapes and diagram features to create an infographic.
Does Microsoft Office have infographic templates?
Yes, Microsoft Office provides several types of infographic templates in its SmartArt feature. They can be a starting point for creating infographics in Word.
Where can I find free infographic templates?
You can find free infographic templates on many platforms. But the best resource for free infographic templates you can use for appealing design is Venngage.


