


In today’s information-driven world, where an overload of data can lead to overwhelming feelings, infographics emerge as a powerful solution to effectively communicate complex ideas and data.
By skillfully blending intricate health concerns into engaging narratives, infographics have the potential to captivate audiences and enable them to prioritize their well-being effortlessly. In order to cultivate meaningful connections, it is crucial to discover avenues through which our audience can not only receive information about the significance of their health and wellness but also comprehend its profound impact on their overall well-being.
To create visually compelling and informative infographics, use tools like the Venngage infographic maker, which provides a user-friendly platform to design stunning visuals that convey important health-related information. With a particular focus on health and wellness, a multitude of life and healthcare infographics exist to promote health literacy and foster healthier choices.
Let’s dive into what makes these infographics so effective, so you can start creating top-notch designs for your own needs!
Just so you know, some of our templates are free to use and some require a small monthly fee. Sign-up is always free, as is access to Venngage’s online drag-and-drop editor.
Click to jump ahead
- Introduction to life and health infographics
- 6 Types of infographics in the life and health industry
- Examples of effective life and health infographics in 6 top subcategories
- Tips for creating successful life and health infographics
- Importance of visual representation in communication and life & health education
- Use Venngage to design impactful life and health infographics
- Infographics for a healthier you: Educating, empowering, and inspiring wellness
Introduction to life and health infographics
A life and health infographic is a visual representation of information, data, or knowledge related to topics concerning life and health. It presents elaborate concepts, statistics, or guidelines in a simplified and visually appealing format, using a combination of text, icons, illustrations, charts and graphs.
Life and health infographics aim to educate and engage audiences by providing easily digestible and memorable information about various aspects of life and health, such as wellness tips, disease prevention, healthcare statistics, healthy lifestyle habits, mental health awareness and more. The aim of these infographics is to make healthcare technical jargon easily understandable for the public, simplifying complex concepts.
Life and health infographics combine the best of design and research to communicate with audiences on essential topics such as nutrition, fitness, mental health and medical advancements. They range from simple charts to intricate visuals, making the information more digestible, attractive and shareable. With most people being visual learners, these infographics are an incredibly valuable tool to promote health education and awareness effectively.
6 Types of infographics in the life and health industry
Life and health infographics come in multiple formats to suit different purposes. Here are six common types:
1. Statistical Infographics: These infographics present data and statistics visually through charts, graphs or percentages to make them easily understandable.

- Statistical infographics are designed to simplify complex information and present it in a visually appealing and easily digestible format.
- By combining color, layout, icons and typography, these infographics enable people to comprehend a substantial amount of data at a glance.
- They allow for the rapid identification of patterns, correlations and trends that might otherwise be overlooked or remain hidden within text-based formats.
- This type of infographic is particularly useful for industries and fields that rely on data-driven decision-making, such as marketing, finance and healthcare.
Statistical infographics have become increasingly popular in recent years as a means to communicate data-driven stories and news to a broader, non-expert audience.
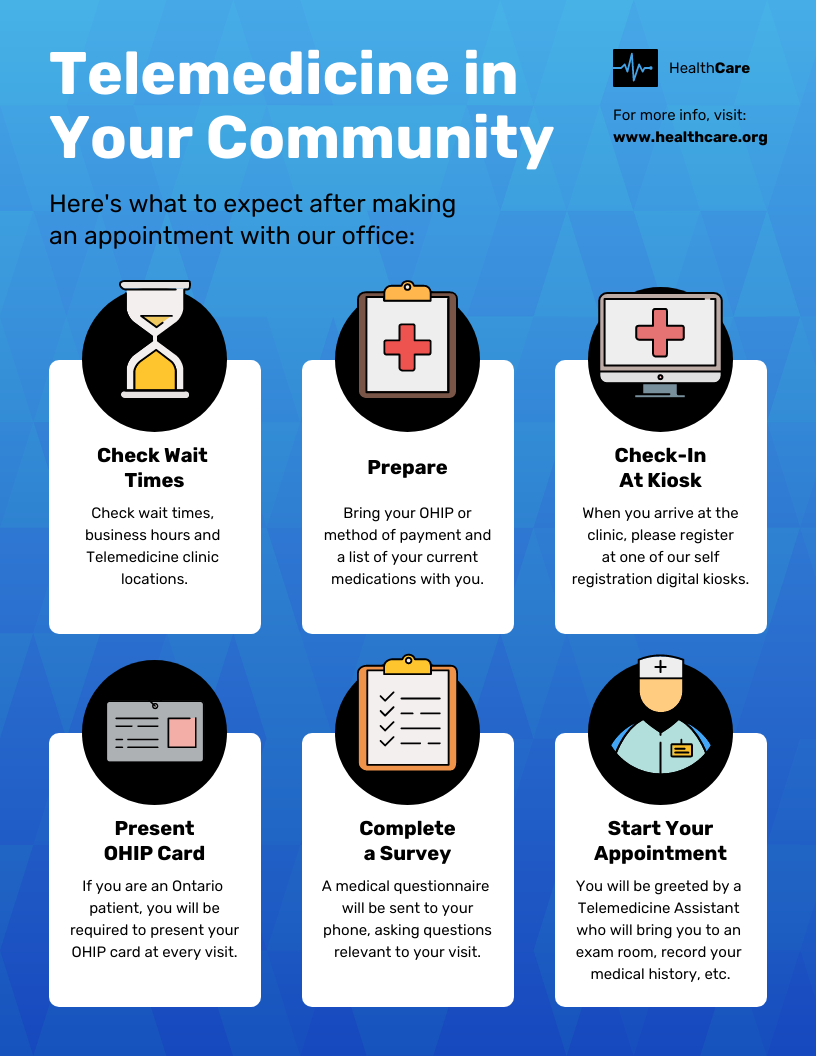
2. Process Infographics: This type of infographic showcases a step-by-step process or a series of actions that lead to an outcome. Process infographics break down information and present it in a linear, easy-to-follow format. This infographic helps the audience quickly understand and retain the material, making it a powerful tool for learning and communication.

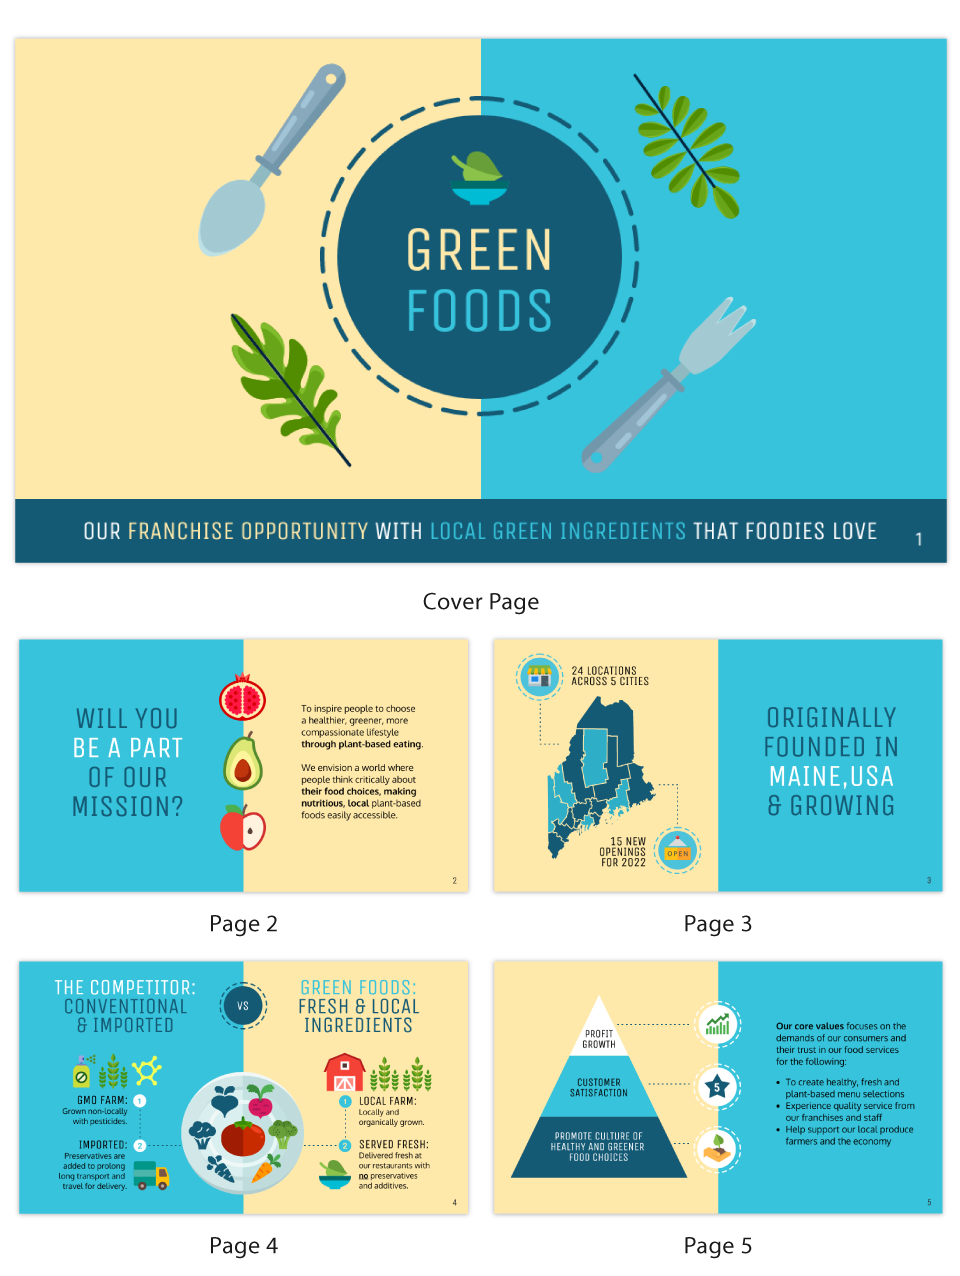
3. Comparison Infographics: These infographics display two or more elements side-by-side to demonstrate differences, similarities or unique features. Comparison infographics translate concepts in a visually appealing and easily digestible format. They are an excellent choice for marketers, educators and thought leaders who want to expand their audience’s understanding and generate insightful discussions.

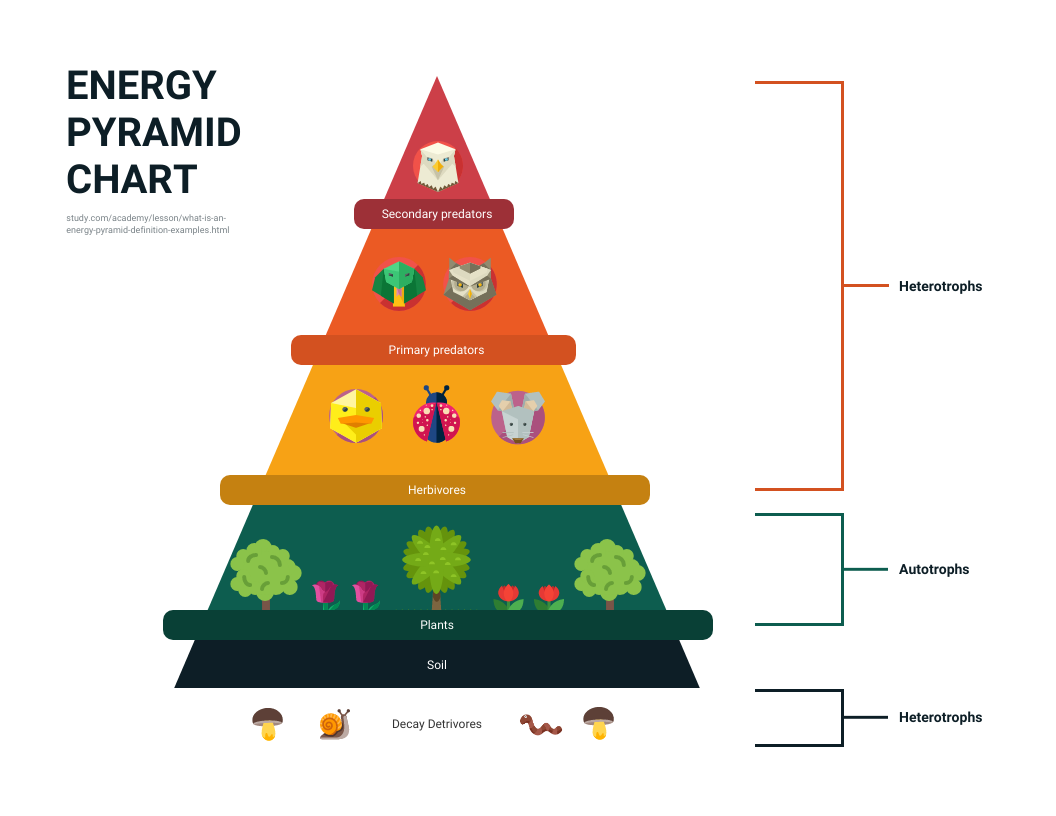
4. Hierarchical Infographics: These infographics use a pyramid or tree structure to illustrate rankings, hierarchies or classifications. Through the clear organization of elements in a hierarchical infographic, relationships and structures are simplified, providing a clear, succinct visual representation that makes it easier for viewers to grasp and retain the information being conveyed.

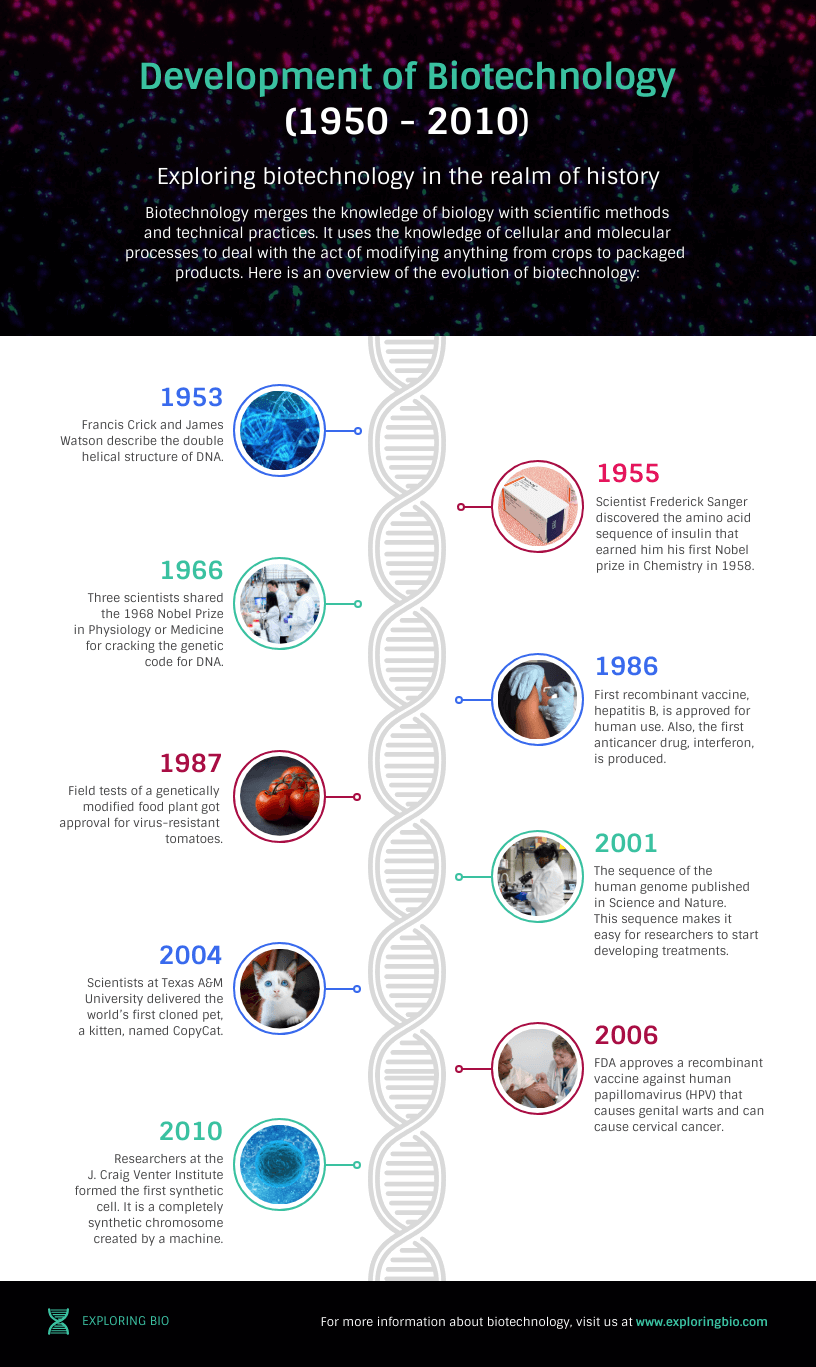
5. Timeline Infographics: This infographic presents events, dates or achievements chronologically. They are visually appealing and effective in conveying a story or historical progression. Timeline infographics can help simplify information, making it easier for the audience to understand and remember the content presented.

6. Interactive Infographics: These infographics require user interaction to display information, often making them more engaging and immersive. Interactive infographics promote personalized learning by allowing users to explore and uncover specific details they seek, transforming passive observation into active participation and promoting a more profound understanding of the subject matter.
Examples of effective life and health infographics in 6 top subcategories
Ready to draw inspiration from some fantastic life and health infographic examples? Check out these high-quality infographics in different subcategories:
- Nutrition and diet
Nutrition and diet-based infographics are comprehensive visual tools that provide key information on various aspects of nutrition and dietary guidelines, from portion control and macronutrients to simple diet habits like juicing for beginners to jumpstart your nutrient intake. The types cover topics such as portion control, macronutrients, meal planning, low calorie meal and healthy eating tips, offering a concise and accessible resource to promote informed decision-making for a balanced diet or even restrictive diets such as the Carnivore diet.
Food Pyramid
The Food Pyramid Infographic is a visual representation of a balanced diet, illustrating the recommended proportions of different food groups for optimal nutrition. It depicts a hierarchical structure, with the base consisting of foods like fruits, vegetables, and whole grains, followed by protein sources, dairy products, and fats in decreasing order, highlighting the importance of variety and moderation in maintaining a healthy diet.
Here’s an example of a pyramid infographic that can easily be customized:
Vitamins and Minerals in Everyday Foods
This infographic provides a visual representation of common foods and the essential vitamins and minerals they contain. It serves as a helpful reference guide for individuals looking to understand the nutrient content of their everyday diet and make informed choices about their nutrition.

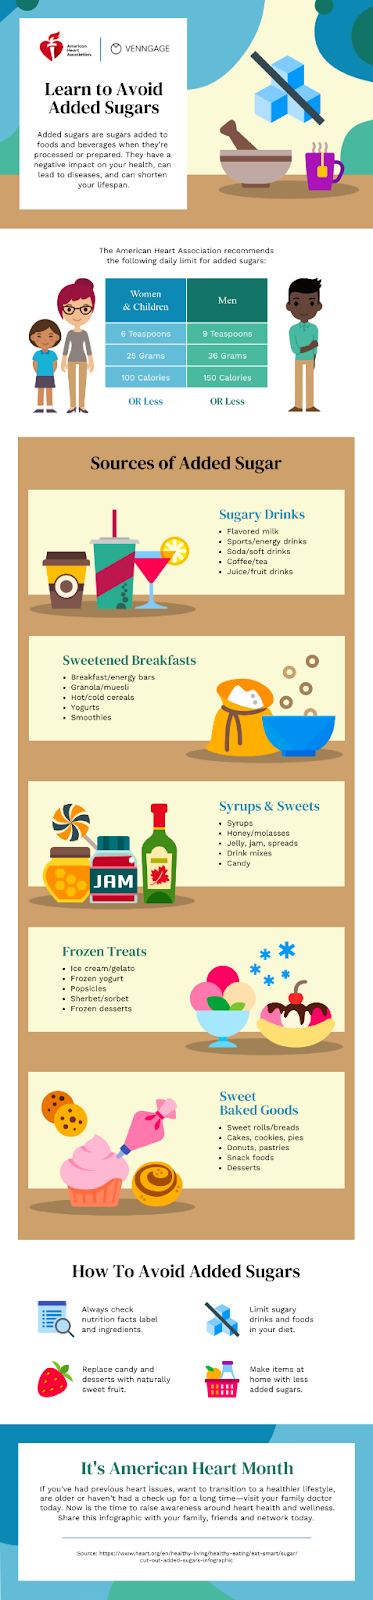
The Effects of Sugar on Your Body
This health infographic highlight the impact of sugar consumption on various aspects of the body. It presents the potential consequences of excessive sugar intake, such as weight gain, tooth decay, increased risk of chronic diseases, and energy crashes, raising awareness about the importance of moderating sugar consumption for maintaining overall health.
Guide to Superfoods
These types of media guides outline a variety of nutrient-dense foods known as superfoods. It provides information about these foods’ unique health benefits and nutritional properties, helping individuals make informed choices to incorporate these powerhouse ingredients into their diet for optimal health and wellness.
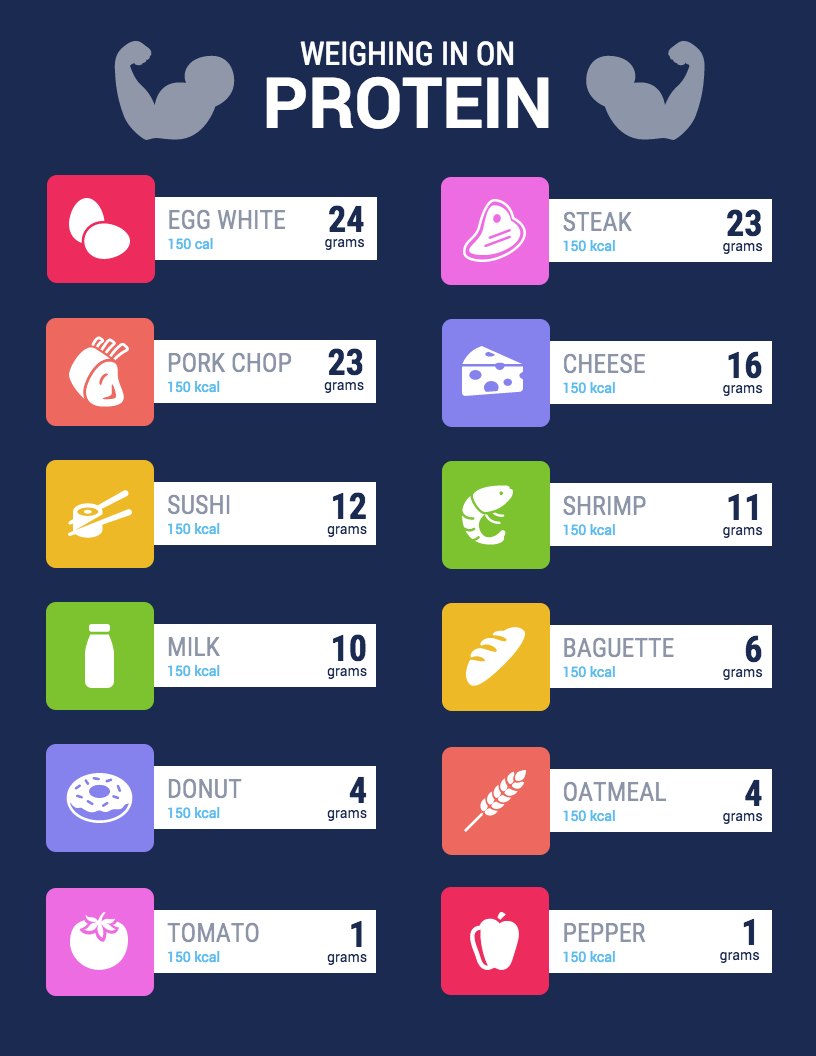
Vegetarian Protein Sources
This is a visual reference guide that lists a wide range of protein-rich foods from various sources. It provides valuable information about the protein content in different food items, helping individuals identify and incorporate diverse protein sources into their diet, whether they follow specific dietary preferences or have specific protein requirements for their fitness or health goals.
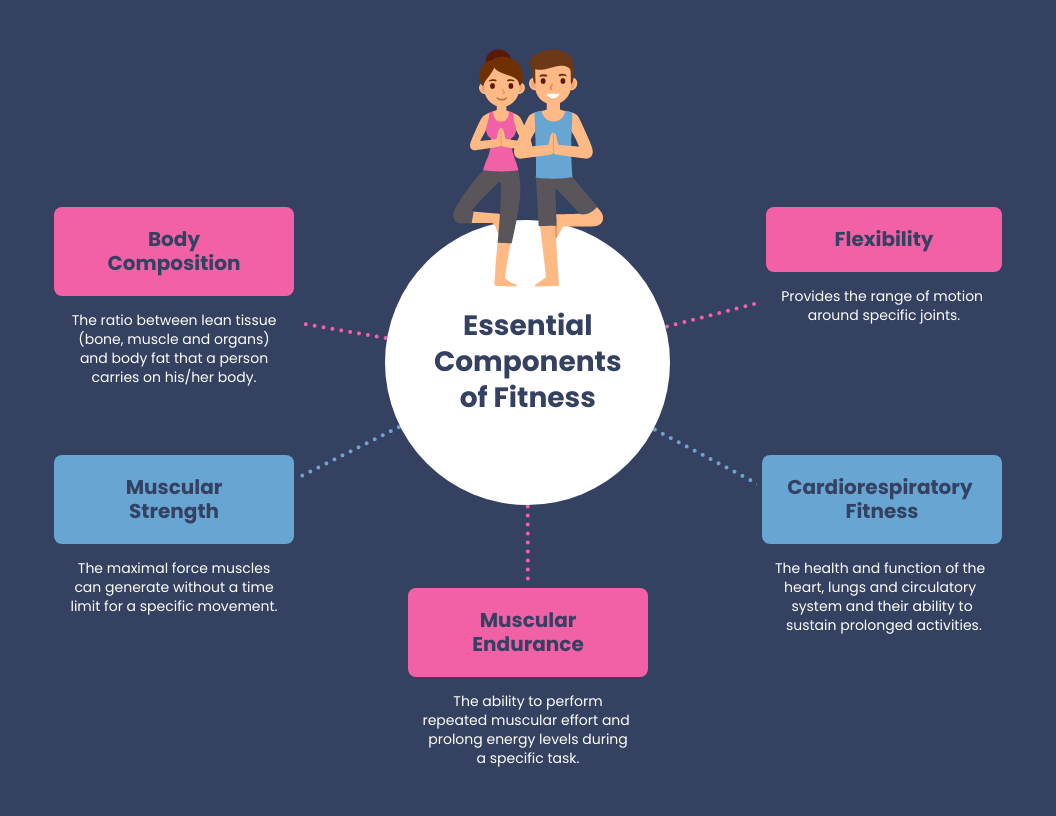
- Exercise and fitness
Exercise and fitness infographics are dynamic visual resources that present a wide range of information related to exercise and physical fitness. It includes illustrations and tips on different types of exercises, workout routines, correct deadlift form and the benefits of regular physical activity, serving as a handy guide to inspire and motivate individuals to adopt an active lifestyle and prioritize their fitness goals.
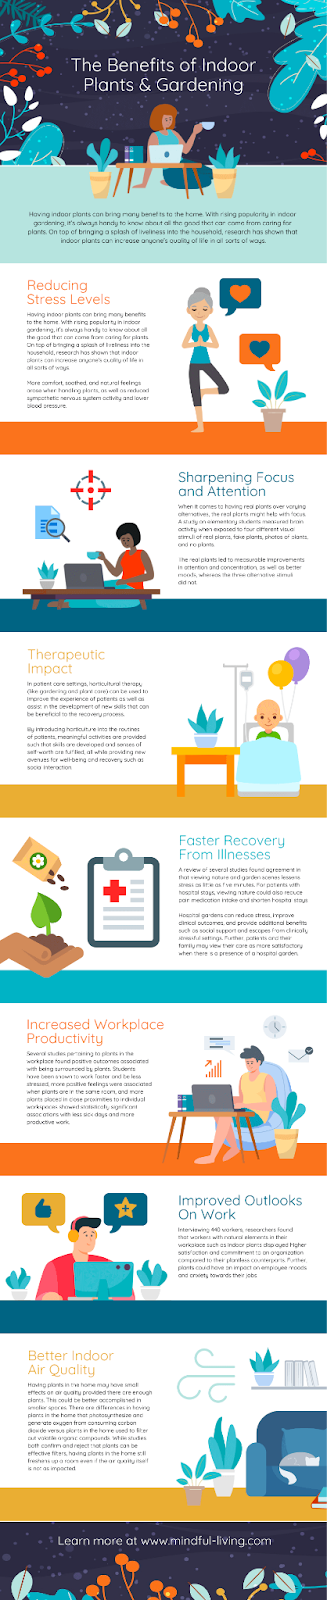
Benefits of Exercise
Let’s all admit it, exercise isn’t always fun – but it does have extremely great benefits. An exercise infographic offers a concise and visually appealing way to highlight the benefits of physical activity. By presenting key information in a visually engaging format, it effectively communicates the positive impact of exercise on overall health and well-being. Whether it’s showcasing the cardiovascular benefits, stress reduction, or improved mood, an exercise infographic serves as a quick and accessible resource to motivate and inform individuals about the advantages of incorporating regular exercise into their lives.
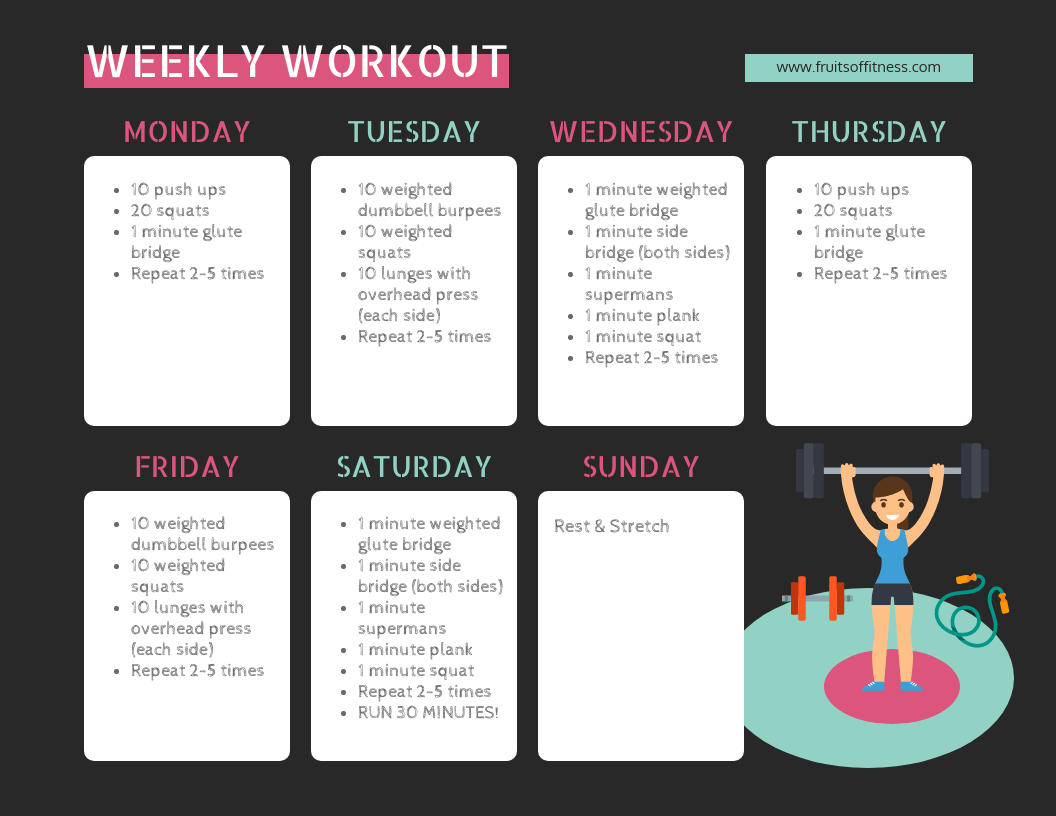
Top Exercises for Every Muscle Group
Yoga Poses for Stress Relief

Exercise Recommendations by Age Group
How to Boost Your Metabolism
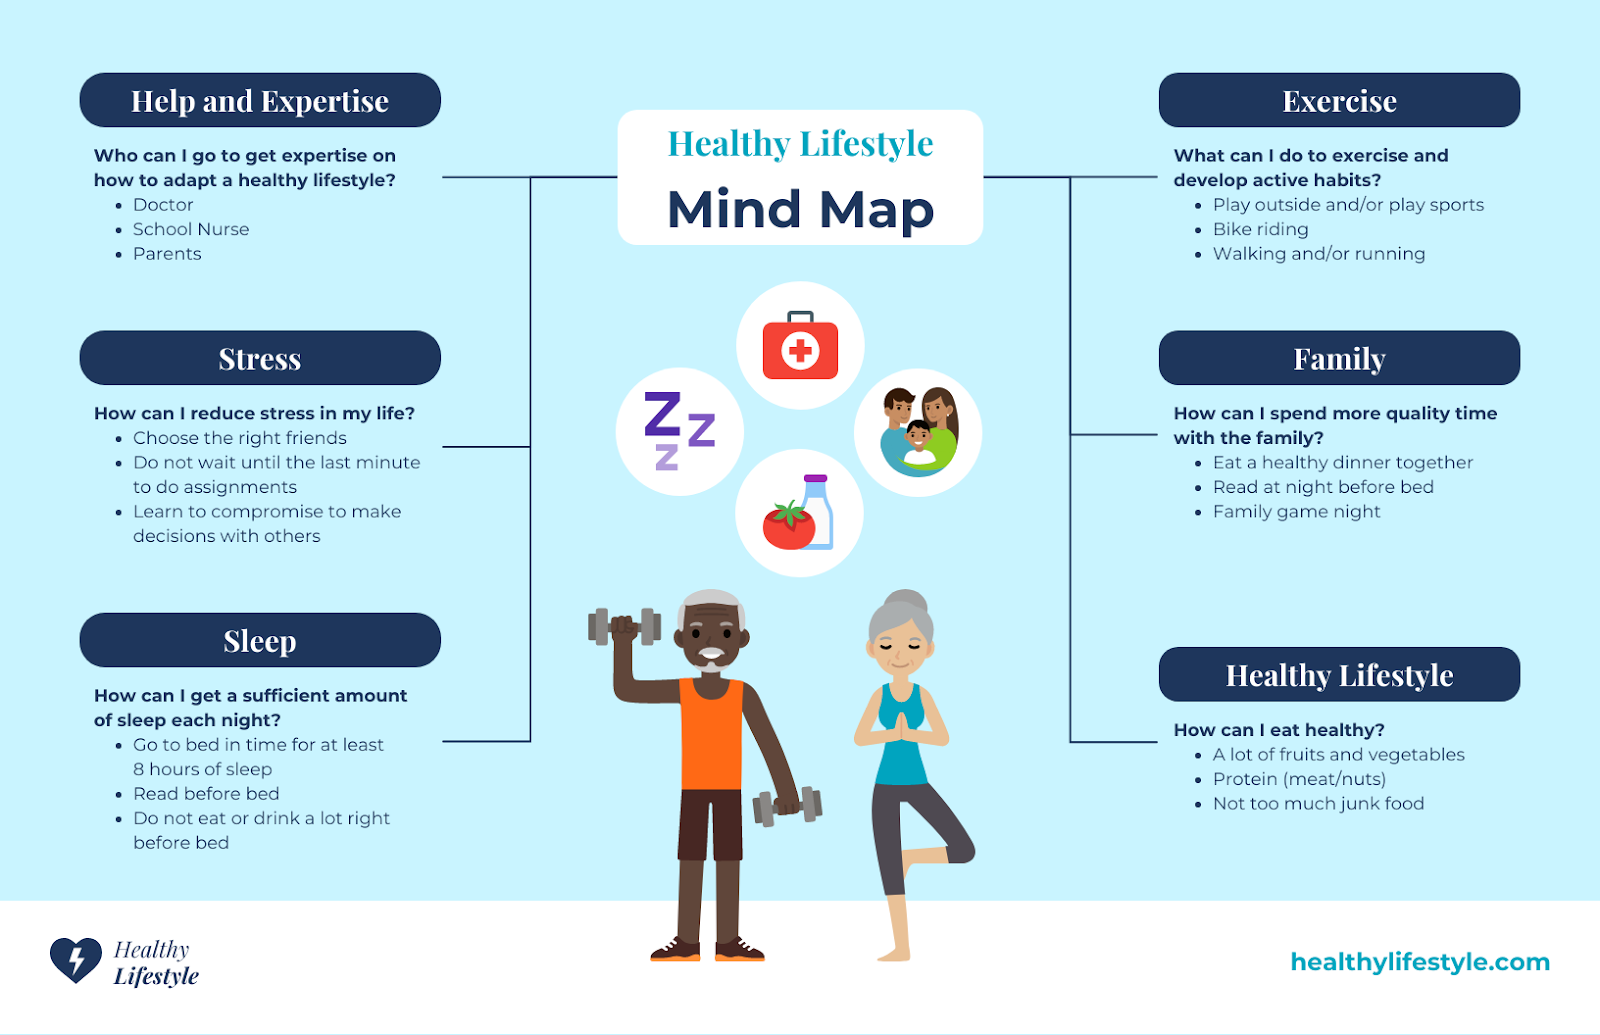
- Mental health and wellbeing
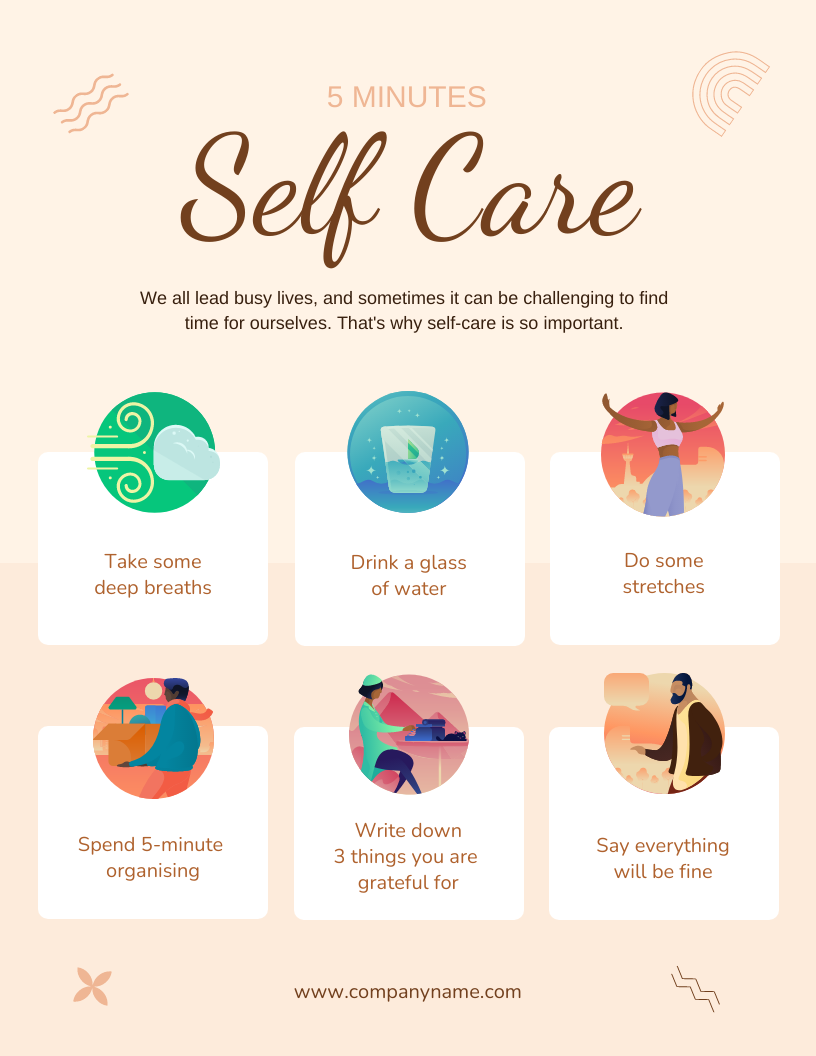
Mental health infographics cover various aspects of mental health and well-being. It presents key information on topics like stress management, self-care practices, mindfulness techniques and strategies for maintaining positive mental health, providing a concise and accessible tool to promote mental well-being, raise awareness and offer practical guidance for individuals seeking to enhance their mental resilience and overall emotional balance.
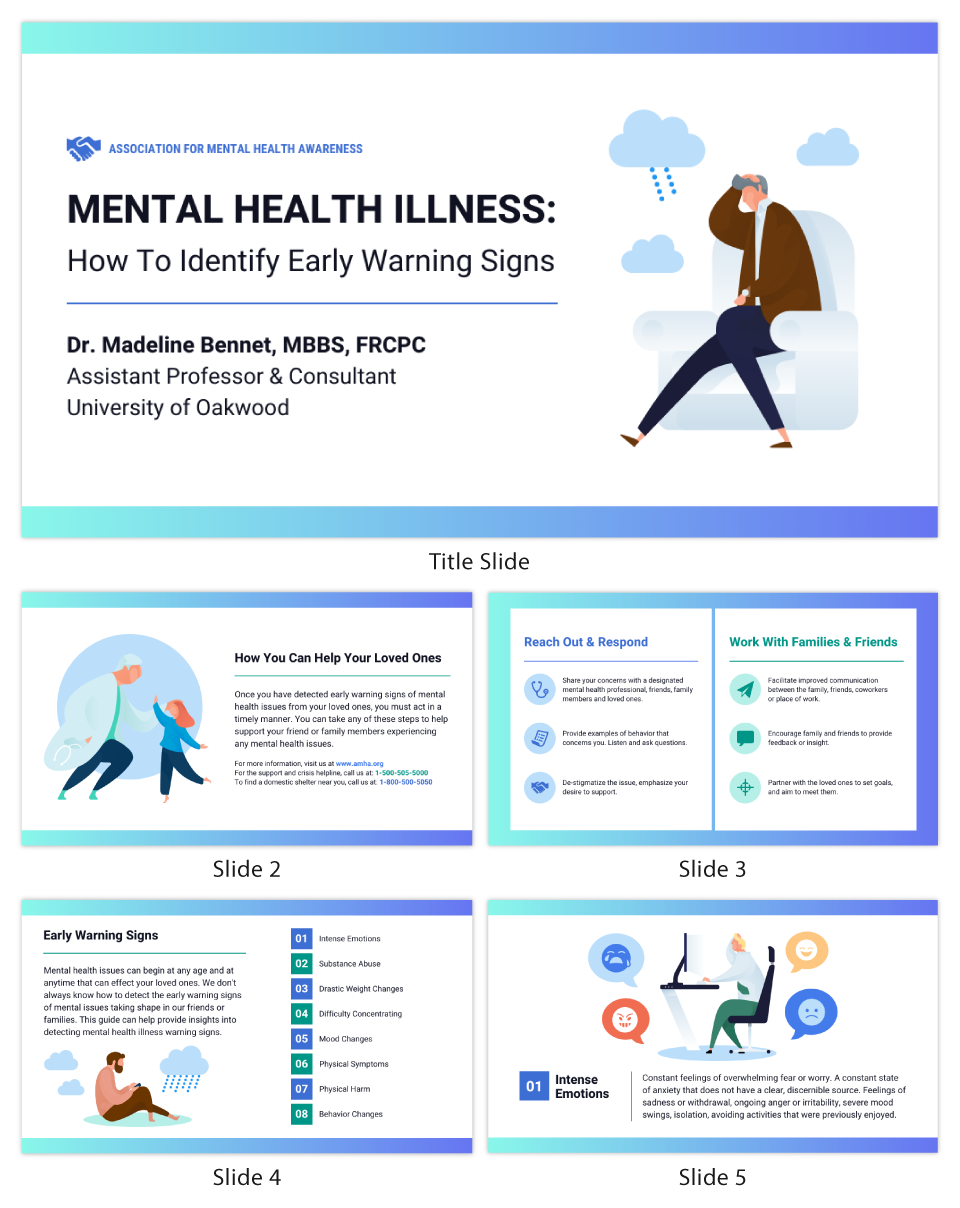
Signs of Depression and Anxiety
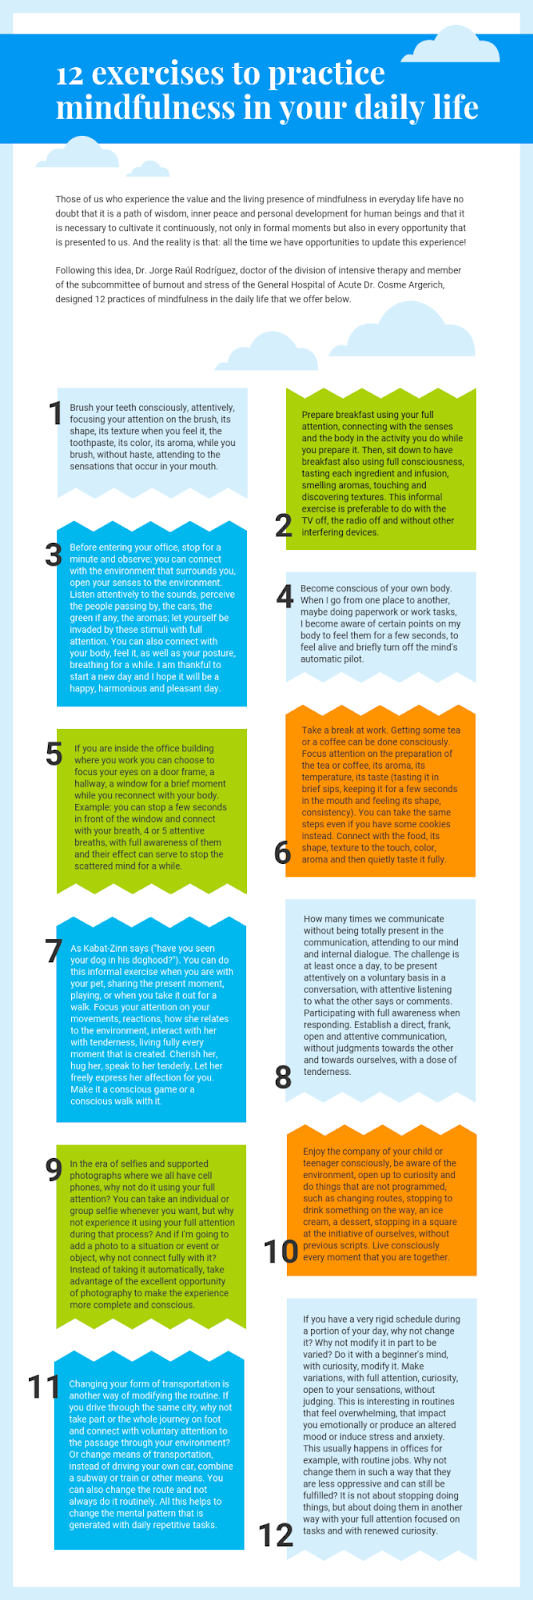
The Benefits of Mindfulness and Meditation
This infographic outlines the importance of mindfulness for everyday well-being, as well as mental health. By practicing mindfulness, individuals can cultivate a greater sense of self-awareness, reduce stress levels, and enhance overall emotional resilience. Through techniques such as meditation and focused breathing, mindfulness enables individuals to be present in the moment, fostering a deeper connection with their thoughts, emotions, and surroundings.
How Stress Affects the Body

Comparison infographics provide a visually compelling way to analyze and contrast data, allowing you to clearly identify the significant variables. Explore additional comparison infographics to find further inspiration!
Tips for Improving Sleep

How to Build Resilience
- Disease prevention and awareness
How to Prevent Heart Disease

Signs and Symptoms of Diabetes

The Importance of Vaccinations

Cancer Screening Guidelines

Steps to Take for Stroke Prevention

- Healthcare industry trends
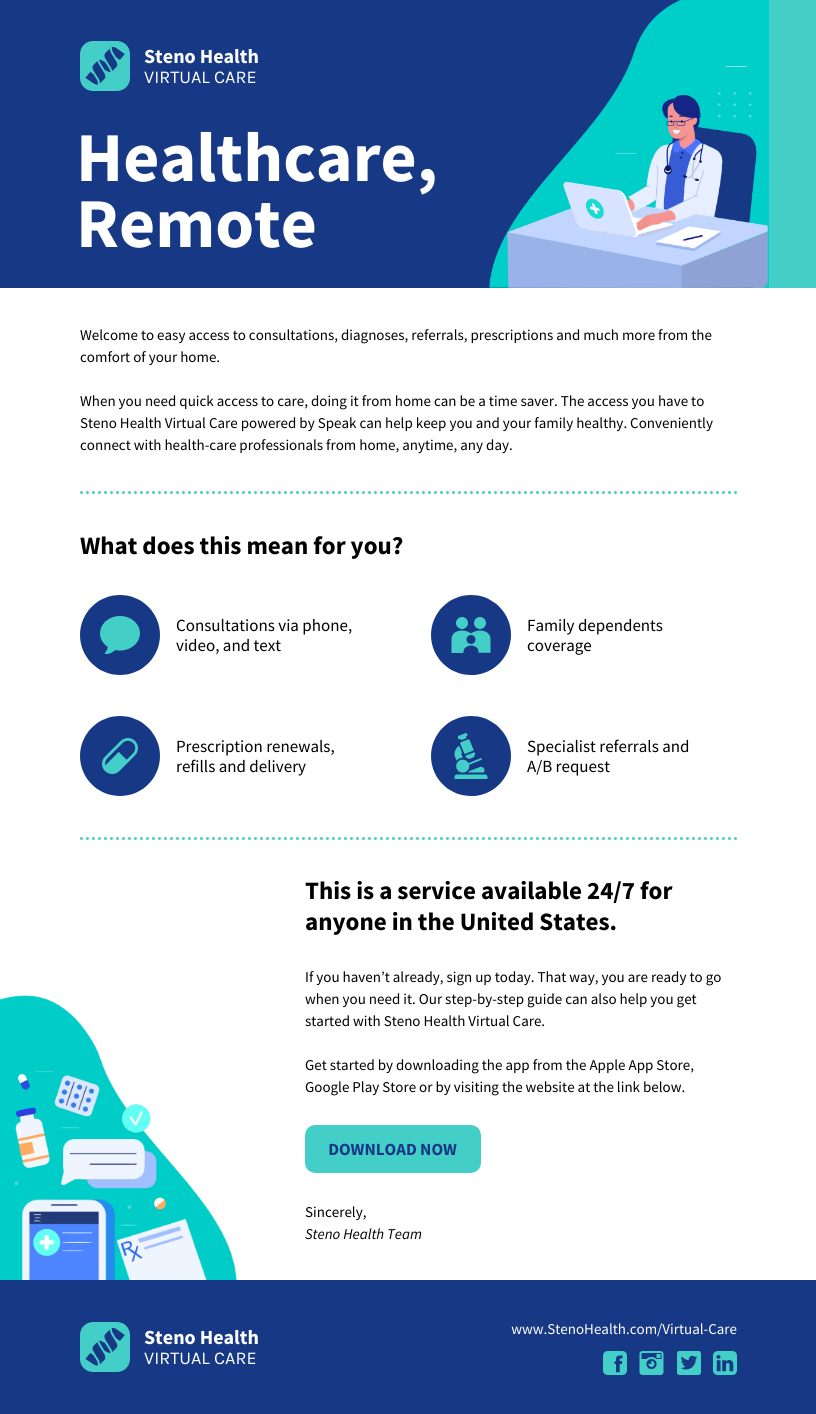
The healthcare industry is witnessing transformative trends that are reshaping the way care is delivered. Telehealth is gaining momentum, enabling patients to access medical services remotely, reducing the need for in-person visits and improving healthcare accessibility. Artificial intelligence (AI) and machine learning are being utilized to enhance diagnostics, personalize treatment plans and optimize operational efficiencies. Additionally, the growing focus on preventive care and wellness programs is shifting the industry’s emphasis towards proactive measures and empowering individuals to take control of their health. These trends are revolutionizing the healthcare landscape, driving innovation and paving the way for a more patient-centered and efficient future.
The Role of AI in Medicine

The Rising Cost of Healthcare

Telemedicine
The Future of Healthcare Delivery
- Medical research and advancements
Infographics on medical research and advancements often delve into transformative breakthroughs, innovative therapies and cutting-edge technologies that are reshaping the landscape of medical practices. Through these infographics, audiences can gain valuable insights into impactful discoveries, which contributes to the continuous progress aimed at improving patient outcomes.
The Human Genome Project
The Evolution of Antibiotics

The History of Vaccines

Tips for creating successful life and health infographics
Designing top-notch life and health infographics can be manageable. Follow these simple tips for success:
- Choose the right infographic type: When creating an infographic, consider the nature of your information and select a format that effectively communicates your message. A statistical infographic or comparison infographic might work well for data-heavy content, while a timeline or process infographic could be suitable for conveying a sequence of events or steps. You can look at the types of infographics in the life and health industry here.
- Focus on data accuracy and relevancy: Take the time to gather reliable and up-to-date data for your infographic. Ensure that your information is accurate and relevant to your target audience’s interests or needs. Properly citing your sources adds credibility to your infographic.
- Design for readability and engagement: Pay attention to the visual aspects of your infographic to enhance readability and engagement. Use legible fonts, appropriate font sizes and a clear color scheme. Organize your information in a logical flow and incorporate visuals such as icons, charts and illustrations to make your infographic visually appealing.
- Assess your target audience and their needs: Understand your target audience’s characteristics and interests. Consider their demographics, such as age, gender and location, as well as their psychographics, such as values, behaviors and preferences. Tailor your infographic’s content and tone to address their specific needs and challenges.
- Review and revise frequently: Regularly evaluate the effectiveness of your infographic and seek feedback from your audience or colleagues. Assess whether your infographic is achieving its intended purpose and make necessary revisions to improve clarity, impact, and relevance. Continuous refinement is key to ensuring your infographic remains valuable and impactful over time.
Importance of visual representation in communication and life & health education
- Clarity and comprehension: Visuals simplify complex health information, making it easier for individuals to understand important concepts. For example, using a visual diagram to illustrate the proper technique for CPR can help people grasp the steps more easily than reading a lengthy description.
- Increased engagement: Visuals captivate and hold attention, leading to better engagement and interest in life and health education. An infographic presenting the benefits of regular exercise may attract more attention and encourage individuals to adopt a healthier lifestyle.
- Retention and recall: Visual representations are memorable, aiding in information retention and recall. A well-designed infographic on the effects of smoking can leave a lasting impression, helping individuals remember the risks associated with tobacco use.
- Multilingual communication: Visuals transcend language barriers, allowing for effective communication with diverse audiences. Using pictorial representations in health campaigns ensures accessibility and understanding across different cultures and languages.
- Behavior change: Visuals can influence attitudes and behaviors, leading to positive health outcomes. For instance, a series of images depicting the harmful effects of sun exposure can motivate individuals to use sunscreen and practice sun-safe behaviors.
- Data visualization: Visual representations of health statistics and research findings enable better interpretation and analysis. Presenting vaccination rates through a color-coded map or health statistics infographics can quickly highlight areas with low immunization coverage, aiding in targeted interventions.
Check out this blog post to learn healthcare visualization data can play a prominent role in spreading awareness.
- Emotional impact: Visuals can evoke emotions and create connections, fostering empathy and driving action. Powerful images in public health campaigns on mental health can reduce stigma and encourage individuals to seek help.
Use Venngage to design impactful life and health infographics
Venngage is a user-friendly infographic creator that offers countless templates and customization options to bring your designs to life.
Some notable features include the ability to customize text, colors, and visuals to suit your brand and content, as well as modifying the layout and structure with easy-to-use drag-and-drop functionality.
Here’s how to create an infographic with Venngage in a few simple steps:
1. Sign up for a free account on Venngage’s website.
2. Browse through their wide selection of infographic templates and choose one that suits your needs.
3. Edit the template using Venngage’s user-friendly editor, customizing text, colors, and images.
4. Save and download your creation as a high-quality image file or embed it directly onto your website.
Infographics for a healthier you: Educating, empowering, and inspiring wellness

Medical infographics and healthcare infographics have a significant impact on raising awareness and promoting positive behaviors related to various medical topics. These infographics address stressors that impact our well-being, offering insights into stress management techniques, mindfulness practices and tips for self-care that can benefit many doctors, healthcare professionals, and the general public. By illustrating the importance of healthy habits like regular exercise, balanced nutrition and adequate sleep, they encourage individuals to adopt a holistic approach to their well-being and benefit from a healthier life.
Infographics also play a crucial role in promoting healthy aging by providing tips on maintaining cognitive function, staying active and managing age-related health conditions. They debunk common myths surrounding illnesses, fostering a positive mindset and encouraging individuals to embrace healthy aging practices that can benefit their overall health. Heart health tips are often featured in infographics to raise awareness about cardiovascular well-being, offering guidance on maintaining a heart-healthy diet, understanding risk factors and implementing preventive measures to protect against heart disease. They empower individuals to take control of their heart health by making informed lifestyle choices and can benefit individuals of all ages.
When creating impactful medical infographics, ideas can range from showcasing healthy recipes, exercise routines, mental health self-care practices or debunking popular health myths. Designers and creators can make use of public health data and infographic templates to streamline the creation process. These templates provide a starting point for organizing information, ensuring clarity, and maintaining visual consistency while allowing for customization to fit specific needs in the healthcare industry.


