


Infographics and PowerPoint are both powerful mediums to visually share information. So what happens when you combine both?
You get the superhuman ability to present information and hold people’s attention.
But creating infographics isn’t as straightforward as a slide deck. Fortunately, you can use PowerPoint itself to create infographics. Nothing to worry about, right? If you like dull infographics, then sure.
But if you want to create professional infographics that take your presentations to the next level, you need an easy-to-use Infographic Maker and customizable infographic templates that integrate into your presentations.
Click to jump ahead:
- What is an infographic?
- How to use infographics in PowerPoint
- How to create infographics in PowerPoint
- How to create infographics with Venngage
- Conclusion
- FAQs
What is an infographic?
An infographic is a visual that combines graphics, charts, text, and images to show data, explain concepts, or convey messages in a concise format.
They’re very popular, especially in presentations. Why?
Because they keep people’s eyes on the screen…literally.
Jokes aside, infographics allow you to present information or engage in data visualization in very little space effectively.
Here’s a great example example of a presentation that uses infographics well:

How to use infographics in PowerPoint
PowerPoint presentation slides are meant to hold the audience’s attention. This is why you’re taught to use visuals over text when possible.
However, no one talks about infographics in presentations even though they help add an extra level of visual oomph.
Here are some ways you can use infographics in PowerPoint to your advantage:
Make things easy to remember
Infographics can simplify concepts and present data in a clear manner, which makes them an ideal tool to get people to remember important parts of your presentation.
Here’s an example of an infographic that can be powerful in a presentation.

Present research
Presenting raw research in PowerPoint is challenging, but again infographics are a great solution.
They can convert complex data into something visually engaging that is accessible and understandable to your audience.
Here’s a great example of how you can present research with infographics:

Transform complex data into digestible content
Presenting a lot of data points in PowerPoint can be challenging.
But if you use an infographic, you can combine the power of charts and graphs with visuals to highlight key insights and trends.
Here’s an example of an infographic that does this well:

Explain a process
Explaining processes is a key goal of business reports. But doing with PowerPoint slides can be cumbersome. Do you really need a new slide to present each step?
You might, unless you use an infographics which are great at providing a deep understanding by presenting information sequentially.
Here’s an example of a process infographic that’ll work great in PowerPoint:

Make things easy to compare
Infographics are also great at comparing different sets of data, ideas, or scenarios.
If you want to compare data, products, or stats, forget about flipping back and forth between slides and use an infographic instead.
Comparison infographics help viewers quickly grasp similarities, differences, and relative magnitudes without getting lost.
Here’s a comparison infographic that’ll make a great addition to any PowerPoint presentation.

Examples of PowerPoint infographics
Now that you’ve seen how infographics help make presentations better, let’s see a few examples of PowerPoint slides that integrate infographics effectively.
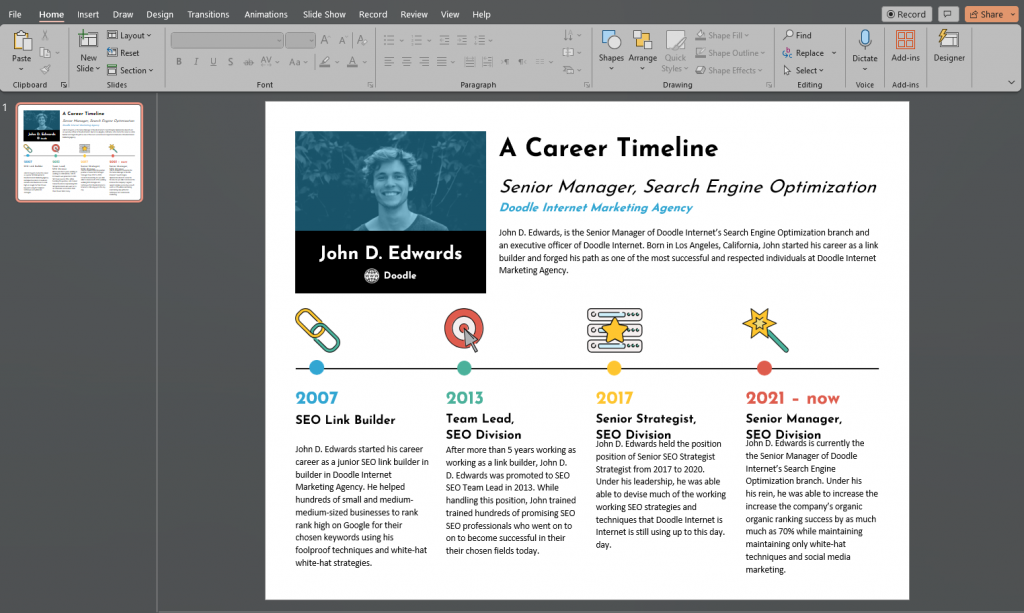
Timeline infographic

Geographical infographic

How to create an infographic in PowerPoint
If you’ve got a copy of PowerPoint on your device, the good news is that you can create infographics for your presentations right within the tool itself.
Here’s an overview of how to create an infographic in PowerPoint (don’t miss the detailed walk-through below!).
- Create a new presentation
- Select the “SmartArt” option
- Choose your infographic template
- Format and customize your infographic
- Review and finalize
- Export
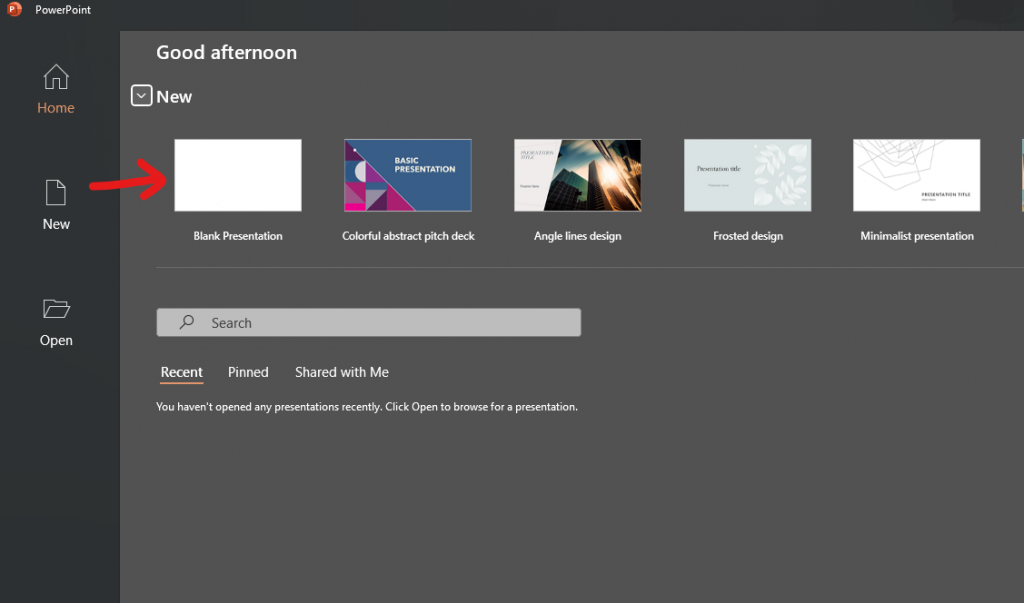
Create a new presentation
Load up PowerPoint and select the “Blank Presentation” option.
If you already have an existing presentation open, select “File” > “New”.
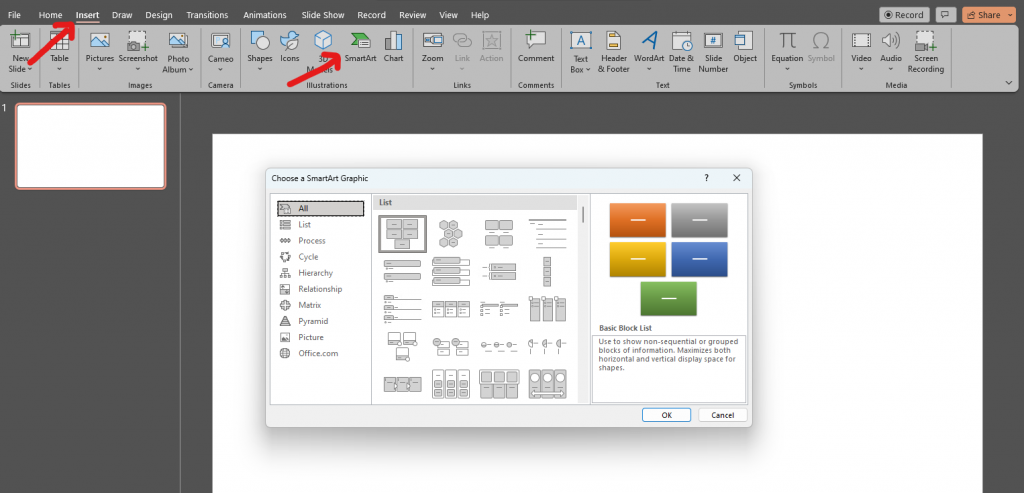
Navigate to the SmartArt option
To add an infographic to your slide, you’ll need to select a infographic template from PowerPoint’s library.
To find it, click on “Insert” > “SmartArt“. You should see options to add various infographic types like process infographics and list infographics.
Insert your infographic
Once you’ve chose an infographic type, hit “OK“.
In my case, I went with a process infographic. Your slide should look something similar to this.
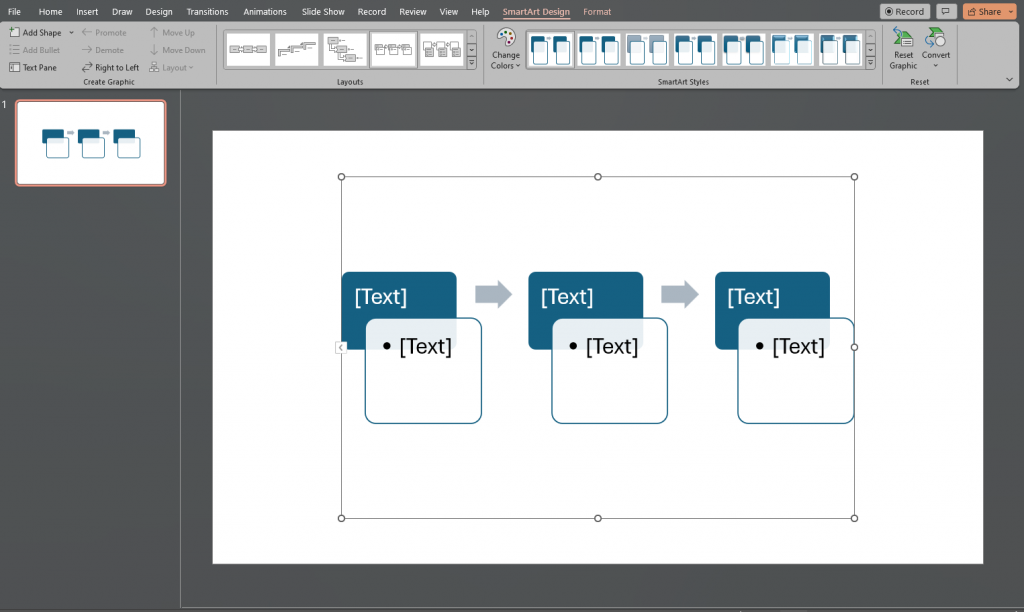
Notice the “SmartArt Design” and “Format” tabs that show up when you have the infographic selected? These are your go-to tabs for infographic customization, but I’ll come back to that later.
Add text and images
PowerPoint gives you only a basic infographic structure which means you have to add text and images manually.
While text is easy to add, trying to insert images into PowerPoint infographics is a real headache.
For example, this is what happens when I try to insert a stock image into one of my process box.
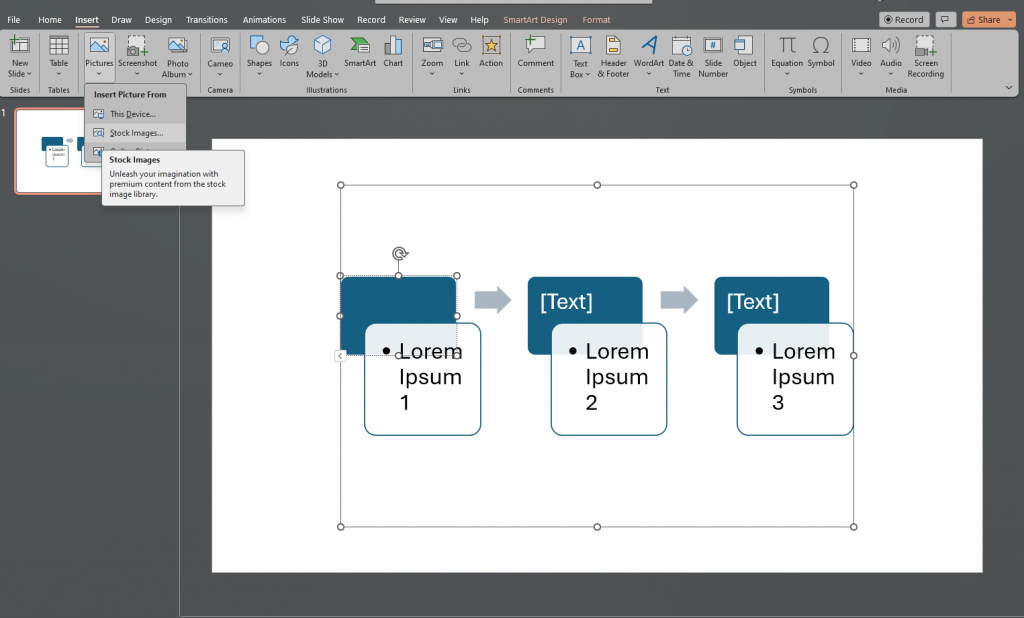
It was a disaster! To make this usable, I’ll have to manually shrink the size and make it fit into its proper location.
Customize your infographic
Let’s ignore for a minute our image debacle from the previous step.
If you have a text-only infographic, “SmartArt Design” and “Format” options make editable infographics a reality. You can easily adjust colors or text for an infographic in a PowerPoint slide.
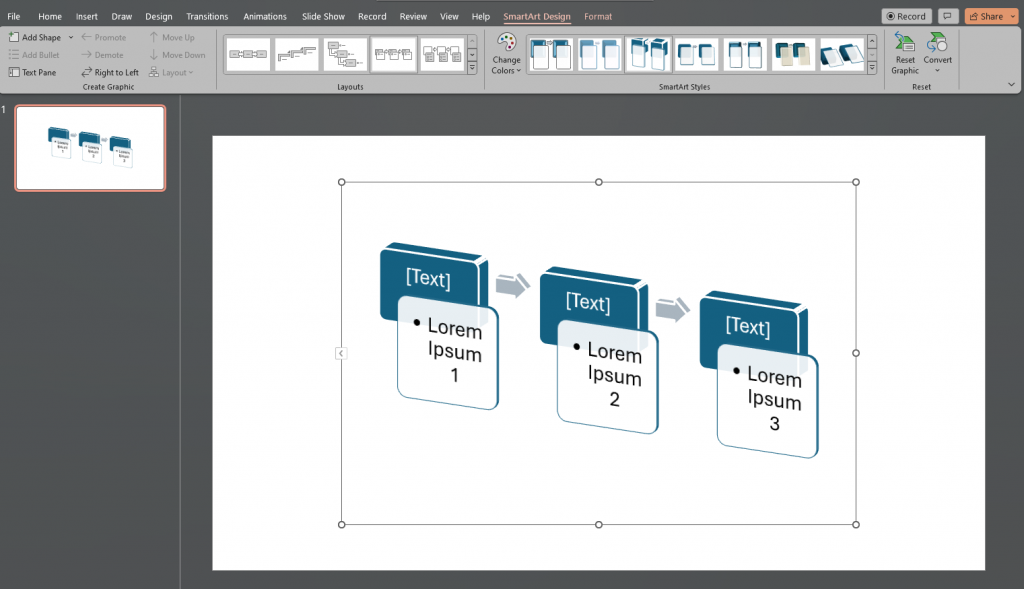
For example, I was able to change the layout and style of my infographic using pre-made settings. It took just two clicks.
Save and share your infographic
Once you’re done editing and like the end product, your infographic is ready!
The good thing about PowerPoint infographics is that you don’t have to save them anywhere unique since they’re already part of the presentation.
But besides that, there are many things I wish that could have been done better.
For example, I don’t know if you noticed, but PowerPoint has a severe limitation when it comes to templates and layouts.
For a tool that’s all about creativity, it’s a bit of a let-down that you can’t give infographics the ideal touch you want (remember how difficult it was to add images to my infographic?).
There are other other platforms you can use like Google Slides which also offer a variety of PowerPoint templates, but they still won’t give you the creative capabilities of Venngage.
If you’re exploring other tools too, check out our step-by-step guide on how to create an infographic in Google Slides for a simple and flexible design option.
How to create infographics with Venngage
With PowerPoint, basic and boring infographics is what you can expect.
But with Venngage, you can create your own infographics that are colorful, cool, and easy to customize and make your own even if you don’t have design skills.
Note: Some of our infographic templates are free to use and some require a small monthly fee. Sign-up is always free, as is access to Venngage’s online drag-and-drop editor.
And the best part?
It’s free to use and Venngage infographics integrate right into PowerPoint.
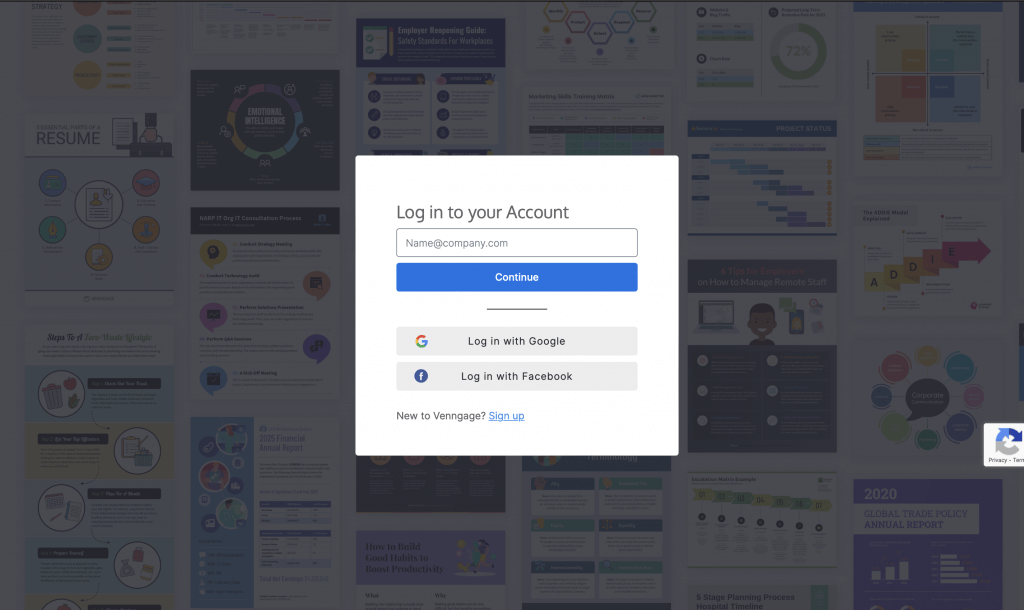
Step 1 – Sign up for a Venngage account (it’s free!)
Sign up for a Venngage account using your email, Gmail or Facebook account.
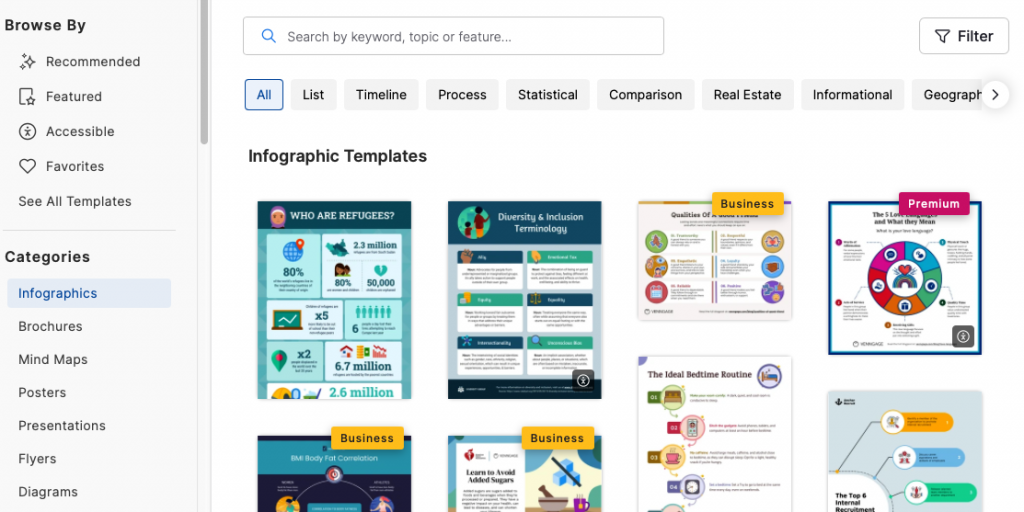
Step 2 – Select a infographic template from our library
Venngage offers tens of thousands of free templates that’ll help you present information in a format that is more engaging.
Whether you need a comparison infographic, geographic infographic, statistical infographic, browse our infographic templates to find one that you want to integrate into a presentation.
Step 3 – Edit your infographic in a few clicks
With Venngage templates, you don’t need to be a designer or need design skills to create beautiful infographics for PowerPoint.
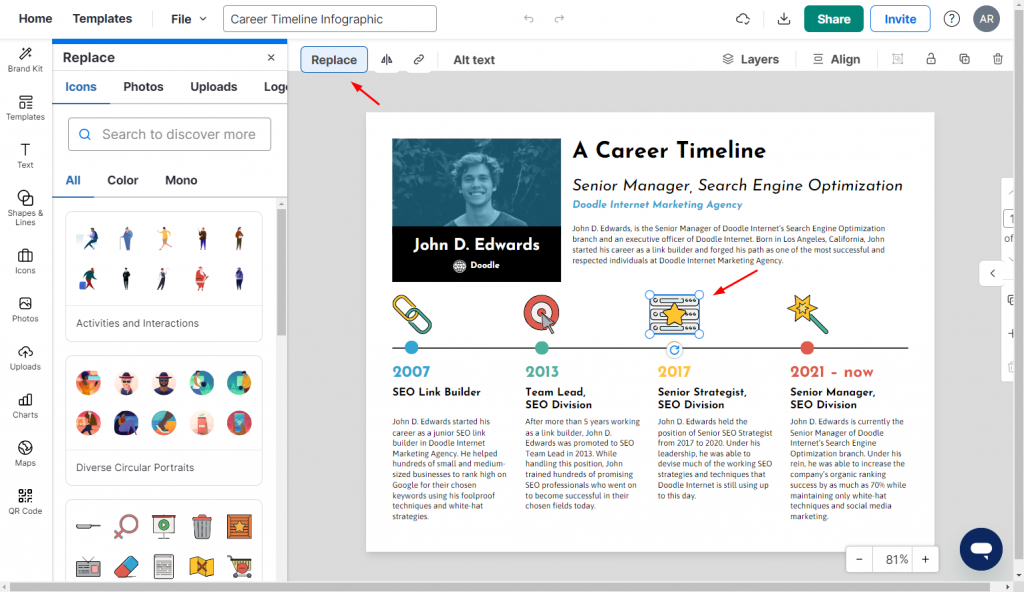
For example, let’s say I want to edit this timeline infographic:

Want to replace icons or change the color scheme? Venngage provides access to an in-editor library of thousands of free, professional icons, plus diverse icons
Just pick an element and click replace.
Also, the Venngage editor has accessibility built in! This means you can test your design for factors like color contrast and more to ensure people living with impairments can understand your designs.
There’s no need to remediate!
To test your design click on “File” > “Accessibility” to get access to the accessibility checker.
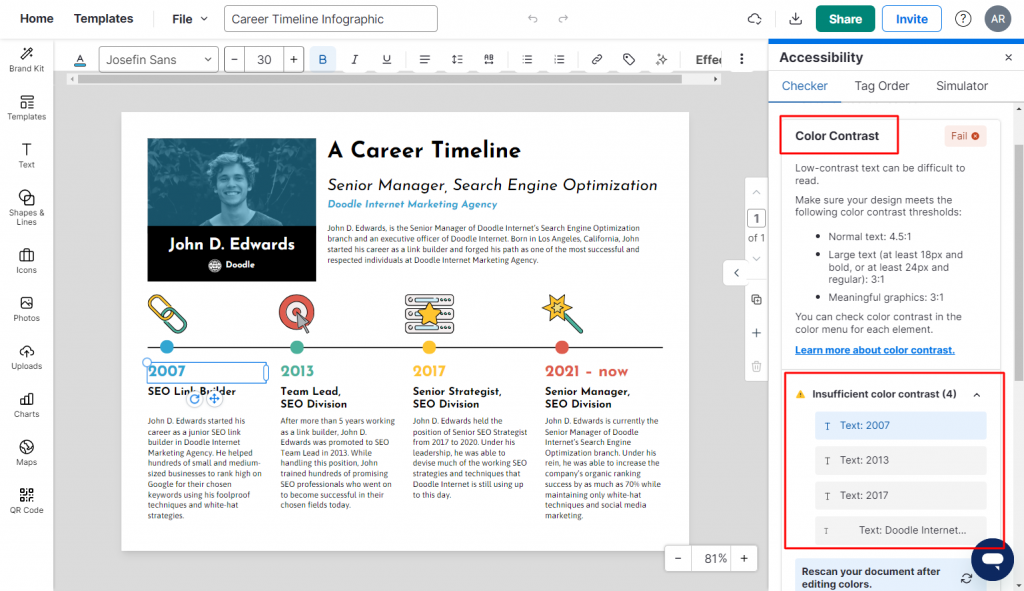
Not only does Venngage tell you if your design passes or fails certain parameters, but it also tells you where issues are.
Step 4 – Share a link to your infographic for free or upgrade to download
When you’re happy with a design, you have two options. If you’re a free user, you can share a link to your infographic or free.
But if you have a Business plan, you can download your infographic as PNG, PDF, or even as PPT.
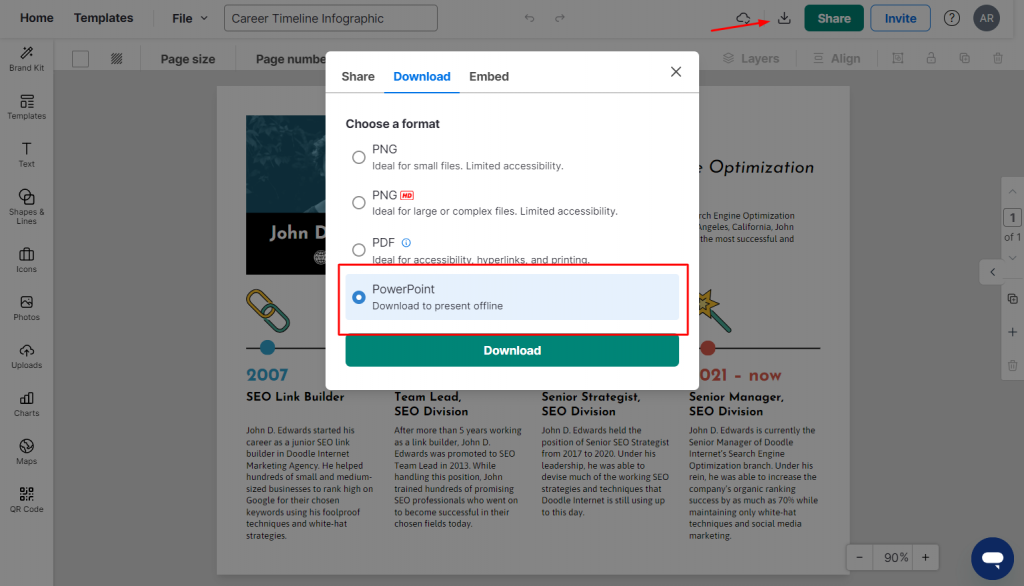
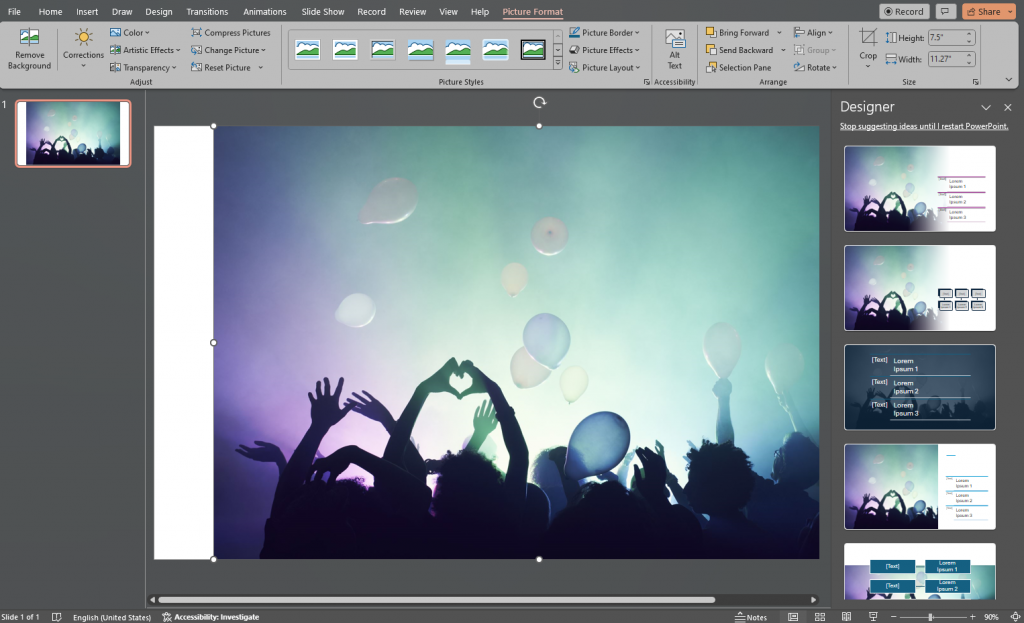
I saved my infographic as PowerPoint file and here’s how the Venngage template looks in PowerPoint.
With a Business account, you’ll also get access to My Brand Kit, which lets you apply your brand colors to any template with one click.
Conclusion: Leave boring visuals behind and level up your presentations with Venngage infographics
If you want to create presentations that actually get people’s attention, then say no to PowerPoint infographics.
Instead, use Venngage to create colorful and polished infographics that’ll make your presentations engaging and leave everyone talking long after.
Frequently Asked Questions
What is the difference between a PowerPoint and an infographic?
PowerPoint presentations and infographics serve distinct purposes. PowerPoint presentations deliver information in structured format and consist of slides containing text, images, and multimedia elements. In contrast, infographics are visual representations of data or concepts designed to convey complex ideas quickly and clearly.
Why do we use infographics in presentation?
Infographics are used in presentations to enhance comprehension, engagement, and retention of information. By condensing complex data or concepts into visually appealing graphics, infographics make it easier for audiences to grasp key points quickly. In a presentation, infographics captivate viewers and convey information more effectively than traditional text-heavy slides.
What is an infographic template in PowerPoint?
An infographic template in PowerPoint is a pre-designed layout or framework that provides a visual structure for creating infographics. These templates typically include placeholders for various infographic elements such as text boxes, charts, graphs, icons, and images, arranged in a visually appealing and organized manner.


