
PowerPoint Map Chart Presentation Template
Visualize information, show sales territories, or present historical data in your presentation by customizing this PowerPoint map chart template.

 100% customizable templates
 Millions of photos, icons, charts and graphics
 AI-powered editing features
 Effortlessly share, download, embed and publish
 Easily generate QR codes for your designs
- Design stylemodern
- Colorsdark
- SizeCustom (1024 x 576 px)
- File typePNG, PDF, PowerPoint
- Planfree
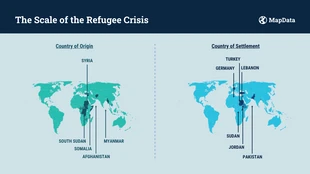
A PowerPoint map chart is a particular type of chart that uses geographical data to create appealing and informative presentations. You can use this kind of chart to display data such as sales figures, population density, or distribution of resources. These charts are an excellent way to visualize data and communicate information clearly and concisely. In business presentations, use them to show sales territories, target markets, or growth areas. Educators can use this chart to display geographic information or historical data. Other individuals can use it to create personal travel itineraries or track family history. A PowerPoint map chart must include two essential elements: geographical data and an attractive design. Geographical data is the foundation of any map chart. This data can be sourced from various sources, such as the Census Bureau or other government agencies. Once this data is acquired, it needs to be formatted so the audience can easily understand it. The second essential element for this chart is an attractive design. The layout of the PowerPoint map chart should be professional and eye-catching. It should also be straightforward to understand and
Related Presentation Templates
 1/5
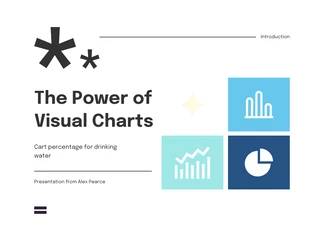
1/5visual chart presentations
 1/6
1/6visual chart presentations
 1/5
1/5health presentations
 1/5
1/5human resources presentations
business presentations
 1/5
1/5visual chart presentations
 1/5
1/5business presentations
 1/5
1/5marketing presentations
 1/5
1/5visual chart presentations
 1/5
1/5visual chart presentations
 1/5
1/5research presentations
 1/18
1/18finances presentations