


Flowcharts are effective tools for communicating and understanding complex processes. They can also be used to define business workflows in a PowerPoint presentation.
A PowerPoint flowchart requires a few steps to complete. But flowcharts are essential tools that can help you in project planning, managing workflows, or modeling business processes.
To show you how to create flowcharts, here is a guide on how to make a PowerPoint flowchart.
Creating flowcharts doesn’t have to be challenging. With Venngage’s Flowchart Maker, you can create effective diagrams without design experience.
Click to jump ahead:
- What is a flowchart used for?
- How to make a flowchart in PowerPoint
- Disadvantages of creating a flowchart in PowerPoint
- Advantages of creating a flowchart using Venngage’s Flowchart Maker
- FAQs about PowerPoint flowcharts
What is a flowchart used for?
Also called a process flowchart or process flow diagram, a flowchart is a model or illustration that depicts the sequence of steps involved in a process.
Here is an example of a flowchart that demonstrates the process of troubleshooting a computer’s startup process:

A flowchart (also spelled flow chart) shows clearly and in detail what happens at each stage in the process and how each step affects other decisions and actions.
Many types of flowcharts can be used to describe processes. Flowcharts can be used in different areas of business like administration, management, sales and marketing, and manufacturing and operations.
They are also widely used in fields such as computer programming, education, and engineering.
Generally, a flowchart can be used for:
- Defining and documenting a process
- Communicating a process to members of a team or organization
- Standardizing a process for efficiency and quality control
- Analyzing a process to identify areas of improvement
- Planning a project
- Solving a problem
- Training and onboarding
For example, this flowchart can be used by a finance or HR department to orient new employees about a company’s disciplinary process for misconduct, violations, and poor performance:

Using only a few words and simple symbols, flowcharts can make a process easy to understand at a glance. A successful flowchart will be able to convey information in a clear, coherent, and organized manner. Common elements of a flowchart include:
- A sequence of actions
- Materials or services that come in and out of the process (inputs and outputs)
- Decisions that need to be made
- People involved
- Timescale or duration of each step
Clear communication is the key to creating flowcharts. The ultimate goal of your flowchart should be to help those involved fully understand how the process works and what their part is in making it work.
Before you proceed to make a PowerPoint flowchart, here are some tips and considerations to look into:
- Get feedback from people involved in the process to ensure accuracy and consistency in the flowchart
- Keep your audience in mind and avoid technical terms to make sure the details of your flowchart will make sense to them.
- Use the right symbols to make the process flow logically.
How to make a flowchart in PowerPoint
The easiest way to make a flowchart in PowerPoint is to use the SmartArt feature. Just follow these 4 simple steps:
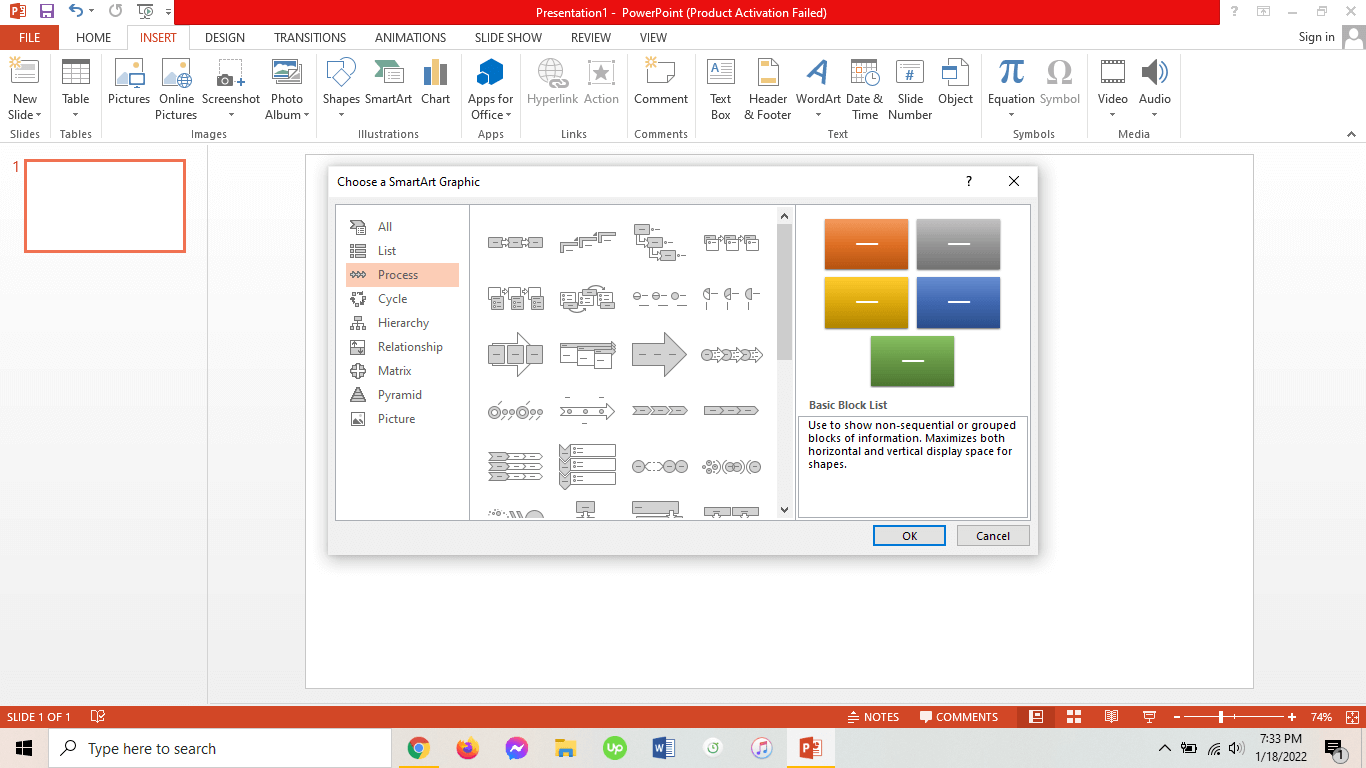
Step 1: Choose a SmartArt Graphic
On the Insert tab, choose SmartArt and browse SmartArt graphics from the Process option to pick a flowchart that best matches your process flow.
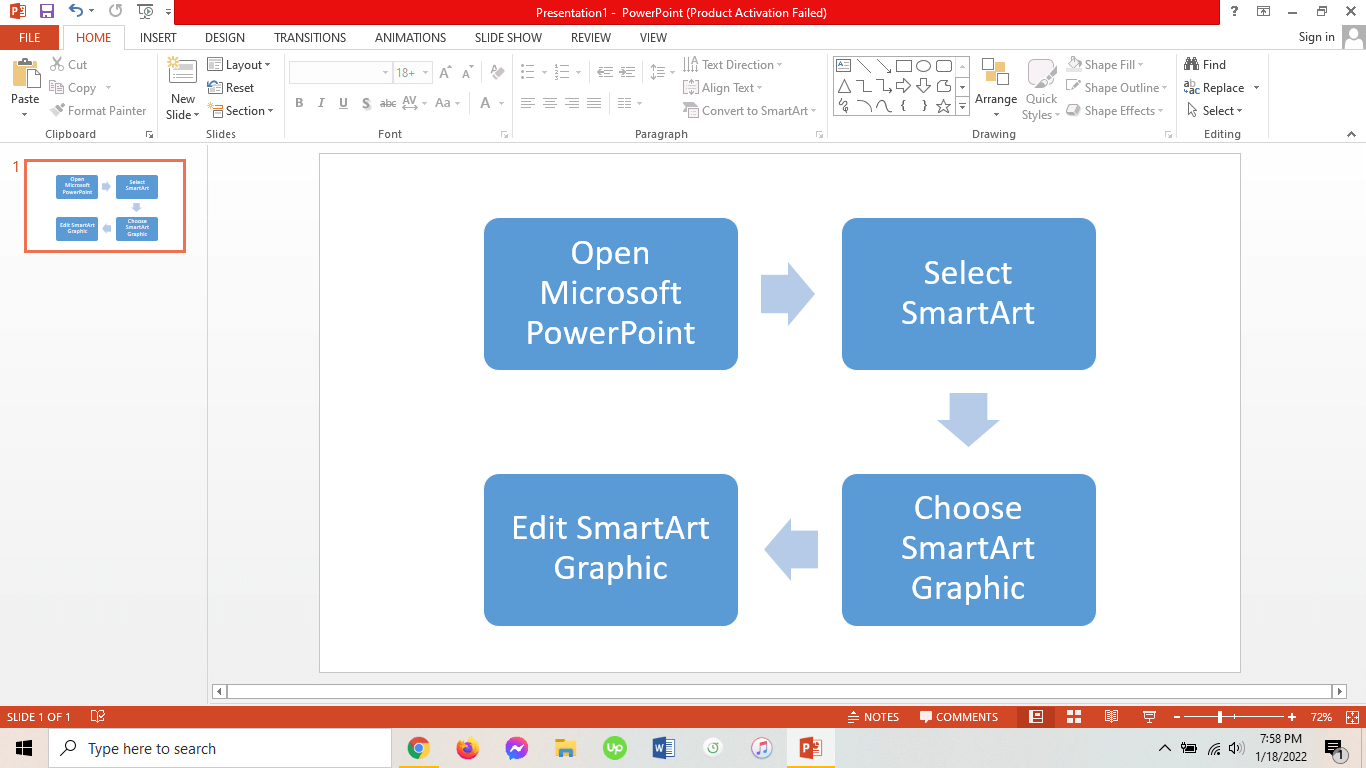
Step 2: Input process flow information
Depending on the flowchart you have selected, there will be a dialog box that will appear for you to fill in with the necessary information. At the same time, you can input the steps of the process directly into the shapes that have been created. They should be in sequential order.
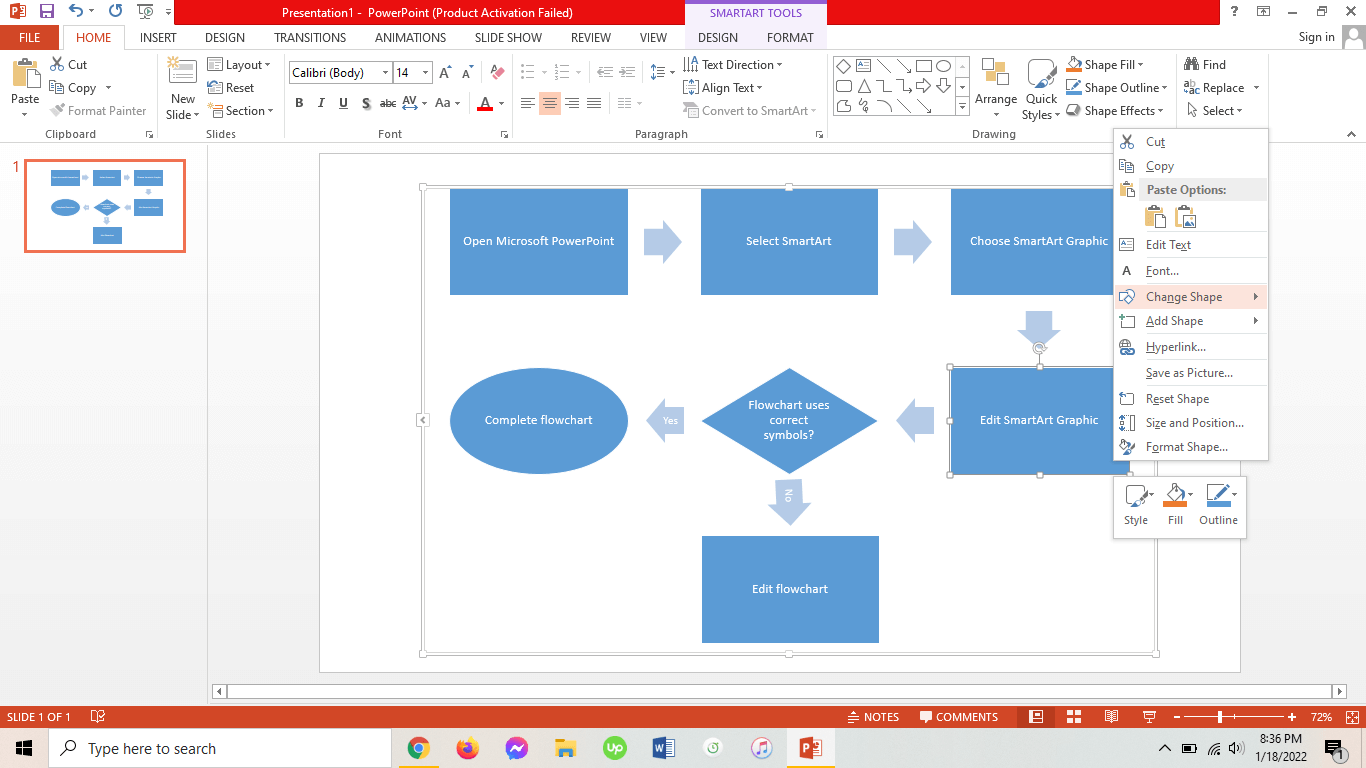
Step 3: Format your flowchart
Then, make sure to use the correct shapes for each part of the diagram. Here is a quick overview of the basic symbols that should make up your flowchart:
- Process symbol: Takes the shape of a rectangular box. Equivalent to one step in the process.
- Terminator symbol: Represents the start and end of a process. Has an oval shape.
- Flow arrow: Depicts the direction of the process flow from one step to another.
- Decision symbol: A diamond-shaped box that indicates a question to be answered ‘yes’ or ‘no.’
- Input or output symbol: Has a parallelogram shape. Represents the required input or produced output at a certain stage in the process.
- Connector symbol: Ideal for complex diagrams, it is shaped like a circle and used to link to another flowchart. Here is an example of a flowchart with connector symbols:

Change the shapes or add more shapes in your flowchart to reflect the right symbol for each part of the process. Simply right-click the object and choose Change Shape or Add Shape.
Step 4: Design your flowchart
Once you’re done formatting your flowchart, the last step is to apply colors and fonts to execute the design you had in mind. Now your flowchart is complete and ready for presentation.
Disadvantages of creating a flowchart in PowerPoint
The biggest disadvantage when you create flowcharts in PowerPoint is that there are no flowchart PowerPoint templates available to make the design process easier.
A SmartArt Graphic cannot offer a complete structure for your diagram the way that a flowchart PowerPoint template can. Sadly, PowerPoint templates need to be downloaded separately from third-party sources, and they might not even load or display properly upon editing on PowerPoint.
Advantages of creating a flowchart using Venngage’s Flowchart Maker
Luckily, with Venngage, you can create your design directly on the platform without needing to download any template or program.
Venngage’s online Flowchart Maker lets you choose from a vast collection of fully customizable diagrams and flowchart templates that can conveniently fit any use case.
This is just an example of a well-designed flowchart that you can produce with Venngage:

The Editor makes it easy to add or remove nodes with just one click. You don’t need to resize flowchart nodes manually. Add text, images, or icons and the node automatically resizes to accommodate your information.
Connect existing nodes or new nodes by dragging them across the canvas, and the Smart Editor will create connecting lines for you. You don’t need any design skills to make an effective diagram.
Make your flowchart presentation stand out by changing colors, illustrations, and backgrounds.
With the drag-and-drop feature, there is no need to resize connecting lines and text boxes; your flowchart will automatically scale upon dragging.
Additionally, My Brand Kit is a special feature for business accounts that allows you to upload logos, choose fonts, and set color palettes to easily apply your visual branding to every design.
Also available with a business account is the ability to download your flowcharts as a PNG or PDF file or a ready-made PowerPoint presentation.
Use our real-time collaboration feature to invite team members and work together on the flowchart. You can also leave comments and get feedback instantly.
Alternatively, you can share your design online, on social media, or via email completely for free.
FAQs about PowerPoint flowcharts
Does PowerPoint have flowchart templates?
Microsoft PowerPoint has a very limited library of templates for flowcharts and diagrams but there are some free PowerPoint templates available online.
However, free flowchart templates are usually made for simple illustrations and may not be applicable for complex diagrams. You will need some design knowledge to tailor the template to your needs.
What is the best program to create a flowchart?
Venngage’s intuitive Flowchart Maker makes it one of the best online tools to create polished flowcharts in a matter of minutes. The Venngage library has thousands of professional templates that are specifically made for businesses. Its drag-and-drop interface also makes editing smooth for both designers and non-designers alike.
How do I make a flowchart for free?
By signing up on Venngage, you can use the Flowchart Maker for free. To create flowcharts on Venngage, you need to follow only 5 simple steps:
- Sign up to create an account.
- Select a flowchart template.
- Add new shapes, lines, and labels.
- Design and brand your flowchart using logos, fonts, and colors.
- Save and share your flowchart.
In conclusion: Make a PowerPoint flowchart using Venngage to communicate processes effectively
With a PowerPoint flowchart, you can efficiently align your team and make sure that processes are understood and fulfilled correctly.
Take advantage of smart features and free templates and use Venngage’s Flowchart Maker to create a flowchart now.


